Cloud Performance Management Market Analysis North America, Europe, APAC, South America, Middle East and Africa - US, Canada, UK, Germany, Japan - Size and Forecast 2024-2028

Cloud Performance Management Market Analysis North America, Europe, APAC, South America, Middle East and Africa - US, Canada, UK, Germany, Japan - Size and Forecast 2024-2028

Published: Jul 2024 180 Pages SKU: IRTNTR75145

Market Overview at a Glance

$3.71 B
Market Opportunity
15.2%
CAGR
12.86
YoY growth 2023-2024(%)

Cloud Performance Management Market Size 2024-2028 

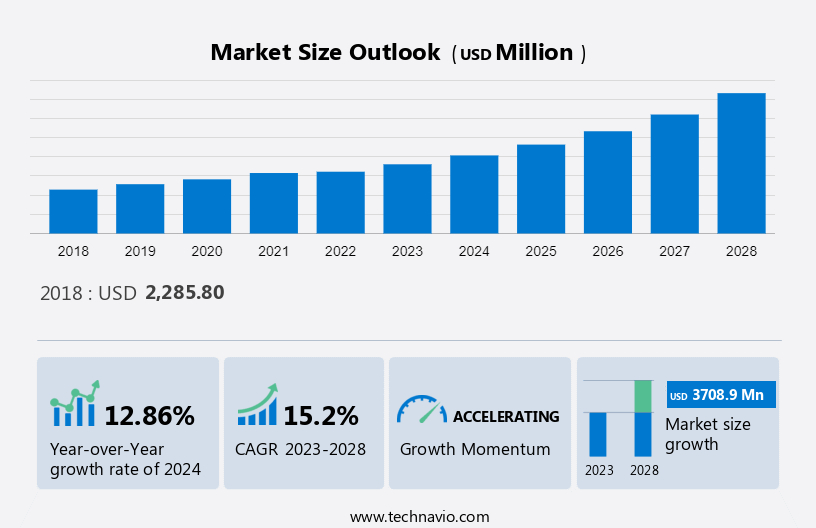
The cloud performance management market size is estimated to grow by USD 3.71 billion at a CAGR of 15.2% between 2023 and 2028. The digital transformation trend continues to gain momentum, with an increased adoption of cloud performance management solutions in various industries. This shift towards cloud-based technologies is driven by several factors, including the penetration of artificial intelligence (AI) and the growing spending on cloud-based solutions. Cloud performance management enables organizations to optimize their cloud infrastructure, ensuring optimal resource utilization, and improving application performance. AI plays a crucial role in this context by providing predictive analytics and automating performance tuning. The investment in cloud-based solutions is expected to grow significantly, as businesses seek to enhance agility, reduce costs, and improve operational efficiency. In this dynamic landscape, staying informed about the latest trends and best practices in cloud performance management is essential for organizations to stay competitive.

What will be the size of the Market During the Forecast Period?

Cloud Performance Management Market Size

To learn more about this report, View Report Sample

Market Dynamics and Customer Landscape

The market is driven by the need for faster product development and automatic scaling to manage varying computing power demands and unexpected spikes in usage. Embracing a cloud computing model addresses the challenges of fluctuating demand effectively. Cloud computing technologies enhance operational efficiency, supported by Machine learning for predictive analytics. Smooth Data migration and robust Identity validation mitigate risks from Administration errors. Access control security and advanced Cloud security architecture ensure data integrity. APIs facilitate seamless integration, empowering Data governance teams to uphold regulations like those by the Federal Bureau of Investigation (FBI) and international standards. IT service providers cater to diverse Compliance requirements amid varied IT spending in the Services sector. IoT augments connectivity, shaping the future landscape under stringent Internet of Things (IoT) frameworks. Our researchers analyzed the data with 2023 as the base year, along with the key drivers, trends, and challenges. A holistic analysis of drivers will help companies refine their marketing strategies to gain a competitive advantage.

Key Market Driver

The increased adoption of cloud performance management in various industries is notably driving market growth. In 2022, the market for cloud performance management experienced rapid expansion. Some of the factors causing the significant growth of the market include the need to evaluate the business performance data of enterprises, increased adoption by small- and medium-sized enterprises (SMEs), and increased adoption of cloud-based solutions.

Applications for performance management are being used by BFSI companies to efficiently plan, budget, and forecast business strategies. As a result, during the forecast period, the market will grow due to the increasing adoption of cloud performance management by end-users in the BFSI sector. Cloud performance management solutions support network performance, accelerate product development and delivery, and enable automatic performance upgrades. Digitization gives businesses a competitive advantage over their rivals by facilitating better performance and coordinating business strategies with financial plans. This leads to cost reduction, improved customer engagement, and business expansion. Therefore, the growing adoption of cloud performance management among end-users may positively impact the growth of the global market during the forecast period.

Significant Market Trends

The growing demand for cloud solutions is an emerging trend in the market growth. Businesses are rapidly realizing the need for cloud performance management services, as cloud computing and related technologies such as IoT, edge computing, and serverless architecture are gaining popularity. The primary factors influencing the growth of the cloud performance management services market are the expanding user- and infrastructure-centric approaches to controlling IT performance, as well as organizations' interest in tracking IT services for mobile users.

The services are essential for managing and maintaining software and solutions, installing the software in the infrastructure of the company, and training employees. Companies that employ consultants, software experts, and project management teams with a focus on developing and offering critical decision support tools, services, and software make use of these services. Thus, the growing adoption of cloud solutions will boost the growth of the global market during the forecast period.

Major Market Challenge

The high cost associated with implementation is a major challenge impeding market growth. Prices of performance management software also include costs for system design and customization, implementation, training, and maintenance. Businesses must hire IT personnel for the proper software implementation after purchasing the software license.

Organizations should train their staff members on how to use the application effectively. Cloud performance management software needs ongoing updates to stay updated with industry trends once it has been put into place. Hence, all these costs are expected to impede the growth of the global market during the forecast period.

Key Market Customer Landscape

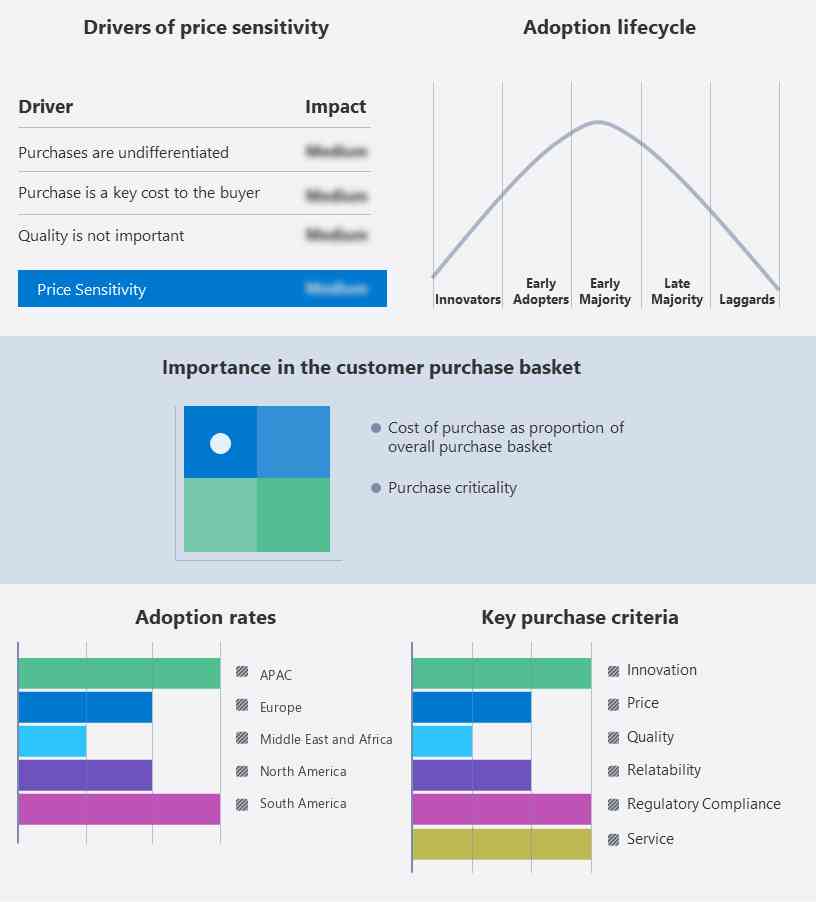
The report includes the adoption lifecycle of the market, covering from the innovator’s stage to the laggard’s stage. It focuses on adoption rates in different regions based on penetration. Furthermore, the report also includes key purchase criteria and drivers of price sensitivity to help companies evaluate and develop their growth strategies.

Cloud Performance Management Market Share by Geography

 Market Customer Landscape

Who are the Major Market Companies?

Companies are implementing various strategies, such as strategic alliances, partnerships, mergers and acquisitions, geographical expansion, and product/service launches, to enhance their presence in the market.

Nastel Technologies Inc. - The company offers infrastructure management delivering middleware, monitoring, tracking, and analytics solutions. The key offerings of the company include cloud performance management services such as IT as a business enabler, enterprise modernization, and agile cloud adoption.

The report also includes detailed analyses of the competitive landscape of the market and information about 15 market companies, including:

  • BMC Software Inc.
  • Broadcom Inc.
  • Cisco Systems Inc.
  • Cognizant Technology Solutions Corp.
  • Datadog Inc.
  • Dynatrace Inc.
  • Hewlett Packard Enterprise Co.
  • International Business Machines Corp.
  • Micro Focus International Plc
  • Microsoft Corp.
  • NetApp Inc.
  • New Relic Inc.
  • Nutanix Inc.
  • Oracle Corp.
  • Riverbed Technology Inc.

Qualitative and quantitative analysis of vendors has been conducted to help clients understand the wider business environment as well as the strengths and weaknesses of key market players. Data is qualitatively analyzed to categorize vendors as pure play, category-focused, industry-focused, and diversified; it is quantitatively analyzed to categorize vendors as dominant, leading, strong, tentative, and weak.

Market Segmentation

By Application

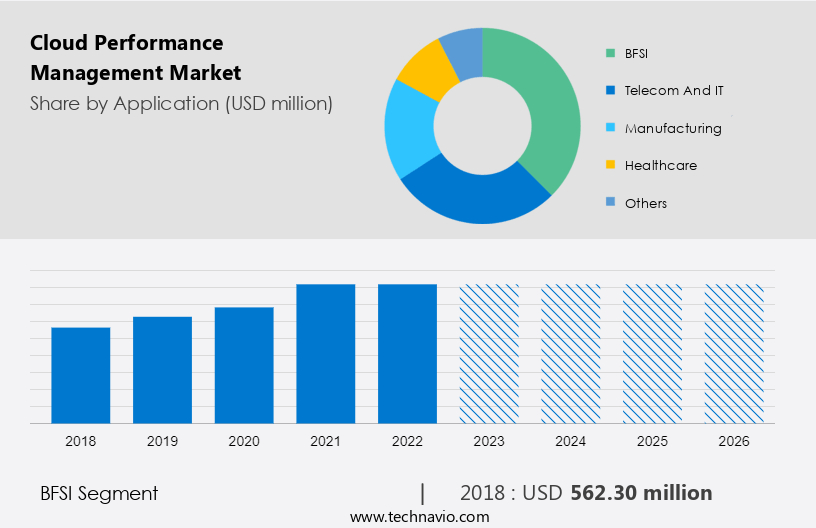
The market share growth by the BFSI segment will be significant during the forecast period. Modern financial services companies place a strong emphasis on providing superior customer experiences, which is fueling segment growth. To ensure the performance of customer-facing systems, end-users need visibility across numerous applications and platforms that are supported by both venerable legacy systems and cutting-edge cloud infrastructure.

Cloud Performance Management Market Size

Get a glance at the market contribution of various segments View the PDF Sample

The BFSI segment was valued at USD 562.30 million in 2018. As potentially millions of customers access banking websites and mobile apps from a variety of devices, financial services companies generate an enormous amount of data about the customer experience. With the aid of cloud performance management tools, BFSI companies can monitor application performance and customer experience for millions of customers globally and instantly drill down to the experience of a single user. It is possible to immediately send detailed information about any customer issues to customer support teams in real time or feed it into ticketing systems. Since cloud performance management directly enhances financial performance, service quality, productivity, and customer satisfaction, its demand is surging in the BFSI sector. Therefore, such factors are expected to boost the growth of the global market in focus during the forecast period.

By Region

Cloud Performance Management Market Share by Geography

For more insights on the market share of various regions Download PDF Sample now!

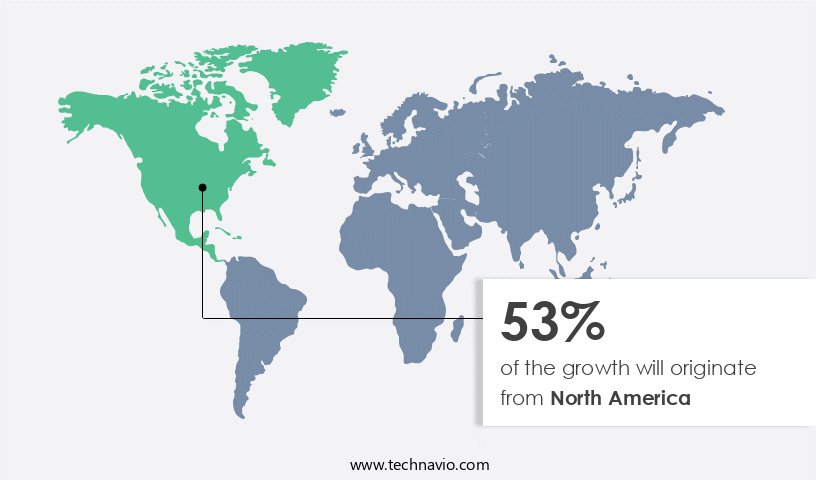
North America is estimated to contribute 53% to the growth of the global market during the forecast period. Technavio’s analysts have elaborately explained the regional trends and drivers that shape the market during the forecast period.

Due to the increasing need for regulatory compliance and the growing acceptance of cloud-based cloud performance management tools, the market in North America is anticipated to expand steadily. In terms of infrastructure development, innovation and development, and research and development activities, the US is one of the key regions. The majority of cloud service providers in the US assist all types of businesses and aid in their rapid expansion. Major cloud providers such as Microsoft, AWS, and IBM have their corporate headquarters in the US, which helps the market in North America grow. These solutions are primarily being used by North American businesses to address problems that are affecting their business models, such as gathering financial documents, managing third-party risks, and data protection. The end-user industries in this region will be the ones driving investments in the adoption of cloud performance management solutions, as they seek to incorporate cutting-edge technologies such as blockchain, AI applications, and data analytics into their current offerings. Hence, all these factors will boost the regional market growth during the forecast period. 

Segment Overview

The market research report provides comprehensive data (region-wise segment analysis), with forecasts and estimates in "USD billion " for the period 2024-2028, as well as historical data from 2018-2022 for the following segments.

  • Application Outlook 
    • BFSI
    • Telecom and IT
    • Manufacturing
    • Healthcare
    • Retail
    • Others
  • Deployment Outlook 
    • Public cloud
    • Private cloud
  • Region Outlook 
    • North America
      • The U.S.
      • Canada
    • Europe
      • U.K.
      • Germany
      • France
      • Rest of Europe
    • APAC
      • China
      • India
    • Middle East & Africa
      • Saudi Arabia
      • South Africa
      • Rest of the Middle East & Africa
    • South America
      • Chile
      • Brazil
      • Argentina

You may also interested in below market reports:

Market Analyst Overview

The market is pivotal in enabling organizations to handle capacity challenges while enhancing conferencing services and integrating virtual reality experiences. It thrives on fostering new partnerships with telecom providers to leverage telco cloud offerings for enhanced cloud-based digital work and remote work solutions. The market supports the seamless execution of digital events and live meetings through robust streaming services and operational support systems. Addressing threats like compromise and minimizing losses and consumer dissatisfaction, cloud performance platforms offer critical cloud monitoring capabilities, identifying potential threats and vulnerabilities such as data breaches. With encryption methods and stringent data security protocols managed by cybersecurity professionals, organizations ensure cloud system management solutions uphold reliability, scalability, and flexibility for improved productivity and affordability in a secure, compliant hybrid cloud environment.

Market Scope

Report Coverage

Details

Page number

180

Base year

2023

Historic period

2018 - 2022

Forecast period

2024-2028

Growth momentum & CAGR

Accelerate at a CAGR of 15.2%

Market growth 2024-2028

USD 3.70 billion

Market structure

Fragmented

YoY growth 2023-2024(%)

12.86

Regional analysis

North America, Europe, APAC, South America, and Middle East and Africa

Performing market contribution

North America at 53%

Key countries

US, Canada, UK, Germany, and Japan

Competitive landscape

Leading Companies, Market Positioning of Companies, Competitive Strategies, and Industry Risks

Key companies profiled

BMC Software Inc., Broadcom Inc., Cisco Systems Inc., Cognizant Technology Solutions Corp., Datadog Inc., Dynatrace Inc., Hewlett Packard Enterprise Co., International Business Machines Corp., Lumen Technologies Inc., Open Text Corporation, Microsoft Corp., Nastel Technologies Inc., NetApp Inc., New Relic Inc., Nutanix Inc., Oracle Corp., Riverbed Technology Inc., SAP SE, Splunk Inc., and VMware Inc.

Market dynamics

Parent market analysis, Market Forecasting, Market growth inducers and obstacles, Fast-growing and slow-growing segment analysis, Market growth and Forecasting, COVID 19 impact and recovery analysis and future consumer dynamics, Market condition analysis for market forecast period

Customization purview

If our report has not included the data that you are looking for, you can reach out to our analysts and get segments customized.

View the PDF sample

What are the Key Data Covered in this Market Report?

  • CAGR of the market during the forecast period
  • Detailed information on factors that will drive the market growth and forecasting of the market between 2024 and 2028
  • Precise estimation of the size of the market size and its contribution to the parent market
  • Accurate predictions about upcoming market trends and analysis and changes in consumer behavior
  • Growth of the market industry across Europe, North America, APAC, South America, and Middle East and Africa
  • Thorough market growth analysis of the market’s competitive landscape and detailed information about companies
  • Comprehensive market analysis and report on the factors that will challenge the market research and growth of market companies

We can help! Our analysts can customize this market research report to meet your requirements. Get in touch

1 Executive Summary

  • 1.1 Market overview
    • Executive Summary - Chart on Market Overview
    • Executive Summary - Data Table on Market Overview
    • Executive Summary - Chart on Global Market Characteristics
    • Executive Summary - Chart on Market by Geography
    • Executive Summary - Chart on Market Segmentation by Application
    • Executive Summary - Chart on Market Segmentation by Deployment
    • Executive Summary - Chart on Incremental Growth
    • Executive Summary - Data Table on Incremental Growth
    • Executive Summary - Chart on Company Market Positioning

2 Market Landscape

  • 2.1 Market ecosystem
    • Parent Market
    • Data Table on - Parent Market
  • 2.2 Market characteristics
    • Market characteristics analysis
  • 2.3 Value chain analysis
    • Value Chain Analysis

3 Market Sizing

  • 3.1 Market definition
    • Offerings of companies included in the market definition
  • 3.2 Market segment analysis
    • Market segments
  • 3.3 Market size 2023
    • 3.4 Market outlook: Forecast for 2023-2028
      • Chart on Global - Market size and forecast 2023-2028 ($ million)
      • Data Table on Global - Market size and forecast 2023-2028 ($ million)
      • Chart on Global Market: Year-over-year growth 2023-2028 (%)
      • Data Table on Global Market: Year-over-year growth 2023-2028 (%)

    4 Historic Market Size

    • 4.1 Global Cloud Performance Management Market 2018 - 2022
      • Historic Market Size - Data Table on Global Cloud Performance Management Market 2018 - 2022 ($ million)
    • 4.2 Application segment analysis 2018 - 2022
      • Historic Market Size - Application Segment 2018 - 2022 ($ million)
    • 4.3 Deployment segment analysis 2018 - 2022
      • Historic Market Size - Deployment Segment 2018 - 2022 ($ million)
    • 4.4 Geography segment analysis 2018 - 2022
      • Historic Market Size - Geography Segment 2018 - 2022 ($ million)
    • 4.5 Country segment analysis 2018 - 2022
      • Historic Market Size - Country Segment 2018 - 2022 ($ million)

    5 Five Forces Analysis

    • 5.1 Five forces summary
      • Five forces analysis - Comparison between 2023 and 2028
    • 5.2 Bargaining power of buyers
      • Bargaining power of buyers - Impact of key factors 2023 and 2028
    • 5.3 Bargaining power of suppliers
      • Bargaining power of suppliers - Impact of key factors in 2023 and 2028
    • 5.4 Threat of new entrants
      • Threat of new entrants - Impact of key factors in 2023 and 2028
    • 5.5 Threat of substitutes
      • Threat of substitutes - Impact of key factors in 2023 and 2028
    • 5.6 Threat of rivalry
      • Threat of rivalry - Impact of key factors in 2023 and 2028
    • 5.7 Market condition
      • Chart on Market condition - Five forces 2023 and 2028

    6 Market Segmentation by Application

    • 6.1 Market segments
      • Chart on Application - Market share 2023-2028 (%)
      • Data Table on Application - Market share 2023-2028 (%)
    • 6.2 Comparison by Application
      • Chart on Comparison by Application
      • Data Table on Comparison by Application
    • 6.3 BFSI - Market size and forecast 2023-2028
      • Chart on BFSI - Market size and forecast 2023-2028 ($ million)
      • Data Table on BFSI - Market size and forecast 2023-2028 ($ million)
      • Chart on BFSI - Year-over-year growth 2023-2028 (%)
      • Data Table on BFSI - Year-over-year growth 2023-2028 (%)
    • 6.4 Telecom and IT - Market size and forecast 2023-2028
      • Chart on Telecom and IT - Market size and forecast 2023-2028 ($ million)
      • Data Table on Telecom and IT - Market size and forecast 2023-2028 ($ million)
      • Chart on Telecom and IT - Year-over-year growth 2023-2028 (%)
      • Data Table on Telecom and IT - Year-over-year growth 2023-2028 (%)
    • 6.5 Manufacturing - Market size and forecast 2023-2028
      • Chart on Manufacturing - Market size and forecast 2023-2028 ($ million)
      • Data Table on Manufacturing - Market size and forecast 2023-2028 ($ million)
      • Chart on Manufacturing - Year-over-year growth 2023-2028 (%)
      • Data Table on Manufacturing - Year-over-year growth 2023-2028 (%)
    • 6.6 Healthcare - Market size and forecast 2023-2028
      • Chart on Healthcare - Market size and forecast 2023-2028 ($ million)
      • Data Table on Healthcare - Market size and forecast 2023-2028 ($ million)
      • Chart on Healthcare - Year-over-year growth 2023-2028 (%)
      • Data Table on Healthcare - Year-over-year growth 2023-2028 (%)
    • 6.7 Others - Market size and forecast 2023-2028
      • Chart on Others - Market size and forecast 2023-2028 ($ million)
      • Data Table on Others - Market size and forecast 2023-2028 ($ million)
      • Chart on Others - Year-over-year growth 2023-2028 (%)
      • Data Table on Others - Year-over-year growth 2023-2028 (%)
    • 6.8 Market opportunity by Application
      • Market opportunity by Application ($ million)
      • Data Table on Market opportunity by Application ($ million)

    7 Market Segmentation by Deployment

    • 7.1 Market segments
      • Chart on Deployment - Market share 2023-2028 (%)
      • Data Table on Deployment - Market share 2023-2028 (%)
    • 7.2 Comparison by Deployment
      • Chart on Comparison by Deployment
      • Data Table on Comparison by Deployment
    • 7.3 Public cloud - Market size and forecast 2023-2028
      • Chart on Public cloud - Market size and forecast 2023-2028 ($ million)
      • Data Table on Public cloud - Market size and forecast 2023-2028 ($ million)
      • Chart on Public cloud - Year-over-year growth 2023-2028 (%)
      • Data Table on Public cloud - Year-over-year growth 2023-2028 (%)
    • 7.4 Private cloud - Market size and forecast 2023-2028
      • Chart on Private cloud - Market size and forecast 2023-2028 ($ million)
      • Data Table on Private cloud - Market size and forecast 2023-2028 ($ million)
      • Chart on Private cloud - Year-over-year growth 2023-2028 (%)
      • Data Table on Private cloud - Year-over-year growth 2023-2028 (%)
    • 7.5 Market opportunity by Deployment
      • Market opportunity by Deployment ($ million)
      • Data Table on Market opportunity by Deployment ($ million)

    8 Customer Landscape

    • 8.1 Customer landscape overview
      • Analysis of price sensitivity, lifecycle, customer purchase basket, adoption rates, and purchase criteria

    9 Geographic Landscape

    • 9.1 Geographic segmentation
      • Chart on Market share by geography 2023-2028 (%)
      • Data Table on Market share by geography 2023-2028 (%)
    • 9.2 Geographic comparison
      • Chart on Geographic comparison
      • Data Table on Geographic comparison
    • 9.3 North America - Market size and forecast 2023-2028
      • Chart on North America - Market size and forecast 2023-2028 ($ million)
      • Data Table on North America - Market size and forecast 2023-2028 ($ million)
      • Chart on North America - Year-over-year growth 2023-2028 (%)
      • Data Table on North America - Year-over-year growth 2023-2028 (%)
    • 9.4 Europe - Market size and forecast 2023-2028
      • Chart on Europe - Market size and forecast 2023-2028 ($ million)
      • Data Table on Europe - Market size and forecast 2023-2028 ($ million)
      • Chart on Europe - Year-over-year growth 2023-2028 (%)
      • Data Table on Europe - Year-over-year growth 2023-2028 (%)
    • 9.5 APAC - Market size and forecast 2023-2028
      • Chart on APAC - Market size and forecast 2023-2028 ($ million)
      • Data Table on APAC - Market size and forecast 2023-2028 ($ million)
      • Chart on APAC - Year-over-year growth 2023-2028 (%)
      • Data Table on APAC - Year-over-year growth 2023-2028 (%)
    • 9.6 South America - Market size and forecast 2023-2028
      • Chart on South America - Market size and forecast 2023-2028 ($ million)
      • Data Table on South America - Market size and forecast 2023-2028 ($ million)
      • Chart on South America - Year-over-year growth 2023-2028 (%)
      • Data Table on South America - Year-over-year growth 2023-2028 (%)
    • 9.7 Middle East and Africa - Market size and forecast 2023-2028
      • Chart on Middle East and Africa - Market size and forecast 2023-2028 ($ million)
      • Data Table on Middle East and Africa - Market size and forecast 2023-2028 ($ million)
      • Chart on Middle East and Africa - Year-over-year growth 2023-2028 (%)
      • Data Table on Middle East and Africa - Year-over-year growth 2023-2028 (%)
    • 9.8 US - Market size and forecast 2023-2028
      • Chart on US - Market size and forecast 2023-2028 ($ million)
      • Data Table on US - Market size and forecast 2023-2028 ($ million)
      • Chart on US - Year-over-year growth 2023-2028 (%)
      • Data Table on US - Year-over-year growth 2023-2028 (%)
    • 9.9 Canada - Market size and forecast 2023-2028
      • Chart on Canada - Market size and forecast 2023-2028 ($ million)
      • Data Table on Canada - Market size and forecast 2023-2028 ($ million)
      • Chart on Canada - Year-over-year growth 2023-2028 (%)
      • Data Table on Canada - Year-over-year growth 2023-2028 (%)
    • 9.10 UK - Market size and forecast 2023-2028
      • Chart on UK - Market size and forecast 2023-2028 ($ million)
      • Data Table on UK - Market size and forecast 2023-2028 ($ million)
      • Chart on UK - Year-over-year growth 2023-2028 (%)
      • Data Table on UK - Year-over-year growth 2023-2028 (%)
    • 9.11 Germany - Market size and forecast 2023-2028
      • Chart on Germany - Market size and forecast 2023-2028 ($ million)
      • Data Table on Germany - Market size and forecast 2023-2028 ($ million)
      • Chart on Germany - Year-over-year growth 2023-2028 (%)
      • Data Table on Germany - Year-over-year growth 2023-2028 (%)
    • 9.12 Japan - Market size and forecast 2023-2028
      • Chart on Japan - Market size and forecast 2023-2028 ($ million)
      • Data Table on Japan - Market size and forecast 2023-2028 ($ million)
      • Chart on Japan - Year-over-year growth 2023-2028 (%)
      • Data Table on Japan - Year-over-year growth 2023-2028 (%)
    • 9.13 Market opportunity by geography
      • Market opportunity by geography ($ million)
      • Data Tables on Market opportunity by geography ($ million)

    10 Drivers, Challenges, and Opportunity/Restraints

    • 10.1 Market drivers
      • 10.2 Market challenges
        • 10.3 Impact of drivers and challenges
          • Impact of drivers and challenges in 2023 and 2028
        • 10.4 Market opportunities/restraints

          11 Competitive Landscape

          • 11.1 Overview
            • 11.2 Competitive Landscape
              • Overview on criticality of inputs and factors of differentiation
            • 11.3 Landscape disruption
              • Overview on factors of disruption
            • 11.4 Industry risks
              • Impact of key risks on business

            12 Competitive Analysis

            • 12.1 Companies profiled
              • Companies covered
            • 12.2 Market positioning of companies
              • Matrix on companies position and classification
            • 12.3 BMC Software Inc.
              • BMC Software Inc. - Overview
              • BMC Software Inc. - Product / Service
              • BMC Software Inc. - Key news
              • BMC Software Inc. - Key offerings
            • 12.4 Broadcom Inc.
              • Broadcom Inc. - Overview
              • Broadcom Inc. - Business segments
              • Broadcom Inc. - Key news
              • Broadcom Inc. - Key offerings
              • Broadcom Inc. - Segment focus
            • 12.5 Cisco Systems Inc.
              • Cisco Systems Inc. - Overview
              • Cisco Systems Inc. - Business segments
              • Cisco Systems Inc. - Key news
              • Cisco Systems Inc. - Key offerings
              • Cisco Systems Inc. - Segment focus
            • 12.6 Cognizant Technology Solutions Corp.
              • Cognizant Technology Solutions Corp. - Overview
              • Cognizant Technology Solutions Corp. - Business segments
              • Cognizant Technology Solutions Corp. - Key news
              • Cognizant Technology Solutions Corp. - Key offerings
              • Cognizant Technology Solutions Corp. - Segment focus
            • 12.7 Dynatrace Inc.
              • Dynatrace Inc. - Overview
              • Dynatrace Inc. - Product / Service
              • Dynatrace Inc. - Key news
              • Dynatrace Inc. - Key offerings
            • 12.8 Hewlett Packard Enterprise Co.
              • Hewlett Packard Enterprise Co. - Overview
              • Hewlett Packard Enterprise Co. - Business segments
              • Hewlett Packard Enterprise Co. - Key news
              • Hewlett Packard Enterprise Co. - Key offerings
              • Hewlett Packard Enterprise Co. - Segment focus
            • 12.9 International Business Machines Corp.
              • International Business Machines Corp. - Overview
              • International Business Machines Corp. - Business segments
              • International Business Machines Corp. - Key news
              • International Business Machines Corp. - Key offerings
              • International Business Machines Corp. - Segment focus
            • 12.10 Lumen Technologies Inc.
              • Lumen Technologies Inc. - Overview
              • Lumen Technologies Inc. - Business segments
              • Lumen Technologies Inc. - Key news
              • Lumen Technologies Inc. - Key offerings
              • Lumen Technologies Inc. - Segment focus
            • 12.11 Open Text Corporation
              • Open Text Corporation - Overview
              • Open Text Corporation - Business segments
              • Open Text Corporation - Key news
              • Open Text Corporation - Key offerings
              • Open Text Corporation - Segment focus
            • 12.12 Microsoft Corp.
              • Microsoft Corp. - Overview
              • Microsoft Corp. - Business segments
              • Microsoft Corp. - Key news
              • Microsoft Corp. - Key offerings
              • Microsoft Corp. - Segment focus
            • 12.13 Nastel Technologies Inc.
              • Nastel Technologies Inc. - Overview
              • Nastel Technologies Inc. - Product / Service
              • Nastel Technologies Inc. - Key offerings
            • 12.14 New Relic Inc.
              • New Relic Inc. - Overview
              • New Relic Inc. - Product / Service
              • New Relic Inc. - Key offerings
            • 12.15 Oracle Corp.
              • Oracle Corp. - Overview
              • Oracle Corp. - Business segments
              • Oracle Corp. - Key news
              • Oracle Corp. - Key offerings
              • Oracle Corp. - Segment focus
            • 12.16 SAP SE
              • SAP SE - Overview
              • SAP SE - Business segments
              • SAP SE - Key news
              • SAP SE - Key offerings
              • SAP SE - Segment focus
            • 12.17 VMware Inc.
              • VMware Inc. - Overview
              • VMware Inc. - Product / Service
              • VMware Inc. - Key news
              • VMware Inc. - Key offerings

            13 Appendix

            • 13.1 Scope of the report
              • 13.2 Inclusions and exclusions checklist
                • Inclusions checklist
                • Exclusions checklist
              • 13.3 Currency conversion rates for US$
                • Currency conversion rates for US$
              • 13.4 Research methodology
                • Research methodology
              • 13.5 Data procurement
                • Information sources
              • 13.6 Data validation
                • Data validation
              • 13.7 Validation techniques employed for market sizing
                • Validation techniques employed for market sizing
              • 13.8 Data synthesis
                • Data synthesis
              • 13.9 360 degree market analysis
                • 360 degree market analysis
              • 13.10 List of abbreviations
                • List of abbreviations

              Research Methodology

              Technavio presents a detailed picture of the market by way of study, synthesis, and summation of data from multiple sources. The analysts have presented the various facets of the market with a particular focus on identifying the key industry influencers. The data thus presented is comprehensive, reliable, and the result of extensive research, both primary and secondary.

              INFORMATION SOURCES

              Primary sources

              • Manufacturers and suppliers
              • Channel partners
              • Industry experts
              • Strategic decision makers

              Secondary sources

              • Industry journals and periodicals
              • Government data
              • Financial reports of key industry players
              • Historical data
              • Press releases

              DATA ANALYSIS

              Data Synthesis

              • Collation of data
              • Estimation of key figures
              • Analysis of derived insights

              Data Validation

              • Triangulation with data models
              • Reference against proprietary databases
              • Corroboration with industry experts

              REPORT WRITING

              Qualitative

              • Market drivers
              • Market challenges
              • Market trends
              • Five forces analysis

              Quantitative

              • Market size and forecast
              • Market segmentation
              • Geographical insights
              • Competitive landscape

              Interested in this report?

              Get your sample now to see our research methodology and insights!

              Download Now

              Frequently Asked Questions

              Cloud Performance Management market growth will increase by $ 3708.9 mn during 2024-2028 .

              The Cloud Performance Management market is expected to grow at a CAGR of 15.2% during 2024-2028 .

              Cloud Performance Management market is segmented by Application( BFSI, Telecom and IT, Manufacturing, Healthcare, Others) Deployment( Public cloud, Private cloud)

              BMC Software Inc., Broadcom Inc., Cisco Systems Inc., Cognizant Technology Solutions Corp., Datadog Inc., Dynatrace Inc., Hewlett Packard Enterprise Co., International Business Machines Corp., Lumen Technologies Inc., Open Text Corporation, Microsoft Corp., Nastel Technologies Inc., NetApp Inc., New Relic Inc., Nutanix Inc., Oracle Corp., Riverbed Technology Inc., SAP SE, Splunk Inc., VMware Inc. are a few of the key vendors in the Cloud Performance Management market.

              North America will register the highest growth rate of 53% among the other regions. Therefore, the Cloud Performance Management market in North America is expected to garner significant business opportunities for the vendors during the forecast period.

              US, Canada, UK, Germany, Japan

              • Increased adoption of cloud performance management in various industriesThe global cloud performance management market registered rapid growth in 2022. The need to evaluate the business performance data of enterprises is the driving factor this market.
              • increased adoption by small- and medium-sized enterprises (SMEs) is the driving factor this market.
              • and the increasing adoption of cloud-based solutions are some of the factors responsible for the significant growth of the market. BFSI companies are using performance management applications to effectively plan is the driving factor this market.
              • budget is the driving factor this market.
              • and forecast business strategies. Thus is the driving factor this market.
              • the growing adoption of cloud performance management by BFSI end-users will drive the growth of the market during the forecast period. The adoption of cloud performance management applications enables healthcare service providers to gain a competitive advantage over others by improving their decision-making processes. The cloud performance management market supports network performance is the driving factor this market.
              • accelerates product development and delivery is the driving factor this market.
              • and enables automatic performance upgrades. By enabling better performance and aligning business strategies with financial plans is the driving factor this market.
              • digitalization gives businesses a competitive edge over their rivals. This results in cost optimization is the driving factor this market.
              • enhanced global reach and customer interaction is the driving factor this market.
              • and enterprise growth. Therefore is the driving factor this market.
              • the growing adoption of cloud performance management among end-users may positively impact the growth of the global market in focus during the forecast period. is the driving factor this market.

              The Cloud Performance Management market vendors should focus on grabbing business opportunities from the BFSI segment as it accounted for the largest market share in the base year.