Application Performance Management Market Analysis, Size, and Forecast 2024-2028: North America (US and Canada), Europe (France, Germany, Italy, and UK), Middle East and Africa (Egypt, KSA, Oman, and UAE), APAC (China, India, and Japan), South America (Argentina and Brazil), and Rest of World (ROW)

Application Performance Management Market Analysis, Size, and Forecast 2024-2028:
North America (US and Canada), Europe (France, Germany, Italy, and UK), Middle East and Africa (Egypt, KSA, Oman, and UAE), APAC (China, India, and Japan), South America (Argentina and Brazil), and Rest of World (ROW)

Published: May 2024 165 Pages SKU: IRTNTR77346

Market Overview at a Glance

$26.00 B
Market Opportunity
30.07%
CAGR
29.6
YoY growth 2023-2024(%)

Application Performance Management Market Size 2024-2028

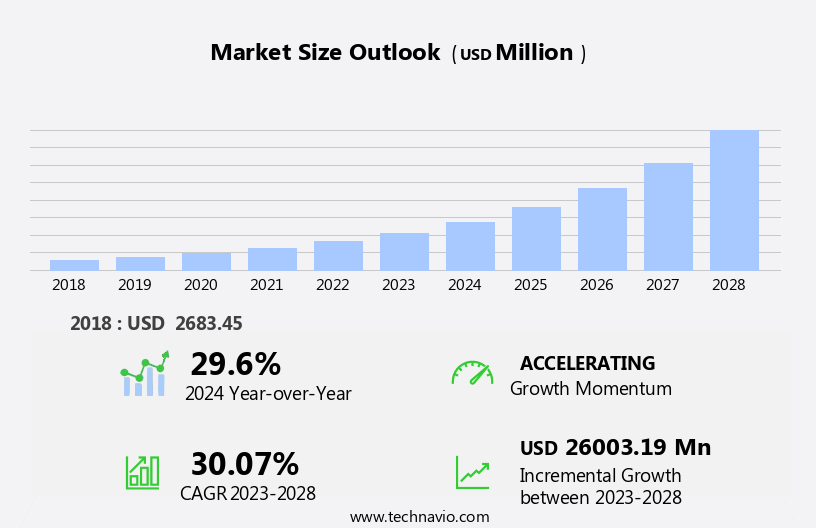
The application performance management market size is forecast to increase by USD 26 billion, at a CAGR of 30.07% between 2023 and 2028.

  • The market is experiencing significant growth, driven by the increasing adoption of digital technologies such as mobile applications and microservices architecture. This shift towards more complex IT environments necessitates advanced tools and techniques for monitoring and managing application performance. Automated anomaly detection and root cause analysis are becoming essential capabilities for businesses to ensure optimal application performance and minimize downtime. However, the market also faces challenges. The complexity of application architecture and dependency mapping presents a significant obstacle, requiring sophisticated solutions that can effectively identify and address performance issues across multiple layers and components.
  • Additionally, the growing use of cloud-based applications and infrastructure adds another layer of complexity, necessitating solutions that can seamlessly integrate with these environments. To capitalize on market opportunities and navigate challenges effectively, companies must invest in innovative Application Performance Management solutions that can deliver real-time insights, automated remediation, and seamless integration with modern IT architectures.

What will be the Size of the Application Performance Management Market during the forecast period?

Application Performance Management Market Size

Explore in-depth regional segment analysis with market size data - historical 2018-2022 and forecasts 2024-2028 - in the full report.  
Request Free Sample

The application performance management (APM) market continues to evolve, driven by the increasing complexity of digital environments and the need for seamless user experiences. APM solutions encompass various components, including incident management, predictive analytics, end-to-end monitoring, microservices monitoring, log management, and more. Error rates, Synthetic Monitoring, APM tools, database monitoring, context propagation, service level agreements (SLAs), network monitoring, user experience monitoring, mobile application monitoring, service level objectives (SLOs), cloud monitoring, automated remediation, website monitoring, digital experience monitoring, anomaly detection, capacity planning, and AI-powered APM are integral parts of this dynamic landscape. APM tools enable organizations to monitor and optimize the performance of applications, databases, and networks.

They help identify and resolve issues before they impact users, ensuring SLAs are met. Synthetic monitoring and real user monitoring provide valuable insights into application performance from both perspectives. Microservices monitoring, log management, and API monitoring are essential for managing modern applications, while infrastructure monitoring and code profiling aid in performance optimization. Predictive analytics and anomaly detection enable proactive issue resolution, and distributed tracing and transaction traces provide context for root cause analysis. The continuous unfolding of market activities and evolving patterns in the APM market reflect the ongoing need for organizations to adapt and innovate to meet the ever-changing demands of digital business.

How is this Application Performance Management Industry segmented?

The application performance management industry research report provides comprehensive data (region-wise segment analysis), with forecasts and estimates in "USD million" for the period 2024-2028, as well as historical data from 2018-2022 for the following segments.

  • End-user
    • Large enterprises
    • SMEs
  • Type
    • Software
    • Services
  • Deployment
    • Cloud-based
    • On-premises
    • Hybrid
  • Application
    • BFSI
    • IT & Telecom
    • Healthcare
    • Retail & e-commerce
    • Manufacturing
    • Government
    • Media & Entertainment
    • Logistics
  • Geography
    • North America
      • US
      • Canada
    • Europe
      • France
      • Germany
      • Italy
      • UK
    • Middle East and Africa
      • Egypt
      • KSA
      • Oman
      • UAE
    • APAC
      • China
      • India
      • Japan
    • South America
      • Argentina
      • Brazil
    • Rest of World (ROW)

By End-user Insights

The large enterprises segment is estimated to witness significant growth during the forecast period.

In today's digital landscape, large enterprises face the challenge of managing and optimizing the performance of their intricate IT systems and applications. Application Performance Management (APM) solutions have emerged as a crucial tool to ensure the smooth functioning of these complex infrastructures. 

Large enterprises, characterized by their extensive IT infrastructure and a multitude of critical applications, require robust APM solutions to mitigate potential performance issues and ensure uninterrupted operations. These organizations deal with vast amounts of data, complex interconnected applications, and a large user base. Performance degradation or downtime can significantly impact their customers, revenue generation, and brand reputation. Predictive analytics and real-time monitoring enable proactive identification and resolution of issues, while AI-powered APM solutions optimize performance and ensure compliance with service level agreements (SLAs). APM tools also facilitate root cause analysis, distributed tracing, and transaction traces to identify and address the underlying causes of performance issues.

APM solutions are integral to the software development lifecycle, with continuous integration and delivery (CI/CD) enabling seamless deployment and monitoring of applications. Microservices monitoring ensures the performance and availability of individual services, while container monitoring optimizes container performance and resource utilization. Database monitoring provides insights into database performance and identifies potential bottlenecks, while infrastructure monitoring offers visibility into the underlying infrastructure and its impact on application performance. APM solutions are not limited to traditional applications but extend to mobile applications, websites, and digital experiences. Cloud monitoring ensures the performance and availability of cloud-based applications, while user experience monitoring provides insights into user behavior and preferences.

Application Performance Management Market Size

Request Free Sample

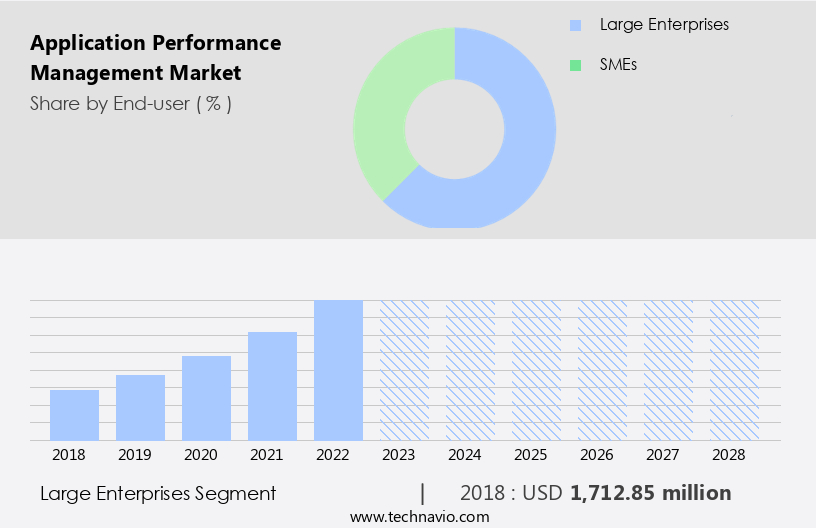
The Large enterprises segment was valued at USD 1.71 billion in 2018 and showed a gradual increase during the forecast period.

Regional Analysis

North America is estimated to contribute 32% to the growth of the global market during the forecast period.Technavio's analysts have elaborately explained the regional trends and drivers that shape the market during the forecast period.

Application Performance Management Market Share by Geography

 Request Free Sample

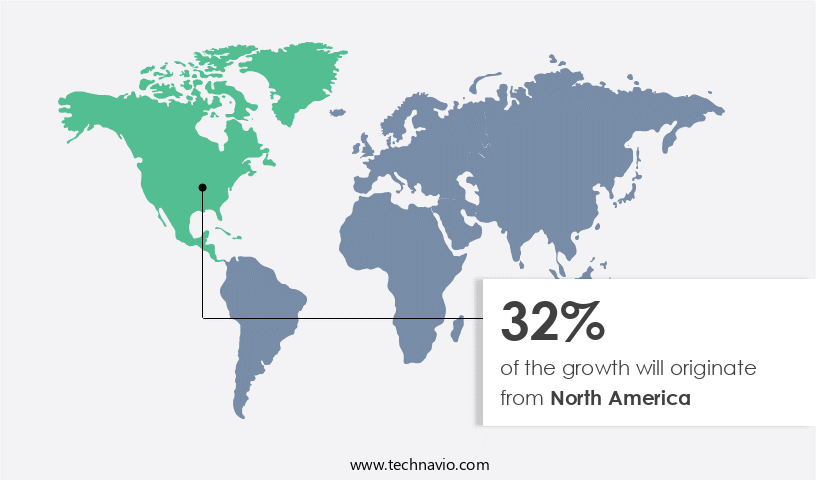
The Application Performance Management (APM) market in North America is experiencing notable growth due to the increasing importance of digital services and applications for businesses. APM encompasses the monitoring and management of software applications' performance, availability, and user experience. With a strong focus on technological innovation, North America is a leading region in this field, driven by both established enterprises and a vibrant startup ecosystem. Factors such as the demand for superior user experiences, the growing complexity of applications, and the prevalence of cloud-based solutions are fueling market expansion. Key aspects of APM include incident management, predictive analytics, end-to-end monitoring, application performance monitoring, microservices monitoring, log management, continuous integration and delivery (CI/CD), real user monitoring, container monitoring, error tracking, error rates, synthetic monitoring, and various APM tools.

These elements are essential for maintaining optimal application performance, ensuring service level agreements (SLAs), and providing an excellent digital experience. Moreover, the market is witnessing the emergence of advanced technologies like AI-powered APM, capacity planning, and anomaly detection. These innovations enable businesses to proactively address performance issues, optimize infrastructure, and enhance overall application efficiency. The software development lifecycle (SDLC) and infrastructure monitoring are also critical components, allowing for performance degradation identification and code profiling. In summary, the North American market is undergoing significant growth as businesses prioritize digital services and applications. Key factors driving this expansion include the need for enhanced user experiences, the increasing complexity of applications, and the rise of cloud-based solutions.

The market's evolution is marked by the adoption of advanced technologies and the integration of various APM elements, ensuring the optimal performance, availability, and user experience of software applications.

Market Dynamics

Our researchers analyzed the data with 2023 as the base year, along with the key drivers, trends, and challenges. A holistic analysis of drivers will help companies refine their marketing strategies to gain a competitive advantage.

The global APM market is experiencing significant expansion, driven by evolving APM market trends and the critical need for seamless digital experiences. The substantial APM market size reflects robust APM market growth, fueled by the demand for comprehensive application monitoring solutions. Real user monitoring (RUM) provides crucial insights into user experience, while AI in APM and distributed tracing capabilities are transforming how organizations identify and resolve issues.

The adoption of cloud APM solutions is widespread, enabling efficient microservices monitoring. This focus on end-user experience management is paramount for businesses. Major growth is seen in the North America APM market and Asia-Pacific APM market. Effective application troubleshooting is enhanced by DevOps integration APM and advanced IT operations management APM. Furthermore, synthetic monitoring plays a key role in proactively minimizing reduced application downtime, solidifying the position of leading APM vendors in this dynamic landscape.

What are the key market drivers leading to the rise in the adoption of Application Performance Management Industry?

  • The surge in the implementation of digital technologies, including mobile applications and microservices architecture, serves as the primary catalyst for market growth. 
  • The Application Performance Management (APM) market has experienced notable growth due to the increasing number of businesses adopting digital technologies to streamline their operations and deliver superior user experiences. The proliferation of mobile applications and the adoption of microservices architectures have made APM a crucial element for businesses to ensure optimal application performance and maintain customer satisfaction. Mobile applications have transformed the way businesses engage with their customers, from e-commerce to banking services. As businesses increasingly rely on these applications, even minor performance issues can negatively impact user experience and brand reputation. To mitigate these risks, businesses are leveraging advanced APM solutions that offer incident management, predictive analytics, end-to-end monitoring, application performance monitoring, microservices monitoring, log management, continuous integration and continuous delivery (CI/CD), real user monitoring, and container monitoring.
  • These solutions enable businesses to identify and address performance issues proactively, ensuring seamless user experiences and maintaining brand loyalty. Additionally, error tracking and root cause analysis help businesses quickly resolve issues and minimize downtime. APM solutions have become indispensable for businesses in various industries, as they enable organizations to maintain high levels of application performance and reliability. By leveraging these solutions, businesses can enhance their digital transformation initiatives, improve customer satisfaction, and gain a competitive edge in their respective markets.

What are the market trends shaping the Application Performance Management Industry?

  • The emerging market trend involves the implementation of automated anomaly detection and root cause analysis systems. These advanced solutions enable efficient identification and resolution of issues.
  • The Application Performance Management (APM) market has witnessed significant growth due to the increasing adoption of advanced technologies such as Artificial Intelligence (AI) and Machine Learning (ML) for automated error detection and root cause analysis. These technologies enable organizations to improve application performance, minimize downtime, and enhance user experience by analyzing vast amounts of data in real time. For instance, an unexpected surge in response time for an e-commerce website can lead to user frustration and revenue loss. APM tools employing AI and ML algorithms can identify such anomalies and provide insights into their root causes, ensuring applications run smoothly and efficiently.
  • Database monitoring, network monitoring, user experience monitoring, mobile application monitoring, service level agreements, and service level objectives are essential components of APM. Context propagation, a crucial feature of APM tools, facilitates the correlation of data across different layers of the IT infrastructure, providing a holistic view of application performance. In conclusion, the integration of AI and ML in APM solutions has become indispensable for organizations seeking to maintain optimal application performance and deliver exceptional user experiences.

What challenges does the Application Performance Management Industry face during its growth?

  • The intricacy of application architecture and dependency mapping poses a significant challenge to industry growth, necessitating the expertise of professionals to effectively manage complex systems and optimize interdependencies. 
  • In the dynamic landscape of application performance management (APM), organizations face the challenge of managing the intricacy of modern application architectures. With applications increasingly built using microservices, containers, serverless computing, and other advanced technologies, identifying performance bottlenecks and maintaining optimal digital experiences becomes a complex task. Each application component may have unique dependencies and interactions with other components, making it essential to gain a comprehensive understanding of the entire system behavior. Cloud monitoring, an integral part of APM, enables organizations to track application performance in real-time, ensuring seamless user experiences. Automated remediation, another crucial aspect, helps in addressing performance issues proactively, minimizing downtime and improving overall efficiency.
  • Website monitoring and digital experience monitoring are vital components of APM, ensuring applications meet user expectations and deliver optimal performance. Anomaly detection, a key feature, utilizes AI-powered algorithms to identify deviations from normal performance patterns, allowing for swift resolution. Capacity planning and performance optimization are essential in the software development lifecycle to ensure applications can handle increased traffic and demand. API monitoring is another critical aspect, as APIs serve as the backbone for modern applications, and their performance directly impacts the end-user experience. In conclusion, The market is driven by the need to manage the complexity of modern application architectures and ensure optimal digital experiences.
  • Cloud monitoring, automated remediation, website monitoring, digital experience monitoring, anomaly detection, capacity planning, performance optimization, software development lifecycle, and API monitoring are essential components of APM, helping organizations maintain high-performing applications in today's dynamic business environment.

Exclusive Customer Landscape

The application performance management market forecasting report includes the adoption lifecycle of the market, covering from the innovator's stage to the laggard's stage. It focuses on adoption rates in different regions based on penetration. Furthermore, the application performance management market report also includes key purchase criteria and drivers of price sensitivity to help companies evaluate and develop their market growth analysis strategies.
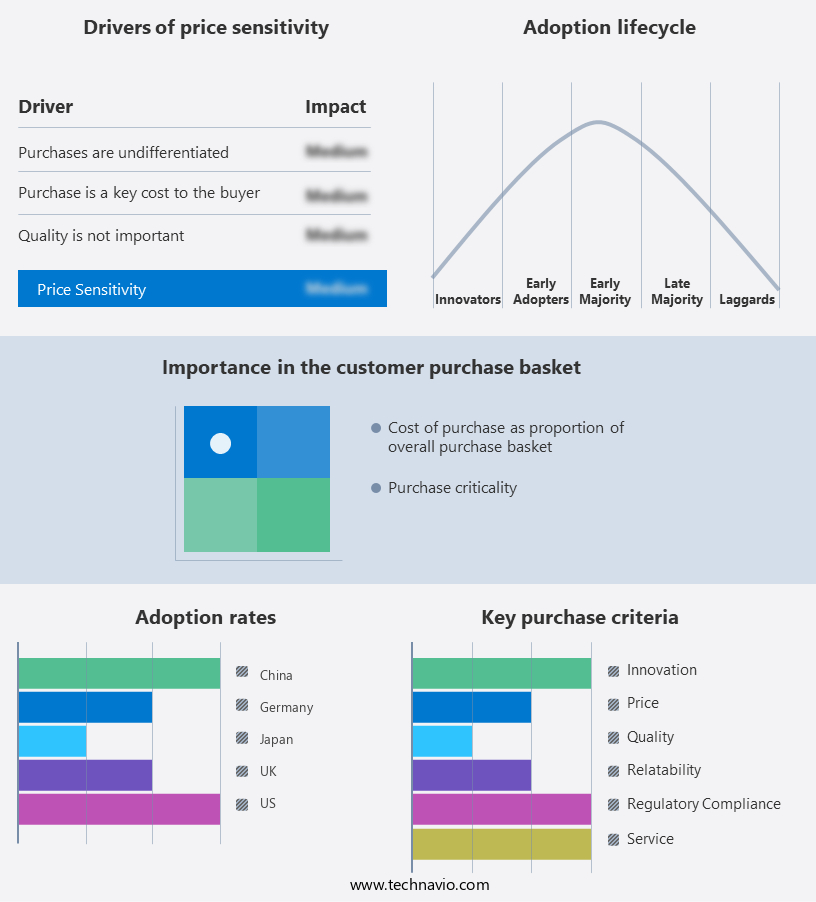
Application Performance Management Market Share by Geography

 Customer Landscape

Key Companies & Market Insights

Companies are implementing various strategies, such as strategic alliances, application performance management market forecast, partnerships, mergers and acquisitions, geographical expansion, and product/service launches, to enhance their presence in the industry.

AppDynamics (Cisco) - The company specializes in providing advanced programmable logic controllers, including the AC500 eCo, AC500, AC500 XC, and AC500 S models. These controllers offer versatile functionality and customization, enhancing industrial automation processes. The AC500 series controllers are renowned for their high-performance capabilities and open architecture, enabling seamless integration with various devices and systems. 

The industry research and growth report includes detailed analyses of the competitive landscape of the market and information about key companies, including:

  • AppDynamics (Cisco)
  • Broadcom (CA Technologies)
  • BMC Software
  • Datadog
  • Dell EMC
  • Dynatrace
  • Elastic
  • ExtraHop Networks
  • Hewlett Packard Enterprise (HPE)
  • IBM
  • ManageEngine (Zoho Corporation)
  • Microsoft
  • New Relic
  • Oracle
  • Riverbed Technology
  • SAP
  • SolarWinds
  • Splunk
  • Stackify Retrace
  • VMware

Qualitative and quantitative analysis of companies has been conducted to help clients understand the wider business environment as well as the strengths and weaknesses of key industry players. Data is qualitatively analyzed to categorize companies as pure play, category-focused, industry-focused, and diversified; it is quantitatively analyzed to categorize companies as dominant, leading, strong, tentative, and weak.

Recent Development and News in Application Performance Management Market

  • In January 2024, Dynatrace, a leading Application Performance Management (APM) solutions provider, announced the launch of its new AI-powered Observability Platform, "Dynatrace Davis 13," which uses machine learning and artificial intelligence to detect and resolve application performance issues in real-time (Dynatrace Press Release).
  • In March 2024, IBM and Red Hat, an IBM company, entered into a strategic partnership to integrate IBM's APM solution, AppDynamics, with Red Hat's OpenShift container Application Platform. This collaboration aimed to help organizations manage and monitor containerized applications more effectively (IBM Press Release).
  • In May 2024, SolarWinds, a leading provider of IT management software, completed its acquisition of Pingdom, a Swedish company specializing in website and application performance monitoring. The acquisition expanded SolarWinds' offerings in the APM market and strengthened its presence in Europe (SolarWinds Press Release).
  • In April 2025, AppDynamics, an IBM company, secured a significant investment of USD 200 million from Goldman Sachs, further bolstering its financial position and enabling it to accelerate its product development and market expansion plans (Bloomberg News).

Research Analyst Overview

  • In the dynamic Application Performance Management (APM) market, cloud cost optimization and serverless architecture are driving innovation. Cloud providers offer tools to optimize costs, while serverless architecture enables businesses to pay only for the compute time they consume. Security monitoring remains a top priority, with data governance and Data Security integral to IT service management. Change management and proactive monitoring ensure smooth deployments and prevent incidents. Cloud native technologies, such as container orchestration and infrastructure as code, facilitate agile IT operations.
  • Proactive measures like stress testing, incident response, and problem management minimize downtime and improve performance. Automated testing, data visualization, and data analytics enable continuous improvement and faster time-to-market. Reactive monitoring and chaos engineering further enhance resilience and ensure optimal system behavior. IT operations encompass all these aspects, making APM an essential component for US businesses seeking to maintain competitive edge.

Dive into Technavio's robust research methodology, blending expert interviews, extensive data synthesis, and validated models for unparalleled Application Performance Management Market insights. See full methodology.

Market Scope

Report Coverage

Details

Page number

165

Base year

2023

Historic period

2018-2022

Forecast period

2024-2028

Growth momentum & CAGR

Accelerate at a CAGR of 30.07%

Market growth 2024-2028

USD 26003.19 million

Market structure

Fragmented

YoY growth 2023-2024(%)

29.6

Key countries

US, Canada, Germany, UK, Italy, France, China, India, Japan, Brazil, Egypt, UAE, Oman, Argentina, KSA, UAE, Brazil, and Rest of World (ROW)

Competitive landscape

Leading Companies, Market Positioning of Companies, Competitive Strategies, and Industry Risks

Request Free Sample

What are the Key Data Covered in this Application Performance Management Market Research and Growth Report?

  • CAGR of the Application Performance Management industry during the forecast period
  • Detailed information on factors that will drive the growth and forecasting between 2024 and 2028
  • Precise estimation of the size of the market and its contribution of the industry in focus to the parent market
  • Accurate predictions about upcoming growth and trends and changes in consumer behaviour
  • Growth of the market across North America, Europe, APAC, South America, and Middle East and Africa
  • Thorough analysis of the market's competitive landscape and detailed information about companies
  • Comprehensive analysis of factors that will challenge the application performance management market growth of industry companies

We can help! Our analysts can customize this application performance management market research report to meet your requirements.

Get in touch

1 Executive Summary

  • 1.1 Market overview
    • Exhibit 01: Executive Summary – Chart on Market Overview
    • Exhibit 02: Executive Summary – Data Table on Market Overview
    • Exhibit 03: Executive Summary – Chart on Global Market Characteristics
    • Exhibit 04: Executive Summary – Chart on Market by Geography
    • Exhibit 05: Executive Summary – Chart on Market Segmentation by End-user
    • Exhibit 06: Executive Summary – Chart on Market Segmentation by Type
    • Exhibit 07: Executive Summary – Chart on Incremental Growth
    • Exhibit 08: Executive Summary – Data Table on Incremental Growth
    • Exhibit 09: Executive Summary – Chart on Vendor Market Positioning

2 Market Landscape

  • 2.1 Market ecosystem
    • Exhibit 10: Parent market
    • Exhibit 11: Market Characteristics

3 Market Sizing

  • 3.1 Market definition
    • Exhibit 12: Offerings of vendors included in the market definition
  • 3.2 Market segment analysis
    • Exhibit 13: Market segments
  • 3.3 Market size 2023
    • 3.4 Market outlook: Forecast for 2023-2028
      • Exhibit 14: Chart on Global - Market size and forecast 2023-2028 ($ million)
      • Exhibit 15: Data Table on Global - Market size and forecast 2023-2028 ($ million)
      • Exhibit 16: Chart on Global Market: Year-over-year growth 2023-2028 (%)
      • Exhibit 17: Data Table on Global Market: Year-over-year growth 2023-2028 (%)

    4 Historic Market Size

    • 4.1 Global application performance management market 2018 - 2022
      • Exhibit 18: Historic Market Size – Data Table on global application performance management market 2018 - 2022 ($ million)
    • 4.2 End-user Segment Analysis 2018 - 2022
      • Exhibit 19: Historic Market Size – End-user Segment 2018 - 2022 ($ million)
    • 4.3 Type Segment Analysis 2018 - 2022
      • Exhibit 20: Historic Market Size – Type Segment 2018 - 2022 ($ million)
    • 4.4 Geography Segment Analysis 2018 - 2022
      • Exhibit 21: Historic Market Size – Geography Segment 2018 - 2022 ($ million)
    • 4.5 Country Segment Analysis 2018 - 2022
      • Exhibit 22: Historic Market Size – Country Segment 2018 - 2022 ($ million)

    5 Five Forces Analysis

    • 5.1 Five forces summary
      • Exhibit 23: Five forces analysis - Comparison between 2023 and 2028
    • 5.2 Bargaining power of buyers
      • Exhibit 24: Chart on Bargaining power of buyers – Impact of key factors 2023 and 2028
    • 5.3 Bargaining power of suppliers
      • Exhibit 25: Bargaining power of suppliers – Impact of key factors in 2023 and 2028
    • 5.4 Threat of new entrants
      • Exhibit 26: Threat of new entrants – Impact of key factors in 2023 and 2028
    • 5.5 Threat of substitutes
      • Exhibit 27: Threat of substitutes – Impact of key factors in 2023 and 2028
    • 5.6 Threat of rivalry
      • Exhibit 28: Threat of rivalry – Impact of key factors in 2023 and 2028
    • 5.7 Market condition
      • Exhibit 29: Chart on Market condition - Five forces 2023 and 2028

    6 Market Segmentation by End-user

    • 6.1 Market segments
      • Chart on End-user - Market share (2023-2028) (%)
      • Data Table on End-user - Market share (2023-2028) (%)
    • 6.2 Comparison by End-user
      • Chart on Comparison by End-user
      • Data Table on Comparison by End-user
    • 6.3 Large enterprises - Market size and forecast (2023-2028)
      • Chart on Large enterprises - Market size and forecast (2023-2028) ($ million)
      • Data Table on Large enterprises - Market size and forecast (2023-2028) ($ million)
      • Chart on Large enterprises - Year-over-year growth (2023-2028) (%)
      • Data Table on Large enterprises - Year-over-year growth (2023-2028) (%)
    • 6.4 SMEs - Market size and forecast (2023-2028)
      • Chart on SMEs - Market size and forecast (2023-2028) ($ million)
      • Data Table on SMEs - Market size and forecast (2023-2028) ($ million)
      • Chart on SMEs - Year-over-year growth (2023-2028) (%)
      • Data Table on SMEs - Year-over-year growth (2023-2028) (%)
    • 6.5 Market opportunity by End-user
      • Market opportunity by End-user ($ million)
      • Data Table on Market opportunity by End-user ($ million)

    7 Market Segmentation by Type

    • 7.1 Market segments
      • Chart on Type - Market share (2023-2028) (%)
      • Data Table on Type - Market share (2023-2028) (%)
    • 7.2 Comparison by Type
      • Chart on Comparison by Type
      • Data Table on Comparison by Type
    • 7.3 Software - Market size and forecast (2023-2028)
      • Chart on Software - Market size and forecast (2023-2028) ($ million)
      • Data Table on Software - Market size and forecast (2023-2028) ($ million)
      • Chart on Software - Year-over-year growth (2023-2028) (%)
      • Data Table on Software - Year-over-year growth (2023-2028) (%)
    • 7.4 Services - Market size and forecast (2023-2028)
      • Chart on Services - Market size and forecast (2023-2028) ($ million)
      • Data Table on Services - Market size and forecast (2023-2028) ($ million)
      • Chart on Services - Year-over-year growth (2023-2028) (%)
      • Data Table on Services - Year-over-year growth (2023-2028) (%)
    • 7.5 Market opportunity by Type
      • Market opportunity by Type ($ million)
      • Data Table on Market opportunity by Type ($ million)

    8 Market Segmentation by Deployment

    • 8.1 Market segments
      • Chart on Deployment - Market share (2023-2028) (%)
      • Data Table on Deployment - Market share (2023-2028) (%)
    • 8.2 Comparison by Deployment
      • Chart on Comparison by Deployment
      • Data Table on Comparison by Deployment
    • 8.3 Cloud-based - Market size and forecast (2023-2028)
      • Chart on Cloud-based - Market size and forecast (2023-2028) ($ million)
      • Data Table on Cloud-based - Market size and forecast (2023-2028) ($ million)
      • Chart on Cloud-based - Year-over-year growth (2023-2028) (%)
      • Data Table on Cloud-based - Year-over-year growth (2023-2028) (%)
    • 8.4 On-premises - Market size and forecast (2023-2028)
      • Chart on On-premises - Market size and forecast (2023-2028) ($ million)
      • Data Table on On-premises - Market size and forecast (2023-2028) ($ million)
      • Chart on On-premises - Year-over-year growth (2023-2028) (%)
      • Data Table on On-premises - Year-over-year growth (2023-2028) (%)
    • 8.5 Hybrid - Market size and forecast (2023-2028)
      • Chart on Hybrid - Market size and forecast (2023-2028) ($ million)
      • Data Table on Hybrid - Market size and forecast (2023-2028) ($ million)
      • Chart on Hybrid - Year-over-year growth (2023-2028) (%)
      • Data Table on Hybrid - Year-over-year growth (2023-2028) (%)
    • 8.6 Market opportunity by Deployment
      • Market opportunity by Deployment ($ million)
      • Data Table on Market opportunity by Deployment ($ million)

    9 Market Segmentation by Application

    • 9.1 Market segments
      • Chart on Application - Market share (2023-2028) (%)
      • Data Table on Application - Market share (2023-2028) (%)
      • Chart on Logistics - Market size and forecast (2023-2028) ($ million)
      • Data Table on Logistics - Market size and forecast (2023-2028) ($ million)
      • Chart on Logistics - Year-over-year growth (2023-2028) (%)
      • Data Table on Logistics - Year-over-year growth (2023-2028) (%)
    • 9.2 Comparison by Application
      • Chart on Comparison by Application
      • Data Table on Comparison by Application
      • Market opportunity by Application ($ million)
      • Data Table on Market opportunity by Application ($ million)
    • 9.3 BFSI - Market size and forecast (2023-2028)
      • Chart on BFSI - Market size and forecast (2023-2028) ($ million)
      • Data Table on BFSI - Market size and forecast (2023-2028) ($ million)
      • Chart on BFSI - Year-over-year growth (2023-2028) (%)
      • Data Table on BFSI - Year-over-year growth (2023-2028) (%)
    • 9.4 IT & Telecom - Market size and forecast (2023-2028)
      • Chart on IT & Telecom - Market size and forecast (2023-2028) ($ million)
      • Data Table on IT & Telecom - Market size and forecast (2023-2028) ($ million)
      • Chart on IT & Telecom - Year-over-year growth (2023-2028) (%)
      • Data Table on IT & Telecom - Year-over-year growth (2023-2028) (%)
    • 9.5 Healthcare - Market size and forecast (2023-2028)
      • Chart on Healthcare - Market size and forecast (2023-2028) ($ million)
      • Data Table on Healthcare - Market size and forecast (2023-2028) ($ million)
      • Chart on Healthcare - Year-over-year growth (2023-2028) (%)
      • Data Table on Healthcare - Year-over-year growth (2023-2028) (%)
    • 9.6 Retail & E-commerce - Market size and forecast (2023-2028)
      • Chart on Retail & E-commerce - Market size and forecast (2023-2028) ($ million)
      • Data Table on Retail & E-commerce - Market size and forecast (2023-2028) ($ million)
      • Chart on Retail & E-commerce - Year-over-year growth (2023-2028) (%)
      • Data Table on Retail & E-commerce - Year-over-year growth (2023-2028) (%)
    • 9.7 Manufacturing - Market size and forecast (2023-2028)
      • Chart on Manufacturing - Market size and forecast (2023-2028) ($ million)
      • Data Table on Manufacturing - Market size and forecast (2023-2028) ($ million)
      • Chart on Manufacturing - Year-over-year growth (2023-2028) (%)
      • Data Table on Manufacturing - Year-over-year growth (2023-2028) (%)
    • 9.8 Government - Market size and forecast (2023-2028)
      • Chart on Government - Market size and forecast (2023-2028) ($ million)
      • Data Table on Government - Market size and forecast (2023-2028) ($ million)
      • Chart on Government - Year-over-year growth (2023-2028) (%)
      • Data Table on Government - Year-over-year growth (2023-2028) (%)
    • 9.9 Media & Entertainment - Market size and forecast (2023-2028)
      • Chart on Media & Entertainment - Market size and forecast (2023-2028) ($ million)
      • Data Table on Media & Entertainment - Market size and forecast (2023-2028) ($ million)
      • Chart on Media & Entertainment - Year-over-year growth (2023-2028) (%)
      • Data Table on Media & Entertainment - Year-over-year growth (2023-2028) (%)

    8 Customer Landscape

    • 8.1 Customer landscape overview
      • Exhibit 58: Analysis of price sensitivity, lifecycle, customer purchase basket, adoption rates, and purchase criteria

    9 Geographic Landscape

    • 9.1 Geographic segmentation
      • Exhibit 59: Chart on Market share by geography 2023-2028 (%)
      • Exhibit 60: Data Table on Market share by geography 2023-2028 (%)
    • 9.2 Geographic comparison
      • Exhibit 61: Chart on Geographic comparison
      • Exhibit 62: Data Table on Geographic comparison
    • 9.3 North America - Market size and forecast 2023-2028
      • Exhibit 63: Chart on North America - Market size and forecast 2023-2028 ($ million)
      • Exhibit 64: Data Table on North America - Market size and forecast 2023-2028 ($ million)
      • Exhibit 65: Chart on North America - Year-over-year growth 2023-2028 (%)
      • Exhibit 66: Data Table on North America - Year-over-year growth 2023-2028 (%)
    • 9.4 Europe - Market size and forecast 2023-2028
      • Exhibit 67: Chart on Europe - Market size and forecast 2023-2028 ($ million)
      • Exhibit 68: Data Table on Europe - Market size and forecast 2023-2028 ($ million)
      • Exhibit 69: Chart on Europe - Year-over-year growth 2023-2028 (%)
      • Exhibit 70: Data Table on Europe - Year-over-year growth 2023-2028 (%)
    • 9.5 APAC - Market size and forecast 2023-2028
      • Exhibit 71: Chart on APAC - Market size and forecast 2023-2028 ($ million)
      • Exhibit 72: Data Table on APAC - Market size and forecast 2023-2028 ($ million)
      • Exhibit 73: Chart on APAC - Year-over-year growth 2023-2028 (%)
      • Exhibit 74: Data Table on APAC - Year-over-year growth 2023-2028 (%)
    • 9.6 South America - Market size and forecast 2023-2028
      • Exhibit 75: Chart on South America - Market size and forecast 2023-2028 ($ million)
      • Exhibit 76: Data Table on South America - Market size and forecast 2023-2028 ($ million)
      • Exhibit 77: Chart on South America - Year-over-year growth 2023-2028 (%)
      • Exhibit 78: Data Table on South America - Year-over-year growth 2023-2028 (%)
    • 9.7 Middle East and Africa - Market size and forecast 2023-2028
      • Exhibit 79: Chart on Middle East and Africa - Market size and forecast 2023-2028 ($ million)
      • Exhibit 80: Data Table on Middle East and Africa - Market size and forecast 2023-2028 ($ million)
      • Exhibit 81: Chart on Middle East and Africa - Year-over-year growth 2023-2028 (%)
      • Exhibit 82: Data Table on Middle East and Africa - Year-over-year growth 2023-2028 (%)
    • 9.8 US - Market size and forecast 2023-2028
      • Exhibit 83: Chart on US - Market size and forecast 2023-2028 ($ million)
      • Exhibit 84: Data Table on US - Market size and forecast 2023-2028 ($ million)
      • Exhibit 85: Chart on US - Year-over-year growth 2023-2028 (%)
      • Exhibit 86: Data Table on US - Year-over-year growth 2023-2028 (%)
    • 9.9 China - Market size and forecast 2023-2028
      • Exhibit 87: Chart on China - Market size and forecast 2023-2028 ($ million)
      • Exhibit 88: Data Table on China - Market size and forecast 2023-2028 ($ million)
      • Exhibit 89: Chart on China - Year-over-year growth 2023-2028 (%)
      • Exhibit 90: Data Table on China - Year-over-year growth 2023-2028 (%)
    • 9.10 UK - Market size and forecast 2023-2028
      • Exhibit 91: Chart on UK - Market size and forecast 2023-2028 ($ million)
      • Exhibit 92: Data Table on UK - Market size and forecast 2023-2028 ($ million)
      • Exhibit 93: Chart on UK - Year-over-year growth 2023-2028 (%)
      • Exhibit 94: Data Table on UK - Year-over-year growth 2023-2028 (%)
    • 9.11 Germany - Market size and forecast 2023-2028
      • Exhibit 95: Chart on Germany - Market size and forecast 2023-2028 ($ million)
      • Exhibit 96: Data Table on Germany - Market size and forecast 2023-2028 ($ million)
      • Exhibit 97: Chart on Germany - Year-over-year growth 2023-2028 (%)
      • Exhibit 98: Data Table on Germany - Year-over-year growth 2023-2028 (%)
    • 9.12 Japan - Market size and forecast 2023-2028
      • Exhibit 99: Chart on Japan - Market size and forecast 2023-2028 ($ million)
      • Exhibit 100: Data Table on Japan - Market size and forecast 2023-2028 ($ million)
      • Exhibit 101: Chart on Japan - Year-over-year growth 2023-2028 (%)
      • Exhibit 102: Data Table on Japan - Year-over-year growth 2023-2028 (%)
    • 9.13 Market opportunity by geography
      • Exhibit 103: Market opportunity by geography ($ million)
      • Exhibit 104: Data Tables on Market opportunity by geography ($ million)
    • 11.14 Canada - Market size and forecast (2023-2028)
      • Chart on Canada - Market size and forecast (2023-2028) ($ million)
      • Data Table on Canada - Market size and forecast (2023-2028) ($ million)
      • Chart on Canada - Year-over-year growth (2023-2028) (%)
      • Data Table on Canada - Year-over-year growth (2023-2028) (%)
    • 11.15 Italy - Market size and forecast (2023-2028)
      • Chart on Italy - Market size and forecast (2023-2028) ($ million)
      • Data Table on Italy - Market size and forecast (2023-2028) ($ million)
      • Chart on Italy - Year-over-year growth (2023-2028) (%)
      • Data Table on Italy - Year-over-year growth (2023-2028) (%)
    • 11.16 France - Market size and forecast (2023-2028)
      • Chart on France - Market size and forecast (2023-2028) ($ million)
      • Data Table on France - Market size and forecast (2023-2028) ($ million)
      • Chart on France - Year-over-year growth (2023-2028) (%)
      • Data Table on France - Year-over-year growth (2023-2028) (%)
    • 11.17 India - Market size and forecast (2023-2028)
      • Chart on India - Market size and forecast (2023-2028) ($ million)
      • Data Table on India - Market size and forecast (2023-2028) ($ million)
      • Chart on India - Year-over-year growth (2023-2028) (%)
      • Data Table on India - Year-over-year growth (2023-2028) (%)
    • 11.18 Brazil - Market size and forecast (2023-2028)
      • Chart on Brazil - Market size and forecast (2023-2028) ($ million)
      • Data Table on Brazil - Market size and forecast (2023-2028) ($ million)
      • Chart on Brazil - Year-over-year growth (2023-2028) (%)
      • Data Table on Brazil - Year-over-year growth (2023-2028) (%)
    • 11.19 Egypt - Market size and forecast (2023-2028)
      • Chart on Egypt - Market size and forecast (2023-2028) ($ million)
      • Data Table on Egypt - Market size and forecast (2023-2028) ($ million)
      • Chart on Egypt - Year-over-year growth (2023-2028) (%)
      • Data Table on Egypt - Year-over-year growth (2023-2028) (%)
    • 11.20 UAE - Market size and forecast (2023-2028)
      • Chart on UAE - Market size and forecast (2023-2028) ($ million)
      • Data Table on UAE - Market size and forecast (2023-2028) ($ million)
      • Chart on UAE - Year-over-year growth (2023-2028) (%)
      • Data Table on UAE - Year-over-year growth (2023-2028) (%)
    • 11.21 Oman - Market size and forecast (2023-2028)
      • Chart on Oman - Market size and forecast (2023-2028) ($ million)
      • Data Table on Oman - Market size and forecast (2023-2028) ($ million)
      • Chart on Oman - Year-over-year growth (2023-2028) (%)
      • Data Table on Oman - Year-over-year growth (2023-2028) (%)
    • 11.22 Argentina - Market size and forecast (2023-2028)
      • Chart on Argentina - Market size and forecast (2023-2028) ($ million)
      • Data Table on Argentina - Market size and forecast (2023-2028) ($ million)
      • Chart on Argentina - Year-over-year growth (2023-2028) (%)
      • Data Table on Argentina - Year-over-year growth (2023-2028) (%)
    • 11.23 KSA - Market size and forecast (2023-2028)
      • Chart on KSA - Market size and forecast (2023-2028) ($ million)
      • Data Table on KSA - Market size and forecast (2023-2028) ($ million)
      • Chart on KSA - Year-over-year growth (2023-2028) (%)
      • Data Table on KSA - Year-over-year growth (2023-2028) (%)
    • 11.24 Rest of World (ROW) - Market size and forecast (2023-2028)
      • Chart on Rest of World (ROW) - Market size and forecast (2023-2028) ($ million)
      • Data Table on Rest of World (ROW) - Market size and forecast (2023-2028) ($ million)
      • Chart on Rest of World (ROW) - Year-over-year growth (2023-2028) (%)
      • Data Table on Rest of World (ROW) - Year-over-year growth (2023-2028) (%)

    10 Drivers, Challenges, and Trends

    • 10.1 Market drivers
      • 10.2 Market challenges
        • 10.3 Impact of drivers and challenges
          • Exhibit 105: Impact of drivers and challenges in 2023 and 2028
        • 10.4 Market trends

          11 Vendor Landscape

          • 11.1 Overview
            • 11.2 Vendor landscape
              • Exhibit 106: Overview on Criticality of inputs and Factors of differentiation
            • 11.3 Landscape disruption
              • Exhibit 107: Overview on factors of disruption
            • 11.4 Industry risks
              • Exhibit 108: Impact of key risks on business

            14 Competitive Analysis

            • 14.1 Companies profiled
              • Companies covered
            • 14.2 Market positioning of companies
              • Matrix on companies position and classification
            • 14.3 AppDynamics (Cisco)
              • AppDynamics (Cisco) - Overview
              • AppDynamics (Cisco) - Product / Service
              • AppDynamics (Cisco) - Key offerings
            • 14.4 Broadcom (CA Technologies)
              • Broadcom (CA Technologies) - Overview
              • Broadcom (CA Technologies) - Product / Service
              • Broadcom (CA Technologies) - Key offerings
            • 14.5 BMC Software
              • BMC Software - Overview
              • BMC Software - Product / Service
              • BMC Software - Key offerings
            • 14.6 Datadog
              • Datadog - Overview
              • Datadog - Product / Service
              • Datadog - Key offerings
            • 14.7 Dell EMC
              • Dell EMC - Overview
              • Dell EMC - Product / Service
              • Dell EMC - Key offerings
            • 14.8 Dynatrace
              • Dynatrace - Overview
              • Dynatrace - Product / Service
              • Dynatrace - Key offerings
            • 14.9 Elastic
              • Elastic - Overview
              • Elastic - Product / Service
              • Elastic - Key offerings
            • 14.10 ExtraHop Networks
              • ExtraHop Networks - Overview
              • ExtraHop Networks - Product / Service
              • ExtraHop Networks - Key offerings
            • 14.11 Hewlett Packard Enterprise (HPE)
              • Hewlett Packard Enterprise (HPE) - Overview
              • Hewlett Packard Enterprise (HPE) - Product / Service
              • Hewlett Packard Enterprise (HPE) - Key offerings
            • 14.12 IBM
              • IBM - Overview
              • IBM - Product / Service
              • IBM - Key offerings
            • 14.13 ManageEngine (Zoho Corporation)
              • ManageEngine (Zoho Corporation) - Overview
              • ManageEngine (Zoho Corporation) - Product / Service
              • ManageEngine (Zoho Corporation) - Key offerings
            • 14.14 Microsoft
              • Microsoft - Overview
              • Microsoft - Product / Service
              • Microsoft - Key offerings
            • 14.15 New Relic
              • New Relic - Overview
              • New Relic - Product / Service
              • New Relic - Key offerings
            • 14.16 Oracle
              • Oracle - Overview
              • Oracle - Product / Service
              • Oracle - Key offerings
            • 14.17 Riverbed Technology
              • Riverbed Technology - Overview
              • Riverbed Technology - Product / Service
              • Riverbed Technology - Key offerings
            • 14.18 SAP
              • SAP - Overview
              • SAP - Product / Service
              • SAP - Key offerings
            • 14.19 SolarWinds
              • SolarWinds - Overview
              • SolarWinds - Product / Service
              • SolarWinds - Key offerings
            • 14.20 Splunk
              • Splunk - Overview
              • Splunk - Product / Service
              • Splunk - Key offerings
            • 14.21 Stackify Retrace
              • Stackify Retrace - Overview
              • Stackify Retrace - Product / Service
              • Stackify Retrace - Key offerings
            • 14.22 VMware
              • VMware - Overview
              • VMware - Product / Service
              • VMware - Key offerings
            • 14.23 Akamai Technologies Inc.
              • Akamai Technologies Inc. - Overview
              • Akamai Technologies Inc. - Product / Service
              • Akamai Technologies Inc. - Key offerings
            • 14.24 Alphabet Inc.
              • Alphabet Inc. - Overview
              • Alphabet Inc. - Product / Service
              • Alphabet Inc. - Key offerings
            • 14.25 BMC Software Inc.
              • BMC Software Inc. - Overview
              • BMC Software Inc. - Product / Service
              • BMC Software Inc. - Key offerings
            • 14.26 Broadcom Inc.
              • Broadcom Inc. - Overview
              • Broadcom Inc. - Product / Service
              • Broadcom Inc. - Key offerings
            • 14.27 Cisco Systems Inc.
              • Cisco Systems Inc. - Overview
              • Cisco Systems Inc. - Product / Service
              • Cisco Systems Inc. - Key offerings
            • 14.28 Datadog Inc.
              • Datadog Inc. - Overview
              • Datadog Inc. - Product / Service
              • Datadog Inc. - Key offerings
            • 14.29 Dynatrace Inc.
              • Dynatrace Inc. - Overview
              • Dynatrace Inc. - Product / Service
              • Dynatrace Inc. - Key offerings
            • 14.30 Fujitsu Ltd.
              • Fujitsu Ltd. - Overview
              • Fujitsu Ltd. - Product / Service
              • Fujitsu Ltd. - Key offerings
            • 14.31 Hexaware Technologies Ltd.
              • Hexaware Technologies Ltd. - Overview
              • Hexaware Technologies Ltd. - Product / Service
              • Hexaware Technologies Ltd. - Key offerings
            • 14.32 International Business Machines Corp.
              • International Business Machines Corp. - Overview
              • International Business Machines Corp. - Product / Service
              • International Business Machines Corp. - Key offerings
            • 14.33 LogicMonitor Inc.
              • LogicMonitor Inc. - Overview
              • LogicMonitor Inc. - Product / Service
              • LogicMonitor Inc. - Key offerings
            • 14.34 Microsoft Corp.
              • Microsoft Corp. - Overview
              • Microsoft Corp. - Product / Service
              • Microsoft Corp. - Key offerings
            • 14.35 Netreo Inc.
              • Netreo Inc. - Overview
              • Netreo Inc. - Product / Service
              • Netreo Inc. - Key offerings
            • 14.36 New Relic Inc.
              • New Relic Inc. - Overview
              • New Relic Inc. - Product / Service
              • New Relic Inc. - Key offerings
            • 14.37 Open Text Corp.
              • Open Text Corp. - Overview
              • Open Text Corp. - Product / Service
              • Open Text Corp. - Key offerings
            • 14.38 Quest Software Inc.
              • Quest Software Inc. - Overview
              • Quest Software Inc. - Product / Service
              • Quest Software Inc. - Key offerings
            • 14.39 Riverbed Technology Inc.
              • Riverbed Technology Inc. - Overview
              • Riverbed Technology Inc. - Product / Service
              • Riverbed Technology Inc. - Key offerings
            • 14.40 Splunk Inc.
              • Splunk Inc. - Overview
              • Splunk Inc. - Product / Service
              • Splunk Inc. - Key offerings
            • 14.41 Sumo Logic Inc.
              • Sumo Logic Inc. - Overview
              • Sumo Logic Inc. - Product / Service
              • Sumo Logic Inc. - Key offerings
            • 14.42 Zoho Corp. Pvt. Ltd.
              • Zoho Corp. Pvt. Ltd. - Overview
              • Zoho Corp. Pvt. Ltd. - Product / Service
              • Zoho Corp. Pvt. Ltd. - Key offerings

            13 Appendix

            • 13.1 Scope of the report
              • 13.2 Inclusions and exclusions checklist
                • Exhibit 171: Inclusions checklist
                • Exhibit 172: Exclusions checklist
              • 13.3 Currency conversion rates for US$
                • Exhibit 173: Currency conversion rates for US$
              • 13.4 Research methodology
                • Exhibit 174: Research methodology
                • Exhibit 175: Validation techniques employed for market sizing
                • Exhibit 176: Information sources
              • 13.5 List of abbreviations
                • Exhibit 177: List of abbreviations

              Research Methodology

              Technavio presents a detailed picture of the market by way of study, synthesis, and summation of data from multiple sources. The analysts have presented the various facets of the market with a particular focus on identifying the key industry influencers. The data thus presented is comprehensive, reliable, and the result of extensive research, both primary and secondary.

              INFORMATION SOURCES

              Primary sources

              • Manufacturers and suppliers
              • Channel partners
              • Industry experts
              • Strategic decision makers

              Secondary sources

              • Industry journals and periodicals
              • Government data
              • Financial reports of key industry players
              • Historical data
              • Press releases

              DATA ANALYSIS

              Data Synthesis

              • Collation of data
              • Estimation of key figures
              • Analysis of derived insights

              Data Validation

              • Triangulation with data models
              • Reference against proprietary databases
              • Corroboration with industry experts

              REPORT WRITING

              Qualitative

              • Market drivers
              • Market challenges
              • Market trends
              • Five forces analysis

              Quantitative

              • Market size and forecast
              • Market segmentation
              • Geographical insights
              • Competitive landscape

              Interested in this report?

              Get your sample now to see our research methodology and insights!

              Download Now

              Frequently Asked Questions

              Application Performance Management market growth will increase by $ 26003.19 mn during 2024-2028.

              The Application Performance Management market is expected to grow at a CAGR of 30.07% during 2024-2028.

              Application Performance Management market is segmented by End-user( Large enterprises, SMEs) Type( Software, Services)

              AppDynamics (Cisco), Broadcom (CA Technologies), BMC Software, Datadog, Dell EMC, Dynatrace, Elastic, ExtraHop Networks, Hewlett Packard Enterprise (HPE), IBM, ManageEngine (Zoho Corporation), Microsoft, New Relic, Oracle, Riverbed Technology, SAP, SolarWinds, Splunk, Stackify Retrace, VMware are a few of the key vendors in the Application Performance Management market.

              North America will register the highest growth rate of 32% among the other regions. Therefore, the Application Performance Management market in North America is expected to garner significant business opportunities for the vendors during the forecast period.

              US, Canada, Germany, UK, Italy, France, China, India, Japan, Brazil, Egypt, UAE, Oman, Argentina, KSA, UAE, Brazil, Rest of World (ROW)

              • Rising adoption of digital technologies like mobile applications and microservices architectureThe global application performance management market has witnessed significant growth in recent years is the driving factor this market.
              • driven by more businesses embracing digital technologies to enhance their operations and provide a seamless user experience. With the increasing reliance on mobile applications and the adoption of microservices architectures is the driving factor this market.
              • application performance management has become a critical component for businesses to ensure optimal performance and maintain customer satisfaction. Mobile applications have revolutionized the way businesses interact with their customers. From e-commerce platforms to banking services is the driving factor this market.
              • mobile apps have become an integral part of the daily lives of most people worldwide. However is the driving factor this market.
              • as businesses rely heavily on these applications is the driving factor this market.
              • any performance issues can have detrimental effects on user experience and brand reputation. This has created a growing need for application performance management solutions that can monitor and manage mobile application performance in real time. Application performance management tools provide insights into various performance metrics is the driving factor this market.
              • including response time is the driving factor this market.
              • data transfer speeds is the driving factor this market.
              • error rates is the driving factor this market.
              • and user interaction. This allows businesses to proactively identify and diagnose performance bottlenecks is the driving factor this market.
              • enabling them to optimize their mobile applications for a better user experience. For example is the driving factor this market.
              • a retail company that uses application performance management can quickly identify slow-loading product pages or checkout processes and optimize them to reduce friction and increase conversions. Along with mobile applications is the driving factor this market.
              • the adoption of microservices architectures has also contributed to the growth of the global application performance management market. Microservices offer a modular approach to application development is the driving factor this market.
              • allowing businesses to break down monolithic applications into smaller is the driving factor this market.
              • interconnected services. While this provides flexibility and scalability is the driving factor this market.
              • it also introduces new challenges in managing the performance of distributed systems. Application performance management solutions have evolved to cater to the unique demands of microservices architectures. They provide comprehensive monitoring and tracing capabilities is the driving factor this market.
              • allowing businesses to track their performance across various services and quickly identify any bottlenecks or failures. For instance is the driving factor this market.
              • a banking institution that utilizes microservices can utilize application performance management tools to pinpoint any delays in transaction processing or identify the root cause of a service outage. Businesses have recognized the importance of monitoring and optimizing performance to provide exceptional user experiences. By leveraging application performance management solutions is the driving factor this market.
              • businesses can proactively identify performance issues is the driving factor this market.
              • address them promptly is the driving factor this market.
              • and deliver seamless services to their customers. As the digital landscape continues to evolve is the driving factor this market.
              • application performance management solutions will remain a vital tool for businesses to stay competitive and maintain customer satisfaction is the driving factor this market.
              • which is the driving factor this market.
              • in turn is the driving factor this market.
              • will drive the growth of the global application performance management market during the forecast period. is the driving factor this market.

              The Application Performance Management market vendors should focus on grabbing business opportunities from the Large enterprises segment as it accounted for the largest market share in the base year.
              RIA - Research AI Assistant
              Ask RIA