Cloud Storage Services Market Analysis, Size, and Forecast 2026-2030: North America (US, Canada, and Mexico), APAC (China, Japan, and India), Europe (Germany, UK, and France), South America (Brazil and Argentina), Middle East and Africa (Saudi Arabia, UAE, and South Africa), and Rest of World (ROW)

Cloud Storage Services Market Analysis, Size, and Forecast 2026-2030:
North America (US, Canada, and Mexico), APAC (China, Japan, and India), Europe (Germany, UK, and France), South America (Brazil and Argentina), Middle East and Africa (Saudi Arabia, UAE, and South Africa), and Rest of World (ROW)

Published: Apr 2026 312 Pages SKU: IRTNTR40155

Market Overview at a Glance

$259.47 B
Market Opportunity
25.5%
CAGR 2025 - 2030
41.1%
North America Growth
$64.21 B
Solutions segment 2024

Cloud Storage Services Market Size 2026-2030

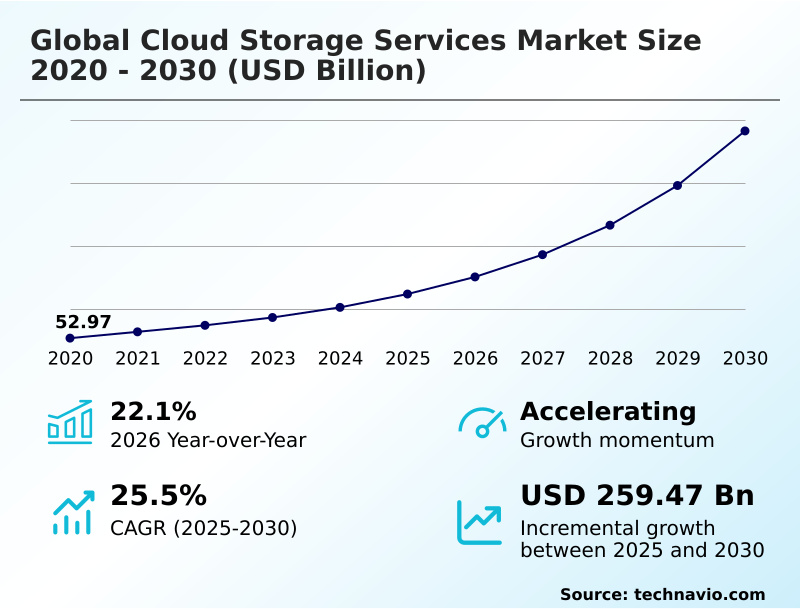
The cloud storage services market size is valued to increase by USD 259.47 billion, at a CAGR of 25.5% from 2025 to 2030. Proliferation of AI and ML workloads will drive the cloud storage services market.

Major Market Trends & Insights

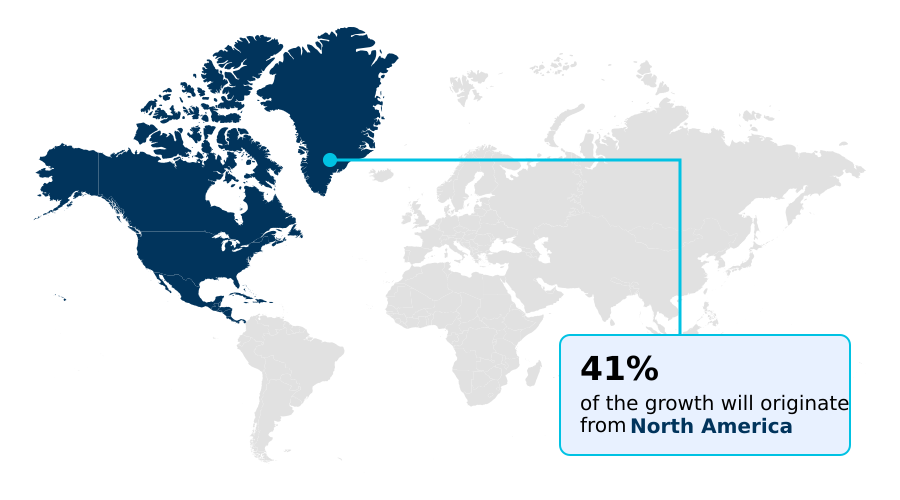
  • North America dominated the market and accounted for a 41.1% growth during the forecast period.
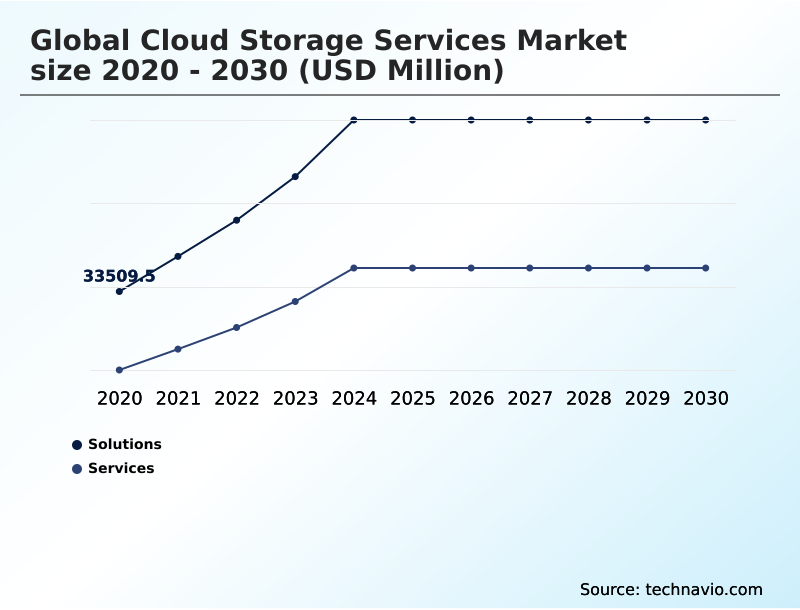
  • By Component - Solutions segment was valued at USD 64.21 billion in 2024
  • By Type - Public segment accounted for the largest market revenue share in 2024

Market Size & Forecast

  • Market Opportunities: USD 329.63 billion
  • Market Future Opportunities: USD 259.47 billion
  • CAGR from 2025 to 2030 : 25.5%

Market Summary

  • The cloud storage services market forms the foundational backbone of the modern digital economy, evolving far beyond simple data preservation. Growth is propelled by the transition toward data-driven decision-making, where organizations require high-performance repositories for AI and machine learning applications. This has shifted focus from passive archival to active data lakes supporting high-velocity processing.
  • Consequently, hybrid and multi-cloud architectures are becoming standard, allowing enterprises to optimize costs and avoid vendor lock-in. For instance, a global manufacturing firm might use a private cloud for sensitive intellectual property and operational data while leveraging a public cloud’s elastic compute power for supply chain analytics and predictive maintenance modeling. This strategic data placement balances security with agility.
  • However, this complex environment introduces challenges related to navigating divergent global data sovereignty mandates and mitigating sophisticated cybersecurity threats, demanding robust governance and zero-trust security frameworks to ensure data integrity and compliance across jurisdictions.

What will be the Size of the Cloud Storage Services Market during the forecast period?

Get Key Insights on Market Forecast (PDF) Get Free Sample

How is the Cloud Storage Services Market Segmented?

The cloud storage services industry research report provides comprehensive data (region-wise segment analysis), with forecasts and estimates in "USD million" for the period 2026-2030, as well as historical data from 2020-2024 for the following segments.

  • Component
    • Solutions
    • Services
  • Type
    • Public
    • Private
    • Hybrid
  • End-user
    • IT and telecom
    • BFSI
    • Government and public sector
    • Healthcare
    • Others
  • Geography
    • North America
      • US
      • Canada
      • Mexico
    • APAC
      • China
      • Japan
      • India
    • Europe
      • Germany
      • UK
      • France
    • South America
      • Brazil
      • Argentina
    • Middle East and Africa
      • Saudi Arabia
      • UAE
      • South Africa
    • Rest of World (ROW)

By Component Insights

The solutions segment is estimated to witness significant growth during the forecast period.

The solutions sub-segment is central to the market, providing the architectural frameworks for storing and securing digital information. This includes primary storage for active workloads, as well as essential backup and disaster recovery solutions.

Demand for object storage is expanding due to the growth of unstructured data from IoT devices and multimedia content. This technology manages data via metadata, offering superior scalability.

Innovations like autonomous tiering, which uses machine learning for intelligent data placement, are becoming critical. This approach enhances operational efficiency, as evidenced by a 40% reduction in data retrieval latency for some international research enterprises using AI-optimized tiers.

Furthermore, container-native storage supports modern application development, making the solutions segment the core of the cloud ecosystem's efficiency.

Get Free Sample

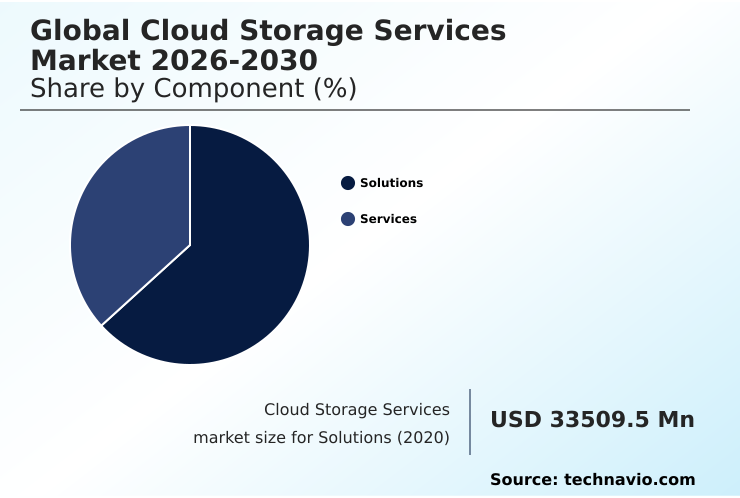
The Solutions segment was valued at USD 64.21 billion in 2024 and showed a gradual increase during the forecast period.

Get Free Sample

Regional Analysis

North America is estimated to contribute 41.1% to the growth of the global market during the forecast period.Technavio’s analysts have elaborately explained the regional trends and drivers that shape the market during the forecast period.

See How Cloud Storage Services Market Demand is Rising in North America Get Free Sample

The geographic distribution of the cloud storage services market is characterized by a mature North American sector and a rapidly accelerating APAC region.

While North America holds a substantial market share, driven by its extensive hyperscale infrastructure, the APAC region is projected to have the fastest growth, with a CAGR of 28.4%, fueled by widespread digitalization and mobile-first economies.

Data sovereignty and residency regulations significantly influence regional strategies, particularly in Europe, where compliance with GDPR is paramount. This has driven demand for localized data centers and sovereign cloud solutions.

In contrast, emerging markets in South America and the Middle East and Africa are increasingly adopting cloud-native approaches, often bypassing legacy on-premises systems.

This diverse global landscape necessitates flexible, geo-specific strategies from service providers to address varying regulatory, economic, and technological conditions.

Market Dynamics

Our researchers analyzed the data with 2025 as the base year, along with the key drivers, trends, and challenges. A holistic analysis of drivers will help companies refine their marketing strategies to gain a competitive advantage.

  • Enterprises are increasingly adopting a multi-faceted approach to their data strategies to balance performance, cost, and compliance. The need for cost-effective archival storage solutions for retaining vast amounts of historical data is a primary consideration, often forming the foundational layer of an organization's storage architecture.
  • However, the real challenge lies in managing unstructured data at scale, which now constitutes the bulk of enterprise information. This has spurred the adoption of AI-powered data classification and tiering, allowing for automated and intelligent data placement. As businesses harness analytics and machine learning, the demand for high-throughput object storage for analytics becomes critical, enabling rapid insights from massive datasets.
  • To secure these distributed environments, implementing zero-trust security for cloud data is non-negotiable. This strategy is complemented by hybrid cloud storage orchestration tools that provide a unified management plane across on-premises and public cloud resources. Furthermore, reducing data retrieval latency for AI is essential for real-time applications and model training.
  • Central to this entire ecosystem is a strict adherence to data sovereignty and residency compliance, which dictates architectural choices and deployment models. Organizations that successfully integrate these elements can achieve a storage cost reduction of over 30% compared to traditional, unmanaged approaches, directly impacting IT budget efficiency and overall business agility.

What are the key market drivers leading to the rise in the adoption of Cloud Storage Services Industry?

  • The proliferation of AI and machine learning workloads serves as a key driver for the market's growth.

  • The market is primarily driven by the exponential growth of AI and machine learning workloads, which demand massive, high-performance storage repositories.
  • The transition toward generative AI has fundamentally altered infrastructure requirements, favoring active data lakes that support high-velocity processing over traditional archival systems.
  • In response, providers have introduced specialized AI-optimized object storage tiers that can reduce data retrieval latency by as much as 40%. A second major driver is the escalating complexity of global data security and regulatory compliance.
  • Stringent mandates like GDPR necessitate solutions with granular access controls and localized data hosting.
  • This regulatory pressure is accelerating the migration from legacy on-premises systems to more secure and compliant cloud environments that feature zero-trust architectures and immutable storage to protect against ransomware and unauthorized access.

What are the market trends shaping the Cloud Storage Services Industry?

  • The integration of generative AI is fundamentally reshaping cloud infrastructure, leading to the emergence of autonomous storage management as a defining market trend.

  • Key market trends are converging around intelligence and distribution. The integration of generative AI is transforming passive repositories into active, intelligent data platforms, with autonomous storage management systems using machine learning to optimize data placement and automate lifecycle tasks. This shift toward AI-native infrastructure has led to the direct embedding of vector database capabilities into object storage services.
  • Concurrently, a move from centralized data centers to distributed edge storage and decentralized architectures is underway, driven by the need to reduce latency for real-time applications. The expansion of 5G networks and IoT devices accelerates this trend, making localized data processing a critical component of modern strategies.
  • In some deployments, edge storage has been shown to reduce application latency by up to 70%, enhancing user experience and enabling new use cases in industrial automation and smart city infrastructure.

What challenges does the Cloud Storage Services Industry face during its growth?

  • The persistent complexity of data egress fees and the challenge of company lock-in present significant hurdles to industry growth.

  • Primary market challenges stem from financial friction and security vulnerabilities. Data egress fees and vendor lock-in remain significant barriers, creating unpredictable costs and limiting multi-cloud strategies; this issue is a primary concern for 94% of IT leaders. The complexity and expense of moving data between platforms often force organizations to remain with suboptimal providers.
  • Simultaneously, the threat landscape is escalating, with a documented 154% year-over-year surge in cloud security incidents, many resulting from customer-side misconfigurations and mismanaged credentials. The fragmentation of global data regulations further complicates operations, forcing organizations to deploy duplicate infrastructure to meet disparate data residency laws, thereby increasing costs and reducing the inherent scalability benefits of the cloud.

Exclusive Technavio Analysis on Customer Landscape

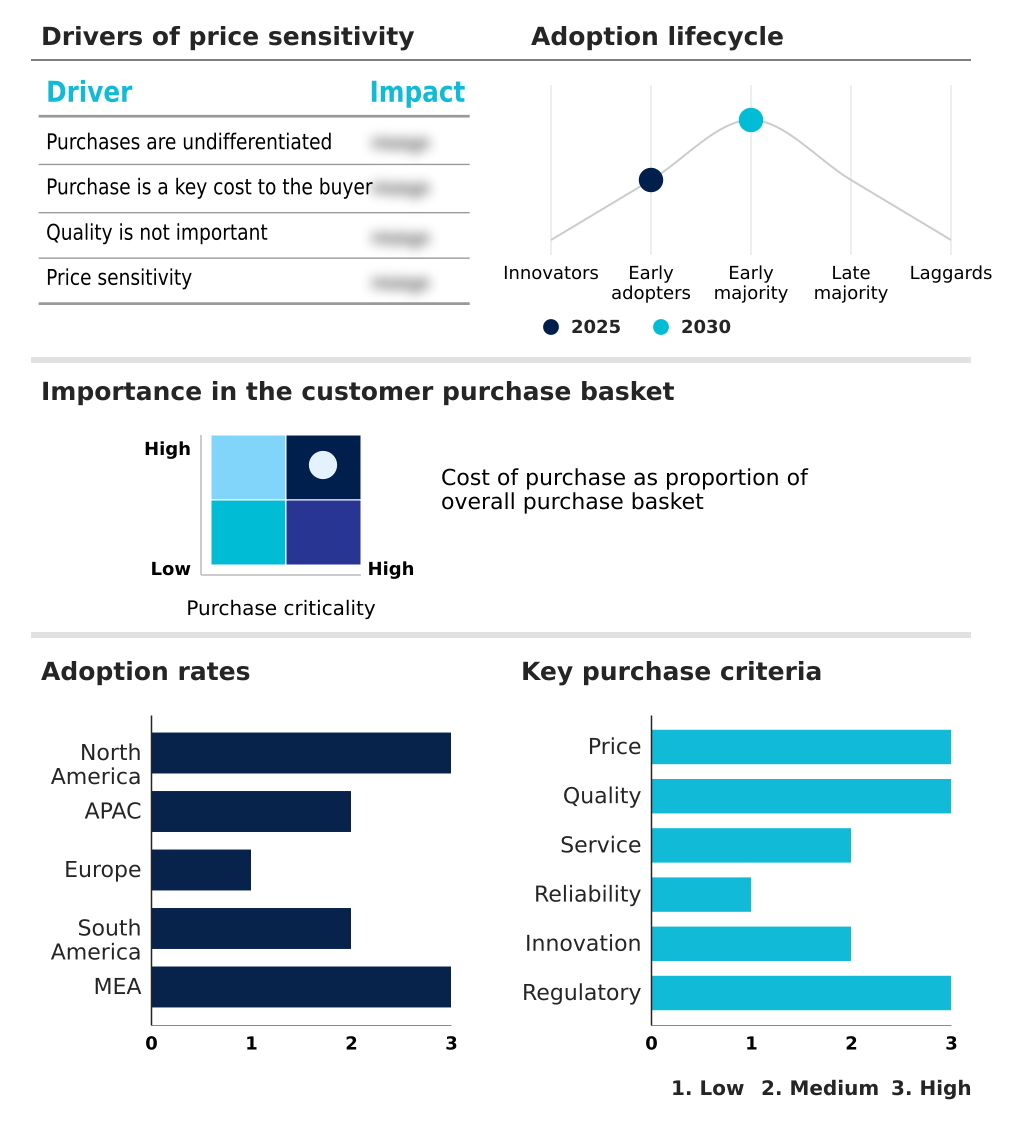
The cloud storage services market forecasting report includes the adoption lifecycle of the market, covering from the innovator’s stage to the laggard’s stage. It focuses on adoption rates in different regions based on penetration. Furthermore, the cloud storage services market report also includes key purchase criteria and drivers of price sensitivity to help companies evaluate and develop their market growth analysis strategies.

Customer Landscape of Cloud Storage Services Industry

Competitive Landscape

Companies are implementing various strategies, such as strategic alliances, cloud storage services market forecast, partnerships, mergers and acquisitions, geographical expansion, and product/service launches, to enhance their presence in the industry.

Akamai Technologies Inc. - The company offers cloud storage services such as object storage and edge-based storage through its cloud infrastructure platform.

The industry research and growth report includes detailed analyses of the competitive landscape of the market and information about key companies, including:

  • Akamai Technologies Inc.
  • Alibaba Cloud
  • Amazon Web Services Inc.
  • Apple Inc.
  • Box Inc.
  • DigitalOcean Holdings Inc.
  • Dropbox Inc.
  • Google LLC
  • IBM Corp.
  • Microsoft Corp.
  • NetApp Inc.
  • Oracle Corp.
  • OVH Groupe SA
  • pCloud International AG
  • Proton AG
  • Pure Storage Inc.
  • Rackspace Technology Inc.
  • Tencent Holdings Ltd.
  • Tresorit AG
  • Wasabi Holding Co. Inc.

Qualitative and quantitative analysis of companies has been conducted to help clients understand the wider business environment as well as the strengths and weaknesses of key industry players. Data is qualitatively analyzed to categorize companies as pure play, category-focused, industry-focused, and diversified; it is quantitatively analyzed to categorize companies as dominant, leading, strong, tentative, and weak.

Recent Development and News in Cloud storage services market

  • In October 2024, Microsoft Corp. announced significant enhancements to its OneDrive consumer and enterprise cloud storage service, introducing a redesigned, photos-first mobile interface with enhanced editing capabilities and a new natural language search feature powered by Copilot AI.
  • In November 2024, Box Inc. announced at its annual BoxWorks customer conference a comprehensive set of AI-powered innovations centered on transforming how enterprise organizations manage unstructured data, including the introduction of Box AI Studio, Box Apps, and a new Enterprise Advanced subscription plan.
  • In February 2025, Wasabi Holding Co. Inc. published its 2025 Global Cloud Storage Index, a survey of 1,600 IT decision-makers across organizations with more than 100 employees globally.
  • In April 2025, Box Inc. announced at Google Cloud Next 2025 a deepened partnership with Google Cloud, enabling AI-powered metadata extraction for enterprise content stored in Box by leveraging Google's Gemini 2.0 Flash model.

Dive into Technavio’s robust research methodology, blending expert interviews, extensive data synthesis, and validated models for unparalleled Cloud Storage Services Market insights. See full methodology.

Market Scope
Page number 312
Base year 2025
Historic period 2020-2024
Forecast period 2026-2030
Growth momentum & CAGR Accelerate at a CAGR of 25.5%
Market growth 2026-2030 USD 259472.2 million
Market structure Fragmented
YoY growth 2025-2026(%) 22.1%
Key countries US, Canada, Mexico, China, Japan, India, South Korea, Australia, Indonesia, Germany, UK, France, Italy, Spain, The Netherlands, Brazil, Argentina, Chile, Saudi Arabia, UAE, South Africa, Israel and Turkey
Competitive landscape Leading Companies, Market Positioning of Companies, Competitive Strategies, and Industry Risks

Request Free Sample

Research Analyst Overview

  • The market is undergoing a significant architectural transformation, driven by the dual pressures of AI integration and complex data sovereignty requirements. The traditional model of passive, archival storage is being supplanted by active, intelligent data repositories designed for high-velocity processing and autonomous management.
  • This shift necessitates a move toward AI-native storage architectures that embed capabilities like vector databases and automated data tiering directly into the infrastructure. Boardroom decisions now center on whether to invest in these advanced, purpose-built systems or attempt to retrofit legacy environments, a choice with long-term strategic implications.
  • Implementing AI-optimized storage has demonstrated tangible performance gains, with some configurations reducing data model training times by over 30%. This evolution demands a sophisticated approach to hybrid and multi-cloud orchestration, where data mobility, security, and compliance are managed seamlessly across a distributed and increasingly complex digital estate, challenging enterprises to rethink their core data strategies.

What are the Key Data Covered in this Cloud Storage Services Market Research and Growth Report?

  • What is the expected growth of the Cloud Storage Services Market between 2026 and 2030?

    • USD 259.47 billion, at a CAGR of 25.5%

  • What segmentation does the market report cover?

    • The report is segmented by Component (Solutions, and Services), Type (Public, Private, and Hybrid), End-user (IT and telecom, BFSI, Government and public sector, Healthcare, and Others) and Geography (North America, APAC, Europe, South America, Middle East and Africa)

  • Which regions are analyzed in the report?

    • North America, APAC, Europe, South America and Middle East and Africa

  • What are the key growth drivers and market challenges?

    • Proliferation of AI and ML workloads, Persistent complexity of data egress fees and company lock-in

  • Who are the major players in the Cloud Storage Services Market?

    • Akamai Technologies Inc., Alibaba Cloud, Amazon Web Services Inc., Apple Inc., Box Inc., DigitalOcean Holdings Inc., Dropbox Inc., Google LLC, IBM Corp., Microsoft Corp., NetApp Inc., Oracle Corp., OVH Groupe SA, pCloud International AG, Proton AG, Pure Storage Inc., Rackspace Technology Inc., Tencent Holdings Ltd., Tresorit AG and Wasabi Holding Co. Inc.

Market Research Insights

  • The market's dynamics are shaped by a strategic pivot toward architectures that enhance operational resilience and cost efficiency. The widespread adoption of multi-cloud data mobility allows enterprises to mitigate the risks of vendor dependency, a significant concern for 94% of IT leaders who cite company lock-in as a primary operational anxiety.
  • This shift is supported by robust data governance frameworks that ensure compliance across various platforms. As organizations adopt AI-native workflows, the emphasis on high-performance object storage grows, with implementations demonstrating up to 40% reductions in data retrieval latency.
  • These advancements in cloud data lifecycle management are critical for optimizing both performance and expenditure, enabling businesses to align their storage strategies with evolving technological and economic demands.

We can help! Our analysts can customize this cloud storage services market research report to meet your requirements.

Get in touch

1. Executive Summary

1.1 Market overview

Executive Summary - Chart on Market Overview
Executive Summary - Data Table on Market Overview
Executive Summary - Chart on Global Market Characteristics
Executive Summary - Chart on Market by Geography
Executive Summary - Chart on Market Segmentation by Component
Executive Summary - Chart on Market Segmentation by Type
Executive Summary - Chart on Market Segmentation by End-user
Executive Summary - Chart on Incremental Growth
Executive Summary - Data Table on Incremental Growth
Executive Summary - Chart on Company Market Positioning

2. Technavio Analysis

2.1 Analysis of price sensitivity, lifecycle, customer purchase basket, adoption rates, and purchase criteria

2.2 Criticality of inputs and Factors of differentiation

Chart on Overview on criticality of inputs and factors of differentiation

2.3 Factors of disruption

Chart on Overview on factors of disruption

2.4 Impact of drivers and challenges

Chart on Impact of drivers and challenges in 2025 and 2030

3. Market Landscape

3.1 Market ecosystem

Chart on Parent Market
Data Table on - Parent Market

3.2 Market characteristics

Chart on Market characteristics analysis

3.3 Value chain analysis

Chart on Value chain analysis

4. Market Sizing

4.1 Market definition

Data Table on Offerings of companies included in the market definition

4.2 Market segment analysis

Market segments

4.3 Market size 2025

4.4 Market outlook: Forecast for 2025-2030

Chart on Global - Market size and forecast 2025-2030 ($ million)
Data Table on Global - Market size and forecast 2025-2030 ($ million)
Chart on Global Market: Year-over-year growth 2025-2030 (%)
Data Table on Global Market: Year-over-year growth 2025-2030 (%)

5. Historic Market Size

5.1 Global Cloud Storage Services Market 2020 - 2024

Historic Market Size - Data Table on Global Cloud Storage Services Market 2020 - 2024 ($ million)

5.2 Component segment analysis 2020 - 2024

Historic Market Size - Component Segment 2020 - 2024 ($ million)

5.3 Type segment analysis 2020 - 2024

Historic Market Size - Type Segment 2020 - 2024 ($ million)

5.4 End-user segment analysis 2020 - 2024

Historic Market Size - End-user Segment 2020 - 2024 ($ million)

5.5 Geography segment analysis 2020 - 2024

Historic Market Size - Geography Segment 2020 - 2024 ($ million)

5.6 Country segment analysis 2020 - 2024

Historic Market Size - Country Segment 2020 - 2024 ($ million)

6. Qualitative Analysis

6.1 Impact of AI on global cloud storage services market

6.2 Impact of geopolitical conflict on global cloud storage services market

7. Five Forces Analysis

7.1 Five forces summary

Five forces analysis - Comparison between 2025 and 2030

7.2 Bargaining power of buyers

Bargaining power of buyers - Impact of key factors 2025 and 2030

7.3 Bargaining power of suppliers

Bargaining power of suppliers - Impact of key factors in 2025 and 2030

7.4 Threat of new entrants

Threat of new entrants - Impact of key factors in 2025 and 2030

7.5 Threat of substitutes

Threat of substitutes - Impact of key factors in 2025 and 2030

7.6 Threat of rivalry

Threat of rivalry - Impact of key factors in 2025 and 2030

7.7 Market condition

Chart on Market condition - Five forces 2025 and 2030

8. Market Segmentation by Component

8.1 Market segments

Chart on Component - Market share 2025-2030 (%)
Data Table on Component - Market share 2025-2030 (%)

8.2 Comparison by Component

Chart on Comparison by Component
Data Table on Comparison by Component

8.3 Solutions - Market size and forecast 2025-2030

Chart on Solutions - Market size and forecast 2025-2030 ($ million)
Data Table on Solutions - Market size and forecast 2025-2030 ($ million)
Chart on Solutions - Year-over-year growth 2025-2030 (%)
Data Table on Solutions - Year-over-year growth 2025-2030 (%)

8.4 Services - Market size and forecast 2025-2030

Chart on Services - Market size and forecast 2025-2030 ($ million)
Data Table on Services - Market size and forecast 2025-2030 ($ million)
Chart on Services - Year-over-year growth 2025-2030 (%)
Data Table on Services - Year-over-year growth 2025-2030 (%)

8.5 Market opportunity by Component

Market opportunity by Component ($ million)
Data Table on Market opportunity by Component ($ million)

9. Market Segmentation by Type

9.1 Market segments

Chart on Type - Market share 2025-2030 (%)
Data Table on Type - Market share 2025-2030 (%)

9.2 Comparison by Type

Chart on Comparison by Type
Data Table on Comparison by Type

9.3 Public - Market size and forecast 2025-2030

Chart on Public - Market size and forecast 2025-2030 ($ million)
Data Table on Public - Market size and forecast 2025-2030 ($ million)
Chart on Public - Year-over-year growth 2025-2030 (%)
Data Table on Public - Year-over-year growth 2025-2030 (%)

9.4 Private - Market size and forecast 2025-2030

Chart on Private - Market size and forecast 2025-2030 ($ million)
Data Table on Private - Market size and forecast 2025-2030 ($ million)
Chart on Private - Year-over-year growth 2025-2030 (%)
Data Table on Private - Year-over-year growth 2025-2030 (%)

9.5 Hybrid - Market size and forecast 2025-2030

Chart on Hybrid - Market size and forecast 2025-2030 ($ million)
Data Table on Hybrid - Market size and forecast 2025-2030 ($ million)
Chart on Hybrid - Year-over-year growth 2025-2030 (%)
Data Table on Hybrid - Year-over-year growth 2025-2030 (%)

9.6 Market opportunity by Type

Market opportunity by Type ($ million)
Data Table on Market opportunity by Type ($ million)

10. Market Segmentation by End-user

10.1 Market segments

Chart on End-user - Market share 2025-2030 (%)
Data Table on End-user - Market share 2025-2030 (%)

10.2 Comparison by End-user

Chart on Comparison by End-user
Data Table on Comparison by End-user

10.3 IT and telecom - Market size and forecast 2025-2030

Chart on IT and telecom - Market size and forecast 2025-2030 ($ million)
Data Table on IT and telecom - Market size and forecast 2025-2030 ($ million)
Chart on IT and telecom - Year-over-year growth 2025-2030 (%)
Data Table on IT and telecom - Year-over-year growth 2025-2030 (%)

10.4 BFSI - Market size and forecast 2025-2030

Chart on BFSI - Market size and forecast 2025-2030 ($ million)
Data Table on BFSI - Market size and forecast 2025-2030 ($ million)
Chart on BFSI - Year-over-year growth 2025-2030 (%)
Data Table on BFSI - Year-over-year growth 2025-2030 (%)

10.5 Government and public sector - Market size and forecast 2025-2030

Chart on Government and public sector - Market size and forecast 2025-2030 ($ million)
Data Table on Government and public sector - Market size and forecast 2025-2030 ($ million)
Chart on Government and public sector - Year-over-year growth 2025-2030 (%)
Data Table on Government and public sector - Year-over-year growth 2025-2030 (%)

10.6 Healthcare - Market size and forecast 2025-2030

Chart on Healthcare - Market size and forecast 2025-2030 ($ million)
Data Table on Healthcare - Market size and forecast 2025-2030 ($ million)
Chart on Healthcare - Year-over-year growth 2025-2030 (%)
Data Table on Healthcare - Year-over-year growth 2025-2030 (%)

10.7 Others - Market size and forecast 2025-2030

Chart on Others - Market size and forecast 2025-2030 ($ million)
Data Table on Others - Market size and forecast 2025-2030 ($ million)
Chart on Others - Year-over-year growth 2025-2030 (%)
Data Table on Others - Year-over-year growth 2025-2030 (%)

10.8 Market opportunity by End-user

Market opportunity by End-user ($ million)
Data Table on Market opportunity by End-user ($ million)

11. Customer Landscape

11.1 Customer landscape overview

Analysis of price sensitivity, lifecycle, customer purchase basket, adoption rates, and purchase criteria

12. Geographic Landscape

12.1 Geographic segmentation

Chart on Market share by geography 2025-2030 (%)
Data Table on Market share by geography 2025-2030 (%)

12.2 Geographic comparison

Chart on Geographic comparison
Data Table on Geographic comparison

12.3 North America - Market size and forecast 2025-2030

Chart on North America - Market size and forecast 2025-2030 ($ million)
Data Table on North America - Market size and forecast 2025-2030 ($ million)
Chart on North America - Year-over-year growth 2025-2030 (%)
Data Table on North America - Year-over-year growth 2025-2030 (%)
Chart on Regional Comparison - North America
Data Table on Regional Comparison - North America

12.3.1 US - Market size and forecast 2025-2030

Chart on US - Market size and forecast 2025-2030 ($ million)
Data Table on US - Market size and forecast 2025-2030 ($ million)
Chart on US - Year-over-year growth 2025-2030 (%)
Data Table on US - Year-over-year growth 2025-2030 (%)

12.3.2 Canada - Market size and forecast 2025-2030

Chart on Canada - Market size and forecast 2025-2030 ($ million)
Data Table on Canada - Market size and forecast 2025-2030 ($ million)
Chart on Canada - Year-over-year growth 2025-2030 (%)
Data Table on Canada - Year-over-year growth 2025-2030 (%)

12.3.3 Mexico - Market size and forecast 2025-2030

Chart on Mexico - Market size and forecast 2025-2030 ($ million)
Data Table on Mexico - Market size and forecast 2025-2030 ($ million)
Chart on Mexico - Year-over-year growth 2025-2030 (%)
Data Table on Mexico - Year-over-year growth 2025-2030 (%)

12.4 APAC - Market size and forecast 2025-2030

Chart on APAC - Market size and forecast 2025-2030 ($ million)
Data Table on APAC - Market size and forecast 2025-2030 ($ million)
Chart on APAC - Year-over-year growth 2025-2030 (%)
Data Table on APAC - Year-over-year growth 2025-2030 (%)
Chart on Regional Comparison - APAC
Data Table on Regional Comparison - APAC

12.4.1 China - Market size and forecast 2025-2030

Chart on China - Market size and forecast 2025-2030 ($ million)
Data Table on China - Market size and forecast 2025-2030 ($ million)
Chart on China - Year-over-year growth 2025-2030 (%)
Data Table on China - Year-over-year growth 2025-2030 (%)

12.4.2 Japan - Market size and forecast 2025-2030

Chart on Japan - Market size and forecast 2025-2030 ($ million)
Data Table on Japan - Market size and forecast 2025-2030 ($ million)
Chart on Japan - Year-over-year growth 2025-2030 (%)
Data Table on Japan - Year-over-year growth 2025-2030 (%)

12.4.3 India - Market size and forecast 2025-2030

Chart on India - Market size and forecast 2025-2030 ($ million)
Data Table on India - Market size and forecast 2025-2030 ($ million)
Chart on India - Year-over-year growth 2025-2030 (%)
Data Table on India - Year-over-year growth 2025-2030 (%)

12.4.4 South Korea - Market size and forecast 2025-2030

Chart on South Korea - Market size and forecast 2025-2030 ($ million)
Data Table on South Korea - Market size and forecast 2025-2030 ($ million)
Chart on South Korea - Year-over-year growth 2025-2030 (%)
Data Table on South Korea - Year-over-year growth 2025-2030 (%)

12.4.5 Australia - Market size and forecast 2025-2030

Chart on Australia - Market size and forecast 2025-2030 ($ million)
Data Table on Australia - Market size and forecast 2025-2030 ($ million)
Chart on Australia - Year-over-year growth 2025-2030 (%)
Data Table on Australia - Year-over-year growth 2025-2030 (%)

12.4.6 Indonesia - Market size and forecast 2025-2030

Chart on Indonesia - Market size and forecast 2025-2030 ($ million)
Data Table on Indonesia - Market size and forecast 2025-2030 ($ million)
Chart on Indonesia - Year-over-year growth 2025-2030 (%)
Data Table on Indonesia - Year-over-year growth 2025-2030 (%)

12.5 Europe - Market size and forecast 2025-2030

Chart on Europe - Market size and forecast 2025-2030 ($ million)
Data Table on Europe - Market size and forecast 2025-2030 ($ million)
Chart on Europe - Year-over-year growth 2025-2030 (%)
Data Table on Europe - Year-over-year growth 2025-2030 (%)
Chart on Regional Comparison - Europe
Data Table on Regional Comparison - Europe

12.5.1 Germany - Market size and forecast 2025-2030

Chart on Germany - Market size and forecast 2025-2030 ($ million)
Data Table on Germany - Market size and forecast 2025-2030 ($ million)
Chart on Germany - Year-over-year growth 2025-2030 (%)
Data Table on Germany - Year-over-year growth 2025-2030 (%)

12.5.2 UK - Market size and forecast 2025-2030

Chart on UK - Market size and forecast 2025-2030 ($ million)
Data Table on UK - Market size and forecast 2025-2030 ($ million)
Chart on UK - Year-over-year growth 2025-2030 (%)
Data Table on UK - Year-over-year growth 2025-2030 (%)

12.5.3 France - Market size and forecast 2025-2030

Chart on France - Market size and forecast 2025-2030 ($ million)
Data Table on France - Market size and forecast 2025-2030 ($ million)
Chart on France - Year-over-year growth 2025-2030 (%)
Data Table on France - Year-over-year growth 2025-2030 (%)

12.5.4 Italy - Market size and forecast 2025-2030

Chart on Italy - Market size and forecast 2025-2030 ($ million)
Data Table on Italy - Market size and forecast 2025-2030 ($ million)
Chart on Italy - Year-over-year growth 2025-2030 (%)
Data Table on Italy - Year-over-year growth 2025-2030 (%)

12.5.5 Spain - Market size and forecast 2025-2030

Chart on Spain - Market size and forecast 2025-2030 ($ million)
Data Table on Spain - Market size and forecast 2025-2030 ($ million)
Chart on Spain - Year-over-year growth 2025-2030 (%)
Data Table on Spain - Year-over-year growth 2025-2030 (%)

12.5.6 The Netherlands - Market size and forecast 2025-2030

Chart on The Netherlands - Market size and forecast 2025-2030 ($ million)
Data Table on The Netherlands - Market size and forecast 2025-2030 ($ million)
Chart on The Netherlands - Year-over-year growth 2025-2030 (%)
Data Table on The Netherlands - Year-over-year growth 2025-2030 (%)

12.6 South America - Market size and forecast 2025-2030

Chart on South America - Market size and forecast 2025-2030 ($ million)
Data Table on South America - Market size and forecast 2025-2030 ($ million)
Chart on South America - Year-over-year growth 2025-2030 (%)
Data Table on South America - Year-over-year growth 2025-2030 (%)
Chart on Regional Comparison - South America
Data Table on Regional Comparison - South America

12.6.1 Brazil - Market size and forecast 2025-2030

Chart on Brazil - Market size and forecast 2025-2030 ($ million)
Data Table on Brazil - Market size and forecast 2025-2030 ($ million)
Chart on Brazil - Year-over-year growth 2025-2030 (%)
Data Table on Brazil - Year-over-year growth 2025-2030 (%)

12.6.2 Argentina - Market size and forecast 2025-2030

Chart on Argentina - Market size and forecast 2025-2030 ($ million)
Data Table on Argentina - Market size and forecast 2025-2030 ($ million)
Chart on Argentina - Year-over-year growth 2025-2030 (%)
Data Table on Argentina - Year-over-year growth 2025-2030 (%)

12.6.3 Chile - Market size and forecast 2025-2030

Chart on Chile - Market size and forecast 2025-2030 ($ million)
Data Table on Chile - Market size and forecast 2025-2030 ($ million)
Chart on Chile - Year-over-year growth 2025-2030 (%)
Data Table on Chile - Year-over-year growth 2025-2030 (%)

12.7 Middle East and Africa - Market size and forecast 2025-2030

Chart on Middle East and Africa - Market size and forecast 2025-2030 ($ million)
Data Table on Middle East and Africa - Market size and forecast 2025-2030 ($ million)
Chart on Middle East and Africa - Year-over-year growth 2025-2030 (%)
Data Table on Middle East and Africa - Year-over-year growth 2025-2030 (%)
Chart on Regional Comparison - Middle East and Africa
Data Table on Regional Comparison - Middle East and Africa

12.7.1 Saudi Arabia - Market size and forecast 2025-2030

Chart on Saudi Arabia - Market size and forecast 2025-2030 ($ million)
Data Table on Saudi Arabia - Market size and forecast 2025-2030 ($ million)
Chart on Saudi Arabia - Year-over-year growth 2025-2030 (%)
Data Table on Saudi Arabia - Year-over-year growth 2025-2030 (%)

12.7.2 UAE - Market size and forecast 2025-2030

Chart on UAE - Market size and forecast 2025-2030 ($ million)
Data Table on UAE - Market size and forecast 2025-2030 ($ million)
Chart on UAE - Year-over-year growth 2025-2030 (%)
Data Table on UAE - Year-over-year growth 2025-2030 (%)

12.7.3 South Africa - Market size and forecast 2025-2030

Chart on South Africa - Market size and forecast 2025-2030 ($ million)
Data Table on South Africa - Market size and forecast 2025-2030 ($ million)
Chart on South Africa - Year-over-year growth 2025-2030 (%)
Data Table on South Africa - Year-over-year growth 2025-2030 (%)

12.7.4 Israel - Market size and forecast 2025-2030

Chart on Israel - Market size and forecast 2025-2030 ($ million)
Data Table on Israel - Market size and forecast 2025-2030 ($ million)
Chart on Israel - Year-over-year growth 2025-2030 (%)
Data Table on Israel - Year-over-year growth 2025-2030 (%)

12.7.5 Turkey - Market size and forecast 2025-2030

Chart on Turkey - Market size and forecast 2025-2030 ($ million)
Data Table on Turkey - Market size and forecast 2025-2030 ($ million)
Chart on Turkey - Year-over-year growth 2025-2030 (%)
Data Table on Turkey - Year-over-year growth 2025-2030 (%)

12.8 Market opportunity by geography

Market opportunity by geography ($ million)
Data Tables on Market opportunity by geography ($ million)

13. Drivers, Challenges, and Opportunity

13.1 Market drivers

Proliferation of AI and ML workloads
Escalating demand for data security and regulatory compliance
Global shift toward hybrid and multi-cloud architectures

13.2 Market challenges

Persistent complexity of data egress fees and company lock-in
Escalating cybersecurity threats and identity mismanagement
Navigating divergent global data sovereignty and compliance mandates

13.3 Impact of drivers and challenges

Impact of drivers and challenges in 2025 and 2030

13.4 Market opportunities

Integration of generative AI and autonomous storage management
Emergence of distributed edge storage and decentralized architectures
Prioritization of digital sovereignty and green storage initiatives

14. Competitive Landscape

14.1 Overview

14.2

Overview on criticality of inputs and factors of differentiation

14.3 Landscape disruption

Overview on factors of disruption

14.4 Industry risks

Impact of key risks on business

15. Competitive Analysis

15.1 Companies profiled

Companies covered

15.2 Company ranking index

15.3 Market positioning of companies

Matrix on companies position and classification

15.4 Akamai Technologies Inc.

Akamai Technologies Inc. - Overview
Akamai Technologies Inc. - Business segments
Akamai Technologies Inc. - Key news
Akamai Technologies Inc. - Key offerings
Akamai Technologies Inc. - Segment focus
SWOT

15.5 Alibaba Cloud

Alibaba Cloud - Overview
Alibaba Cloud - Product / Service
Alibaba Cloud - Key offerings
SWOT

15.6 Amazon Web Services Inc.

Amazon Web Services Inc. - Overview
Amazon Web Services Inc. - Product / Service
Amazon Web Services Inc. - Key offerings
SWOT

15.7 Apple Inc.

Apple Inc. - Overview
Apple Inc. - Business segments
Apple Inc. - Key news
Apple Inc. - Key offerings
Apple Inc. - Segment focus
SWOT

15.8 Box Inc.

Box Inc. - Overview
Box Inc. - Product / Service
Box Inc. - Key offerings
SWOT

15.9 DigitalOcean Holdings Inc.

DigitalOcean Holdings Inc. - Overview
DigitalOcean Holdings Inc. - Business segments
DigitalOcean Holdings Inc. - Key offerings
DigitalOcean Holdings Inc. - Segment focus
SWOT

15.10 Dropbox Inc.

Dropbox Inc. - Overview
Dropbox Inc. - Product / Service
Dropbox Inc. - Key offerings
SWOT

15.11 Google LLC

Google LLC - Overview
Google LLC - Product / Service
Google LLC - Key offerings
SWOT

15.12 IBM Corp.

IBM Corp. - Overview
IBM Corp. - Business segments
IBM Corp. - Key news
IBM Corp. - Key offerings
IBM Corp. - Segment focus
SWOT

15.13 Microsoft Corp.

Microsoft Corp. - Overview
Microsoft Corp. - Business segments
Microsoft Corp. - Key news
Microsoft Corp. - Key offerings
Microsoft Corp. - Segment focus
SWOT

15.14 NetApp Inc.

NetApp Inc. - Overview
NetApp Inc. - Business segments
NetApp Inc. - Key news
NetApp Inc. - Key offerings
NetApp Inc. - Segment focus
SWOT

15.15 Oracle Corp.

Oracle Corp. - Overview
Oracle Corp. - Business segments
Oracle Corp. - Key news
Oracle Corp. - Key offerings
Oracle Corp. - Segment focus
SWOT

15.16 Pure Storage Inc.

Pure Storage Inc. - Overview
Pure Storage Inc. - Business segments
Pure Storage Inc. - Key offerings
Pure Storage Inc. - Segment focus
SWOT

15.17 Rackspace Technology Inc.

Rackspace Technology Inc. - Overview
Rackspace Technology Inc. - Business segments
Rackspace Technology Inc. - Key news
Rackspace Technology Inc. - Key offerings
Rackspace Technology Inc. - Segment focus
SWOT

15.18 Tencent Holdings Ltd.

Tencent Holdings Ltd. - Overview
Tencent Holdings Ltd. - Business segments
Tencent Holdings Ltd. - Key offerings
Tencent Holdings Ltd. - Segment focus
SWOT

16. Appendix

16.1 Scope of the report

Market definition
Objectives
Notes and caveats

16.2 Inclusions and exclusions checklist

Inclusions checklist
Exclusions checklist

16.3 Currency conversion rates for US$

16.4 Research methodology

16.5 Data procurement

Information sources

16.6 Data validation

16.7 Validation techniques employed for market sizing

16.8 Data synthesis

16.9 360 degree market analysis

16.10 List of abbreviations

Research Methodology

Technavio presents a detailed picture of the market by way of study, synthesis, and summation of data from multiple sources. The analysts have presented the various facets of the market with a particular focus on identifying the key industry influencers. The data thus presented is comprehensive, reliable, and the result of extensive research, both primary and secondary.

INFORMATION SOURCES

Primary sources

  • Manufacturers and suppliers
  • Channel partners
  • Industry experts
  • Strategic decision makers

Secondary sources

  • Industry journals and periodicals
  • Government data
  • Financial reports of key industry players
  • Historical data
  • Press releases

DATA ANALYSIS

Data Synthesis

  • Collation of data
  • Estimation of key figures
  • Analysis of derived insights

Data Validation

  • Triangulation with data models
  • Reference against proprietary databases
  • Corroboration with industry experts

REPORT WRITING

Qualitative

  • Market drivers
  • Market challenges
  • Market trends
  • Five forces analysis

Quantitative

  • Market size and forecast
  • Market segmentation
  • Geographical insights
  • Competitive landscape

Interested in this report?

Get your sample now to see our research methodology and insights!

Download Now

Frequently Asked Questions

Cloud Storage Services market growth will increase by USD 259472.2 million during 2026-2030.

The Cloud Storage Services market is expected to grow at a CAGR of 25.5% during 2026-2030.

Cloud Storage Services market is segmented by Component (Solutions, Services) Type (Public, Private, Hybrid) End-user (IT and telecom, BFSI, Government and public sector, Healthcare, Others)

Akamai Technologies Inc., Alibaba Cloud, Amazon Web Services Inc., Apple Inc., Box Inc., DigitalOcean Holdings Inc., Dropbox Inc., Google LLC, IBM Corp., Microsoft Corp., NetApp Inc., Oracle Corp., OVH Groupe SA, pCloud International AG, Proton AG, Pure Storage Inc., Rackspace Technology Inc., Tencent Holdings Ltd., Tresorit AG, Wasabi Holding Co. Inc. are a few of the key vendors in the Cloud Storage Services market.

North America will register the highest growth rate of 41.1% among the other regions. Therefore, the Cloud Storage Services market in North America is expected to garner significant business opportunities for the vendors during the forecast period.

US, Canada, Mexico, China, Japan, India, South Korea, Australia, Indonesia, Germany, UK, France, Italy, Spain, The Netherlands, Brazil, Argentina, Chile, Saudi Arabia, UAE, South Africa, Israel, Turkey

  • Proliferation of AI and ML workloads is the driving factor this market.

The Cloud Storage Services market vendors should focus on grabbing business opportunities from the Component segment as it accounted for the largest market share in the base year.
RIA - Research AI Assistant
Ask RIA