
Ai-optimized Storage Market Size 2026-2030
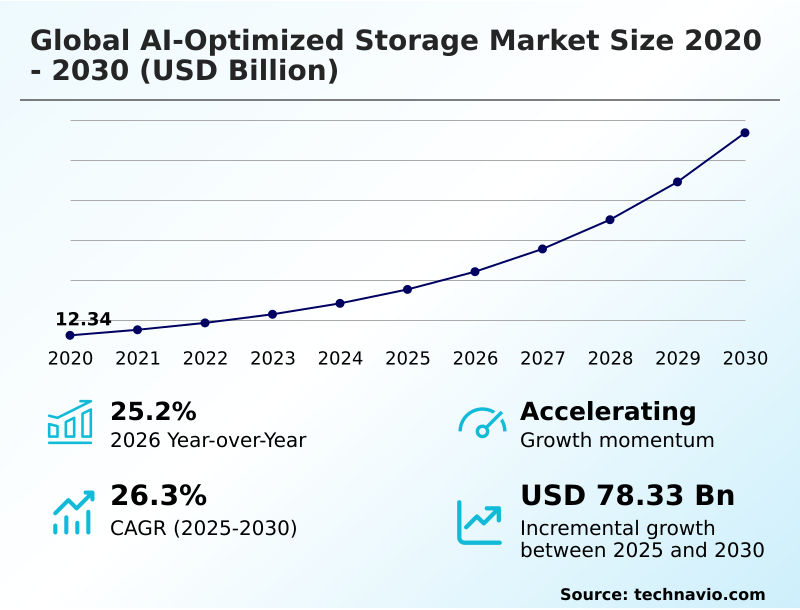
The Ai-optimized Storage Market size was valued at USD 35.29 billion in 2025, growing at a CAGR of 26.3% during the forecast period 2026-2030.
Major Market Trends & Insights
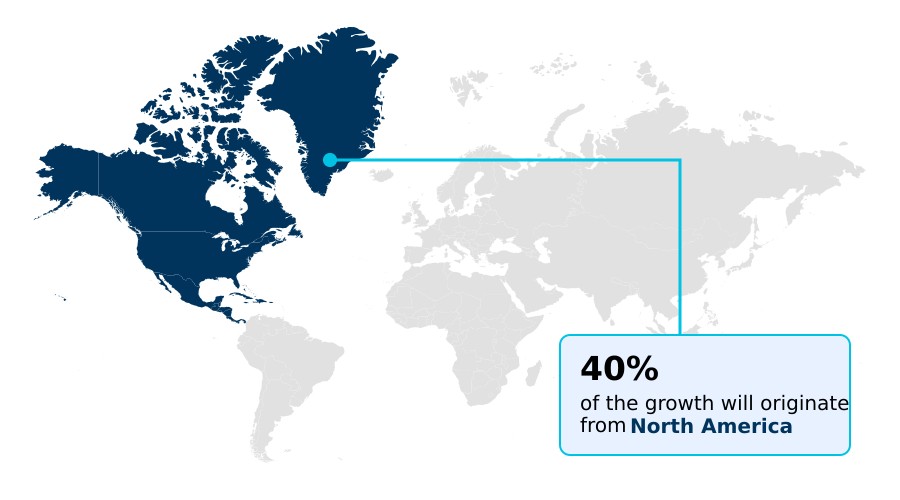
- North America dominated the market and accounted for a 39.9% growth during the forecast period.
- By Product - Direct attached storage segment was valued at USD 12.56 billion in 2024
- By Type - Enterprises segment accounted for the largest market revenue share in 2024
Market Size & Forecast
- Historic Market Opportunities 2020-2024: USD 101.28 billion
- Market Future Opportunities 2025-2030: USD 78.33 billion
- CAGR from 2025 to 2030 : 26.3%
Market Summary
- The ai-optimized storage market is defined by infrastructure engineered to enhance data systems by integrating AI, with some solutions improving data retrieval speeds by up to 50%. These advanced systems autonomously analyze data access patterns to automate management functions like data placement and security, reducing operational overhead by over 30%.
- For instance, in healthcare, a hospital network leverages this technology to manage radiological images, enabling automated diagnostic tools to access petabytes of data with minimal latency. A primary driver is the exponential growth of data from AI workloads, which traditional storage cannot handle efficiently.
- However, a significant challenge is ensuring robust data governance and compliance with regulations like GDPR, as the volume and complexity of data being managed by these intelligent systems continues to grow, requiring advanced encryption and access controls.
What will be the Size of the Ai-optimized Storage Market during the forecast period?
Get Key Insights on Market Forecast (PDF) Request Free Sample
How is the Ai-optimized Storage Market Segmented?
The ai-optimized storage industry research report provides comprehensive data (region-wise segment analysis), with forecasts and analysis for the period 2026-2030, as well as historical data from 2020-2024 for the following segments.
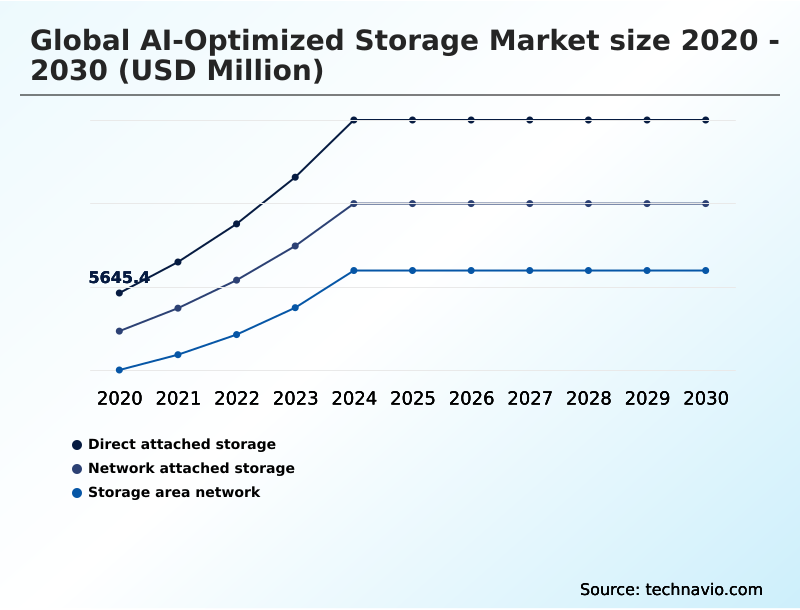
- Product
- Direct attached storage
- Network attached storage
- Storage area network
- Type
- Enterprises
- Cloud service providers
- Telecom companies
- End-user
- File-based
- Object-based
- Geography
- North America
- US
- Canada
- Mexico
- APAC
- China
- Japan
- India
- Europe
- Germany
- UK
- France
- Middle East and Africa
- Saudi Arabia
- UAE
- South Africa
- South America
- Brazil
- Argentina
- Rest of World (ROW)
- North America
How is the Ai-optimized Storage Market Segmented by Product?
The direct attached storage segment is estimated to witness significant growth during the forecast period.
The direct attached storage segment delivers the lowest latency for intensive AI model training, with performance gains of up to 40% over networked alternatives.
This configuration, where storage media connects directly to the server, is essential for saturating high-performance accelerators and preventing compute starvation, which can increase model development costs by over 25%.
Organizations utilize localized NVMe drives within GPU nodes to handle the high-frequency I/O operations of deep learning. While this parallel file system model's scalability is limited, it provides unmatched performance for localized edge intelligence and high-stakes research.
The focus on computational storage and thermal management for these internal drives is further enhancing the value of this segment by reducing the load on the main processor and preventing performance throttling, making it a cornerstone for private AI environments and data fabric.
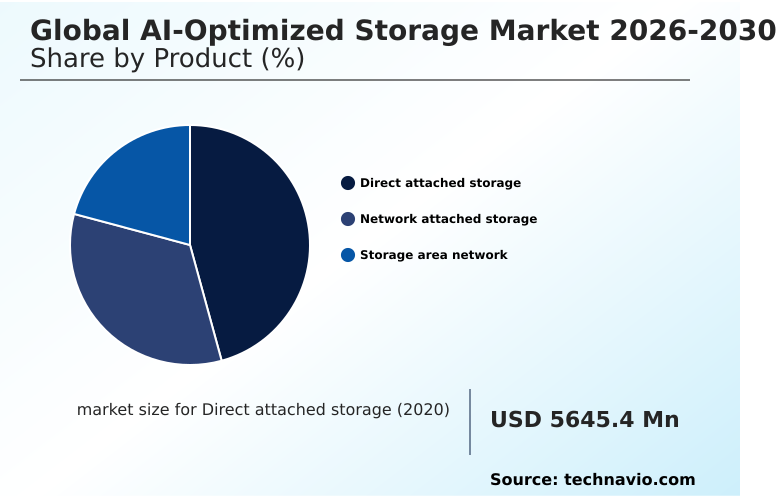
The Direct attached storage segment was valued at USD 12.56 billion in 2024 and showed a gradual increase during the forecast period.
How demand for the Ai-optimized Storage market is rising in the leading region?
North America is estimated to contribute 39.9% to the growth of the global market during the forecast period.Technavio’s analysts have elaborately explained the regional trends and drivers that shape the market during the forecast period.
See How Ai-optimized Storage Market demand is rising in North America Request Free Sample
North America dominates the global ai-optimized storage market, accounting for 39.9% of the market, a share that is 9.4% larger than APAC's.
This lead is driven by the high concentration of major cloud providers and advanced technology firms in the US, which itself commands over 60% of the regional market.
In contrast, the APAC region, while smaller, is projected to be the fastest-growing, fueled by rapid digitalization in countries like China and India.
The adoption difference is stark; North American enterprises focus on optimizing existing AI workloads with all-flash arrays and data fabric solutions for mature data sovereignty needs, whereas many APAC firms are in an earlier stage, prioritizing scalable cloud-based object storage and building out initial AI infrastructure.
This divergence impacts supply chains, with North America demanding validated, full-stack hardware bundles while APAC shows strong demand for more modular, cost-effective components for its parallel file system.
What are the key Drivers, Trends, and Challenges in the Ai-optimized Storage Market?
Our researchers analyzed the data with 2025 as the base year, along with the key drivers, trends, and challenges. A holistic analysis of drivers will help companies refine their marketing strategies to gain a competitive advantage.
- Enterprises evaluating high-performance storage for ai workloads are navigating a complex decision-making process, where initial procurement costs are weighed against long-term operational benefits. The debate over the best ai-optimized storage for large language models often centers on architectural choices, with some achieving a 40% better performance-to-cost ratio with a single-tier all-flash architecture compared to traditional tiered systems.
- Organizations are increasingly looking for ways of reducing tco with ai-optimized storage, leveraging features like intelligent data tiering and deduplication, which can lower storage footprints by over 50%. A crucial part of this strategy is implementing robust data governance in ai storage to comply with regulations without creating performance bottlenecks.
- For managing massive, unstructured datasets, scale-out nas for unstructured data provides a flexible and powerful solution. Ultimately, selecting the right high-performance storage for AI is not just about raw speed but about creating a cost-effective, compliant, and scalable foundation for future innovation.
What are the key market drivers leading to the rise in the adoption of Ai-optimized Storage Industry?
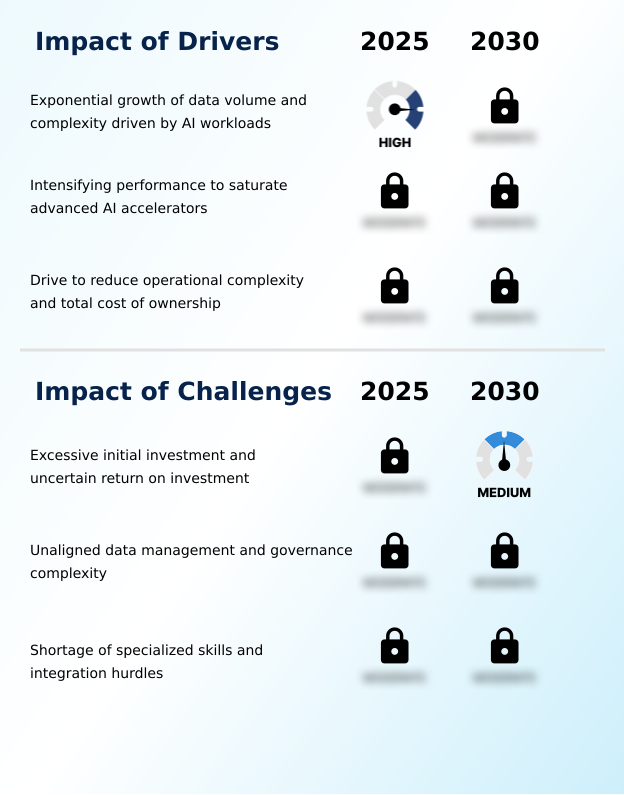
- The exponential growth of data volume and complexity, driven by demanding AI workloads, serves as the primary driver for the expansion of the AI-optimized storage market.
- The need to fully saturate advanced AI accelerators is a critical driver for the AI-optimized storage market, as compute efficiency plummets by over 70% when accelerators are idle.
- Traditional storage systems cannot supply data fast enough, creating a starvation event that significantly inflates model development costs and timelines.
- To prevent this bottleneck, organizations are aggressively adopting all-flash arrays and NVMe-oF protocols, which provide the massive bandwidth and parallel access needed for high-performance computing.
- These modern storage solutions can improve data throughput by more than 500% compared to legacy disk-based systems.
- This intense performance requirement necessitates a fundamental redesign of storage networks to accommodate the read-and-write loads of next-generation processors, making AI-optimized storage a mandatory component of any serious AI infrastructure investment.
What are the market trends shaping the Ai-optimized Storage Industry?
- The advent of full-stack, validated AI infrastructure is emerging as a significant market trend, aiming to streamline deployment and reduce time-to-market for large-scale intelligence projects.
- A dominant trend is the strategic shift toward AI data lakehouse architectures, which combine the low-cost scalability of data lakes with the structured management of data warehouses. This unified approach allows organizations to store and process raw, unstructured information alongside structured business records in a single high-performance storage pool, reducing data movement and associated latency by up to 60%.
- The adoption of this architecture is driven by the need to support multimodal AI applications that require diverse data types for training, improving model accuracy by over 15% in some use cases.
- By leveraging open file formats and advanced metadata layers, data lakehouses ensure data remains accessible and interoperable across different analytical tools, streamlining workflows for data scientists and supporting a more agile, cost-effective data strategy using software-defined storage.
What challenges does the Ai-optimized Storage Industry face during its growth?
- The excessive initial investment required for high-performance systems, coupled with an uncertain and often long-term return on investment, presents a significant challenge to market adoption.
- A shortage of specialized skills and significant integration hurdles present a critical challenge, with project delays attributed to these issues increasing by 40% in complex deployments.
- The global AI-optimized storage market demands a deep understanding of both storage physics and machine learning pipelines, a skill set that is in short supply, with demand outstripping supply by a ratio of 3:1 in some regions. This expertise gap often leads to improper system configuration, resulting in severe performance bottlenecks that negate the benefits of high-performance hardware.
- Furthermore, the lack of universal standards for high-speed data movement creates a fragmented environment where integrating solutions from different vendors requires significant custom coding and specialized middleware, increasing both cost and complexity. Without more intuitive management tools and standardized interfaces, building a resilient and interoperable storage ecosystem remains a major obstacle for many enterprises.
Exclusive Technavio Analysis on Customer Landscape
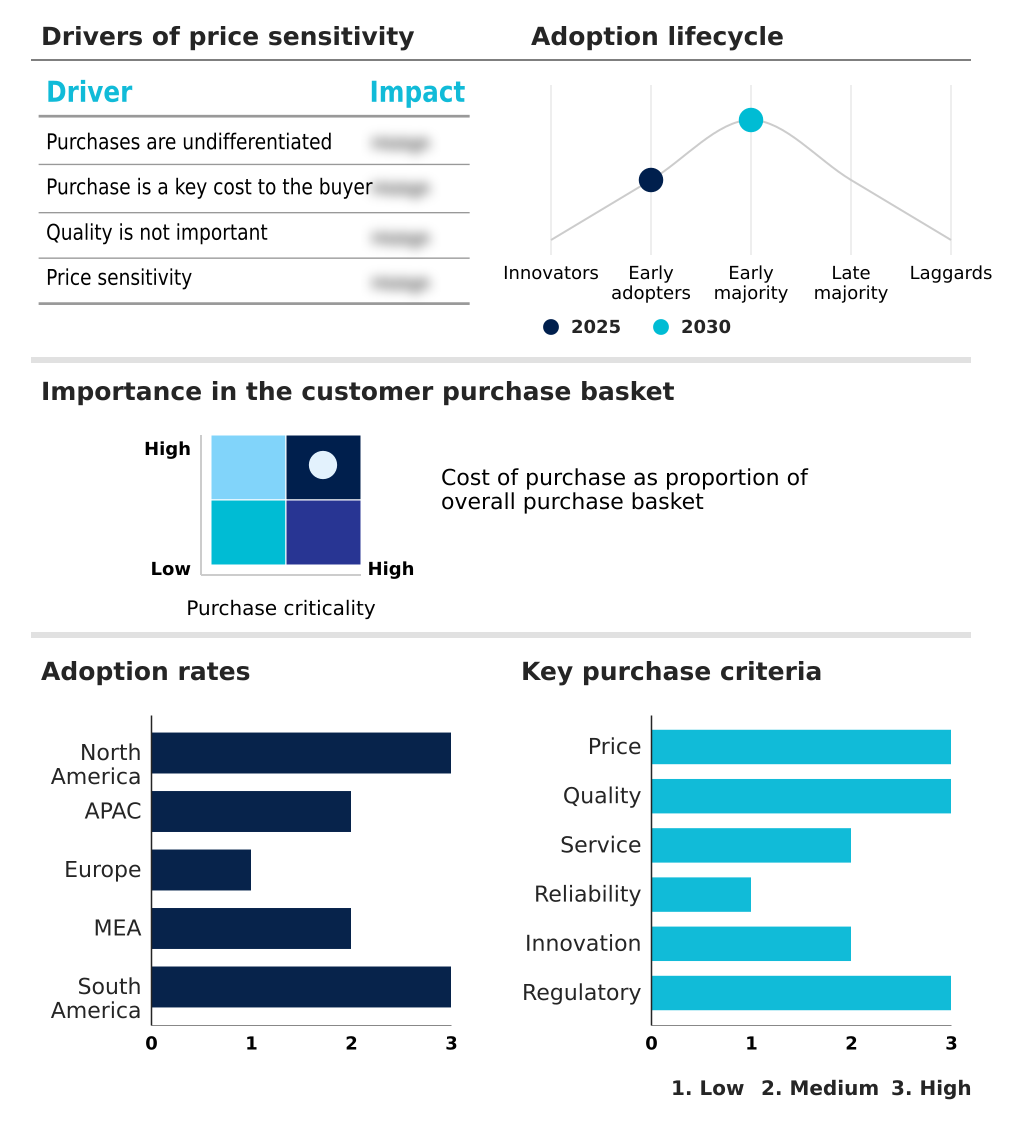
The ai-optimized storage market forecasting report includes the adoption lifecycle of the market, covering from the innovator’s stage to the laggard’s stage. It focuses on adoption rates in different regions based on penetration. Furthermore, the ai-optimized storage market report also includes key purchase criteria and drivers of price sensitivity to help companies evaluate and develop their market growth analysis strategies.
Customer Landscape of Ai-optimized Storage Industry
Competitive Landscape
Companies are implementing various strategies, such as strategic alliances, ai-optimized storage market forecast, partnerships, mergers and acquisitions, geographical expansion, and product/service launches, to enhance their presence in the industry.
Cloudian Inc. - Key offerings include unified platforms that integrate file, block, and object storage with high throughput and low latency for demanding AI and ML workloads.
The industry research and growth report includes detailed analyses of the competitive landscape of the market and information about key companies, including:
- Cloudian Inc.
- DataDirect Networks Inc.
- Dell Technologies Inc.
- Hammerspace Inc.
- Hewlett Packard Enterprise Co.
- Hitachi Vantara LLC
- Huawei Technologies Co. Ltd.
- IBM Corp.
- Lenovo Group Ltd.
- Micron Technology Inc.
- NetApp Inc.
- Nutanix Inc.
- NVIDIA Corp.
- Pure Storage Inc.
- Quantum Corp.
- Scale Computing
- Scality Inc.
- Seagate Technology LLC
- Vast Data
- Western Digital Corp.
Qualitative and quantitative analysis of companies has been conducted to help clients understand the wider business environment as well as the strengths and weaknesses of key industry players. Data is qualitatively analyzed to categorize companies as pure play, category-focused, industry-focused, and diversified; it is quantitatively analyzed to categorize companies as dominant, leading, strong, tentative, and weak.
Market Intelligence Radar: High-Impact Developments & Growth Signals
- In the Application Software industry, the increasing adoption of cloud-native and subscription-based delivery models has directly influenced the global ai-optimized storage market by driving demand for scalable, OpEx-friendly storage solutions that can be provisioned on-demand, with some platforms reporting a 30% reduction in upfront costs for enterprises.
- The rising automation of business processes through Robotic Process Automation (RPA) and Business Process Management (BPM) software is creating a surge in machine-generated data, requiring AI-optimized storage infrastructures that can handle high-velocity data ingestion and provide low-latency access for real-time analytics and intelligent data management.
- Heightened data security and privacy concerns, underscored by regulations like GDPR and the EU AI Act, are compelling application software developers to integrate robust security features, which in turn pressures the AI-optimized storage market to offer advanced data governance, hardware-level encryption, and immutable snapshot capabilities to ensure compliance and data sovereignty.
- The proliferation of enterprise IoT platforms and big data analytics tools has led to an exponential increase in unstructured data, making high-performance, scalable storage a critical component. This has accelerated the adoption of scale-out NAS and object storage solutions optimized for AI workloads, capable of managing petabyte-scale datasets generated by distributed sensors and devices.
Dive into Technavio’s robust research methodology, blending expert interviews, extensive data synthesis, and validated models for unparalleled Ai-optimized Storage Market insights. See full methodology.
| Market Scope | |
|---|---|
| Page number | 296 |
| Base year | 2025 |
| Historic period | 2020-2024 |
| Forecast period | 2026-2030 |
| Growth momentum & CAGR | Accelerate at a CAGR of 26.3% |
| Market growth 2026-2030 | USD 78333.1 million |
| Market structure | Fragmented |
| YoY growth 2025-2026(%) | 25.2% |
| Key countries | US, Canada, Mexico, China, Japan, India, South Korea, Australia, Indonesia, Germany, UK, France, Italy, Spain, The Netherlands, Saudi Arabia, UAE, South Africa, Israel, Turkey, Brazil, Argentina and Chile |
| Competitive landscape | Leading Companies, Market Positioning of Companies, Competitive Strategies, and Industry Risks |
Research Analyst Overview
- The AI-optimized storage market ecosystem is a complex interplay of specialized stakeholders, where component suppliers provide the foundational high-performance memory and flash, contributing to a 30% year-over-year improvement in storage density. System manufacturers and solution providers then integrate this hardware with intelligent software-defined storage management, delivering validated AI infrastructure.
- A key dynamic is the partnership between these manufacturers and cloud service providers, who are collectively responsible for over 55% of total market consumption. Distribution channels, including value-added resellers and system integrators, are critical for customizing and deploying these complex systems for end-users in sectors like finance and healthcare.
- These end-users, in turn, drive innovation by demanding solutions that meet stringent performance, data sovereignty, and compliance requirements, creating a feedback loop that fuels further R&D and refinement across the entire value chain.
What are the Key Data Covered in this Ai-optimized Storage Market Research and Growth Report?
-
What is the expected growth of the Ai-optimized Storage Market between 2026 and 2030?
-
The Ai-optimized Storage Market is expected to grow by USD 78.33 billion during 2026-2030, registering a CAGR of 26.3%. Year-over-year growth in 2026 is estimated at 25.2%%. This acceleration is shaped by exponential growth of data volume and complexity driven by ai workloads, which is intensifying demand across multiple end-use verticals covered in the report.
-
-
What segmentation does the market report cover?
-
The report is segmented by Product (Direct attached storage, Network attached storage, and Storage area network), Type (Enterprises, Cloud service providers, and Telecom companies), End-user (File-based, and Object-based) and Geography (North America, APAC, Europe, Middle East and Africa, South America). Among these, the Direct attached storage segment is estimated to witness significant growth during the forecast period, driven by rising adoption across key application areas. Each segment includes detailed qualitative and quantitative analysis, along with historical data from 2020-2024 and forecasts through 2030 with year-over-year growth rates.
-
-
Which regions are analyzed in the report?
-
The report covers North America, APAC, Europe, Middle East and Africa and South America. North America is estimated to contribute 39.9% to market growth during the forecast period. Country-level analysis includes US, Canada, Mexico, China, Japan, India, South Korea, Australia, Indonesia, Germany, UK, France, Italy, Spain, The Netherlands, Saudi Arabia, UAE, South Africa, Israel, Turkey, Brazil, Argentina and Chile, with dedicated market size tables and year-over-year growth for each.
-
-
What are the key growth drivers and market challenges?
-
The primary driver is exponential growth of data volume and complexity driven by ai workloads, which is accelerating investment and industry demand. The main challenge is excessive initial investment and uncertain return on investment, creating operational barriers for key market participants. The report quantifies the impact of each driver and challenge across 2026 and 2030 with comparative analysis.
-
-
Who are the major players in the Ai-optimized Storage Market?
-
Key vendors include Cloudian Inc., DataDirect Networks Inc., Dell Technologies Inc., Hammerspace Inc., Hewlett Packard Enterprise Co., Hitachi Vantara LLC, Huawei Technologies Co. Ltd., IBM Corp., Lenovo Group Ltd., Micron Technology Inc., NetApp Inc., Nutanix Inc., NVIDIA Corp., Pure Storage Inc., Quantum Corp., Scale Computing, Scality Inc., Seagate Technology LLC, Vast Data and Western Digital Corp.. The report provides qualitative and quantitative analysis categorizing companies as dominant, leading, strong, tentative, and weak based on their market positioning. Company profiles include business segment analysis, SWOT assessment, key offerings, and recent strategic developments.
-
Market Research Insights
- The competitive landscape of the global AI-optimized storage market is intensely active, with the top five vendors accounting for over 60% of total revenue. Key players like NVIDIA, Dell Technologies, and Hewlett Packard Enterprise are focusing on delivering full-stack, validated AI infrastructure to simplify deployment for enterprises.
- Recent developments show a clear trend toward integrated solutions, with some offerings reducing model training times by up to 25% through optimized hardware and software integration. These actions directly address enterprise demand for turnkey systems that mitigate the risks of component incompatibility and performance imbalances.
- This strategic shift reflects the market's maturation, where value is increasingly found in cohesive platforms rather than individual components. However, this consolidation also challenges smaller innovators to find niche specializations to remain competitive.
We can help! Our analysts can customize this ai-optimized storage market research report to meet your requirements.
 RIA -
RIA - 
