Coking Coal Market Analysis, Size, and Forecast 2026-2030: APAC (China, India, and Japan), North America (US, Canada, and Mexico), Europe (Germany, Italy, and France), South America (Brazil, Argentina, and Colombia), Middle East and Africa (Turkey, South Africa, and Saudi Arabia), and Rest of World (ROW)

Coking Coal Market Analysis, Size, and Forecast 2026-2030:
APAC (China, India, and Japan), North America (US, Canada, and Mexico), Europe (Germany, Italy, and France), South America (Brazil, Argentina, and Colombia), Middle East and Africa (Turkey, South Africa, and Saudi Arabia), and Rest of World (ROW)

Published: Apr 2026 303 Pages SKU: IRTNTR81429

Market Overview at a Glance

$48.76 B
Market Opportunity
4.3%
CAGR 2025 - 2030
61%
APAC Growth
$170.41 B
Steel industry segment 2024

Coking Coal Market Size 2026-2030

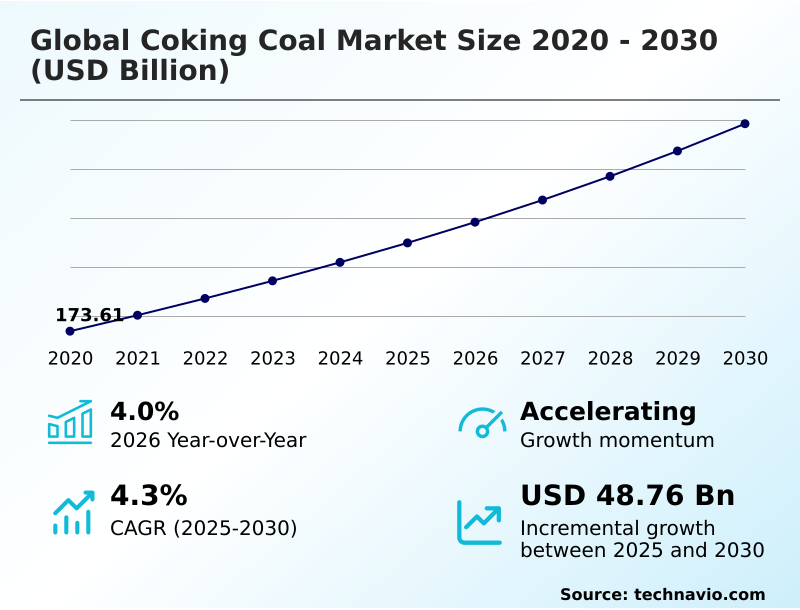
The coking coal market size is valued to increase by USD 48.76 billion, at a CAGR of 4.3% from 2025 to 2030. Expansion of global steel production capacities in emerging markets will drive the coking coal market.

Major Market Trends & Insights

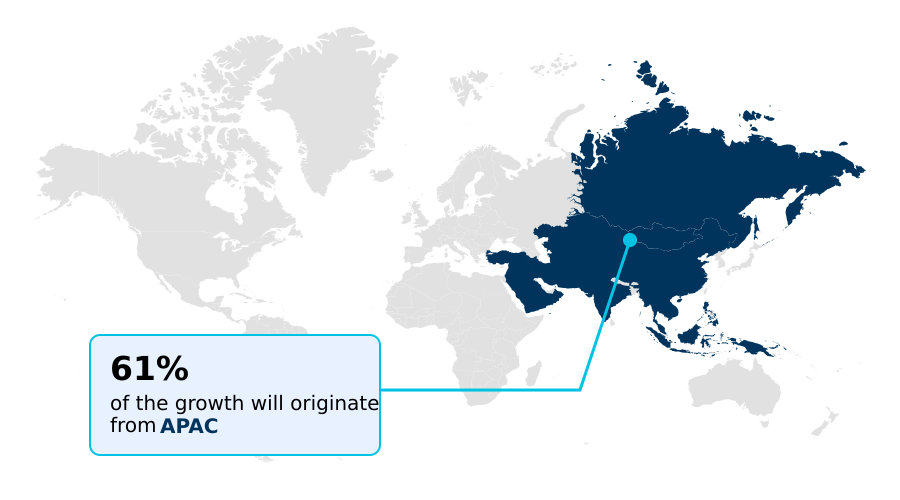
  • APAC dominated the market and accounted for a 61% growth during the forecast period.
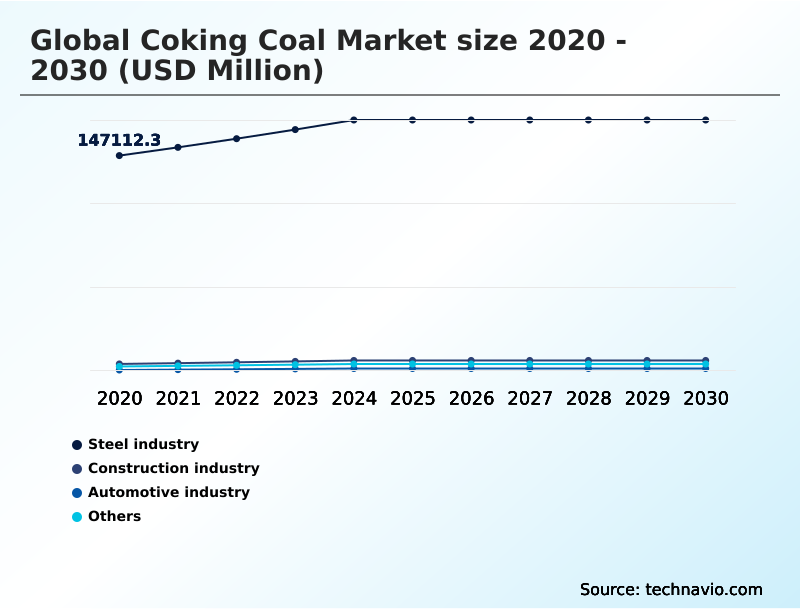
  • By Application - Steel industry segment was valued at USD 170.41 billion in 2024
  • By Type - Hard coking coal segment accounted for the largest market revenue share in 2024

Market Size & Forecast

  • Market Opportunities: USD 84.86 billion
  • Market Future Opportunities: USD 48.76 billion
  • CAGR from 2025 to 2030 : 4.3%

Market Summary

  • The coking coal market remains integral to the global industrial economy, serving as the primary source of carbon for steelmaking. Its value is determined not by energy content but by its unique chemical properties that are essential for converting iron ore into steel within a blast furnace.
  • Market dynamics are heavily influenced by the expansion of steel production in developing economies, where new infrastructure and urbanization projects fuel relentless demand. In a typical business scenario, a steel producer must secure a precise blend of hard and semi-soft coking coals to optimize furnace efficiency and meet stringent quality specifications for automotive-grade steel.
  • This requires sophisticated supply chain management to navigate price volatility and logistical hurdles. Concurrently, the industry is navigating a complex transition. While technological advancements in mining automation and coal preparation enhance productivity, the sector faces a significant challenge from the global push toward decarbonization and the rise of green steel alternatives.
  • The long-term trajectory of the market depends on balancing the persistent need for high-quality steel with increasing environmental, social, and governance pressures.

What will be the Size of the Coking Coal Market during the forecast period?

Get Key Insights on Market Forecast (PDF) Request Free Sample

How is the Coking Coal Market Segmented?

The coking coal industry research report provides comprehensive data (region-wise segment analysis), with forecasts and estimates in "USD million" for the period 2026-2030, as well as historical data from 2020-2024 for the following segments.

  • Application
    • Steel industry
    • Construction industry
    • Automotive industry
    • Others
  • Type
    • Hard coking coal
    • Semi-soft coking coal
    • Semi-hard coking coal
  • Grade type
    • High grade coking coal
    • Medium grade coking coal
    • Low grade coking coal
  • Geography
    • APAC
      • China
      • India
      • Japan
    • North America
      • US
      • Canada
      • Mexico
    • Europe
      • Germany
      • Italy
      • France
    • South America
      • Brazil
      • Argentina
      • Colombia
    • Middle East and Africa
      • Turkey
      • South Africa
      • Saudi Arabia
    • Rest of World (ROW)

By Application Insights

The steel industry segment is estimated to witness significant growth during the forecast period.

The steel industry segment is foundational to the coking coal market, as metallurgical coke is an irreplaceable input for blast furnace operations. This segment's demand is driven by the need for high-strength steel in construction and automotive manufacturing.

The chemical transformation during the coal carbonization process creates coke, which acts as both a fuel and a reducing agent.

Efficient steelmaking relies on specific coal characteristics, including low ash content and optimal fluidity, making petrographic analysis critical for quality control. The steel sector accounts for over 84% of total consumption, underscoring its dominance.

Producers focus on securing stable supplies of metallurgical raw materials, using advanced coal blending to manage costs while maintaining the integrity of the blast furnace burden and final product quality, especially as fugitive methane emissions come under scrutiny.

Request Free Sample

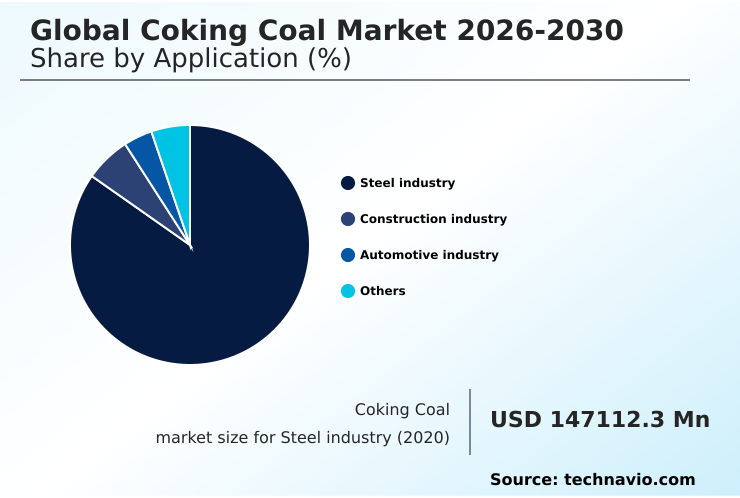
The Steel industry segment was valued at USD 170.41 billion in 2024 and showed a gradual increase during the forecast period.

Request Free Sample

Regional Analysis

APAC is estimated to contribute 61% to the growth of the global market during the forecast period.Technavio’s analysts have elaborately explained the regional trends and drivers that shape the market during the forecast period.

See How Coking Coal Market Demand is Rising in APAC Request Free Sample

The geographic landscape of the coking coal market is dominated by the APAC region, which accounts for over 60% of incremental growth, driven by massive steel production in China and India.

Australia serves as the world's primary exporter of premium hard coking coal (phcc), with its output being critical for supply chain security in Japan and South Korea.

This dynamic is shaped by the quality of steelmaking coal and its low sulfur content.

In contrast, North America, with major producers in the United States and Canada, is a key supplier to Europe and South America, focusing on high-grade coking coal with high calorific value.

European demand is tempered by a shift toward green steel production, while emerging markets in the Middle East and Africa are expanding their import capacity.

This regional interplay highlights the global dependency on a few key production hubs for essential metallurgical raw materials and high-quality semi-soft coking coal.

Market Dynamics

Our researchers analyzed the data with 2025 as the base year, along with the key drivers, trends, and challenges. A holistic analysis of drivers will help companies refine their marketing strategies to gain a competitive advantage.

  • Understanding the coking coal market requires a deep dive into its technical nuances and its foundational role of coking coal in steelmaking. The differentiation between coking coal vs thermal coal properties is paramount; metallurgical grades are valued for chemical characteristics, not just energy output.
  • Key metrics like coke strength after reaction measurement and the impact of ash content on coke quality determine a coal's suitability for the blast furnace. The importance of low volatile matter and the benefits of high calorific value coal are critical for optimizing the coal carbonization technology.
  • Inside the furnace, blast furnace burden permeability factors are managed through careful coal blending for optimal coke production, often using pulverized coal injection efficiency benefits to reduce the overall coke rate.
  • While the industry thrives, it faces challenges from the environmental impact of coking coal mining, including fugitive methane emissions from coal mines, and the rise of the hydrogen-based direct reduced iron process as an alternative.
  • In response, innovations like carbon capture in steel production and advanced coke oven gas utilization are being explored to align with esg compliance in the mining industry and secure the future of coal in green steelmaking.
  • The logistics are also complex, with challenges in metallurgical coal logistics and factors affecting coking coal prices influencing procurement strategies for semi-soft coking coal blending applications.

What are the key market drivers leading to the rise in the adoption of Coking Coal Industry?

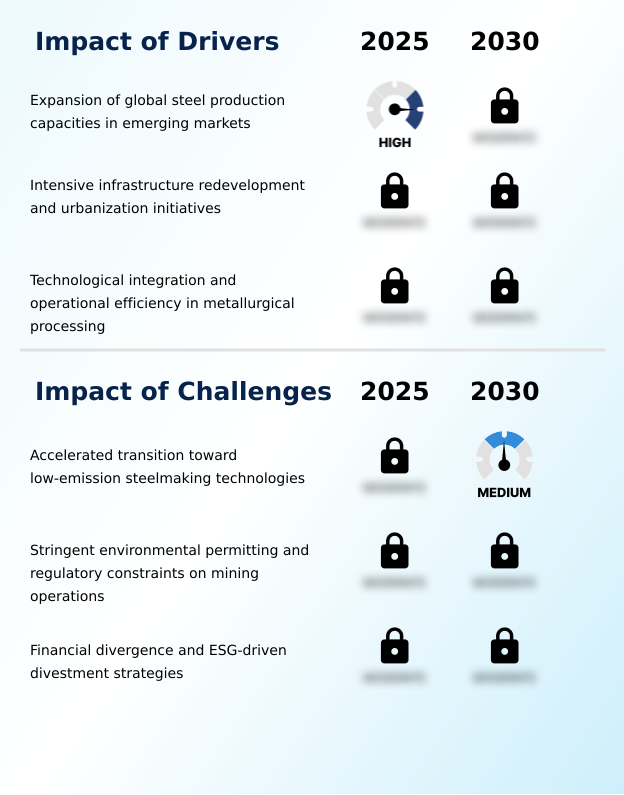
  • The expansion of steel production capacities in emerging markets, driven by industrialization and infrastructure development, is the primary driver fueling demand in the coking coal market.

  • Market growth is primarily propelled by the expansion of steel production and large-scale infrastructure projects. The relentless demand for steel in emerging economies necessitates a stable supply of hard coking coal and semi-hard coking coal for use in blast furnaces.
  • The structural integrity required for modern construction and automotive applications can only be achieved with steel produced via the coal carbonization process. A second driver is the pursuit of greater operational efficiency within the metallurgical sector.
  • Advanced technologies like pulverized coal injection (pci) and AI-driven coal blending can improve the coke rate by over 5%.
  • Innovations at the coal washing plant, informed by petrographic analysis, enhance the quality of the final product, ensuring low ash content and optimal coke strength after reaction (csr), which reduces furnace downtime by up to 12%.

What are the market trends shaping the Coking Coal Industry?

  • The integration of autonomous systems and AI in mining operations is a pivotal market trend. This technological shift is focused on improving operational efficiency, enhancing workplace safety, and ensuring consistent coal quality.

  • Key trends are reshaping the coking coal market, driven by technology and sustainability mandates. The adoption of autonomous mining systems and digital twin mine planning is optimizing extraction processes, with some operations reporting a 15% increase in operational efficiency gains. This shift toward automation enhances safety and improves the consistency of vitrinite reflectance and moisture content in sourced materials.
  • Simultaneously, a strategic move toward bilateral supply agreements is enhancing supply chain security, reducing reliance on volatile spot markets. This is critical for steelmakers who require specific grades for their coke oven batteries. Furthermore, an intense focus on environmental, social, and governance (esg) criteria is compelling producers to invest in methane abatement technologies and improve water management in mining.
  • ESG-compliant operations can access capital at rates up to 10% lower than non-compliant peers, incentivizing sustainable practices.

What challenges does the Coking Coal Industry face during its growth?

  • The accelerated transition toward low-emission steelmaking technologies, including green hydrogen and electric arc furnaces, presents a significant long-term challenge to traditional coking coal demand.

  • The coking coal market confronts significant headwinds, primarily from the global transition to low-emission steelmaking. The rise of direct reduced iron (dri) and green hydrogen technologies directly threatens long-term demand for metallurgical coke, with some analysts projecting these alternatives could displace 20% of conventional production in Europe within a decade.
  • Secondly, increasingly stringent mine permitting processes and land reclamation requirements create major barriers to entry and expansion. These regulatory hurdles can delay new projects by over 30%, constraining supply and increasing price volatility. Finally, esg-driven financial divestment is restricting access to capital, raising borrowing costs for producers by an estimated 15%.
  • This financial pressure complicates investment in essential predictive maintenance algorithms and carbon capture and storage infrastructure needed for long-term viability.

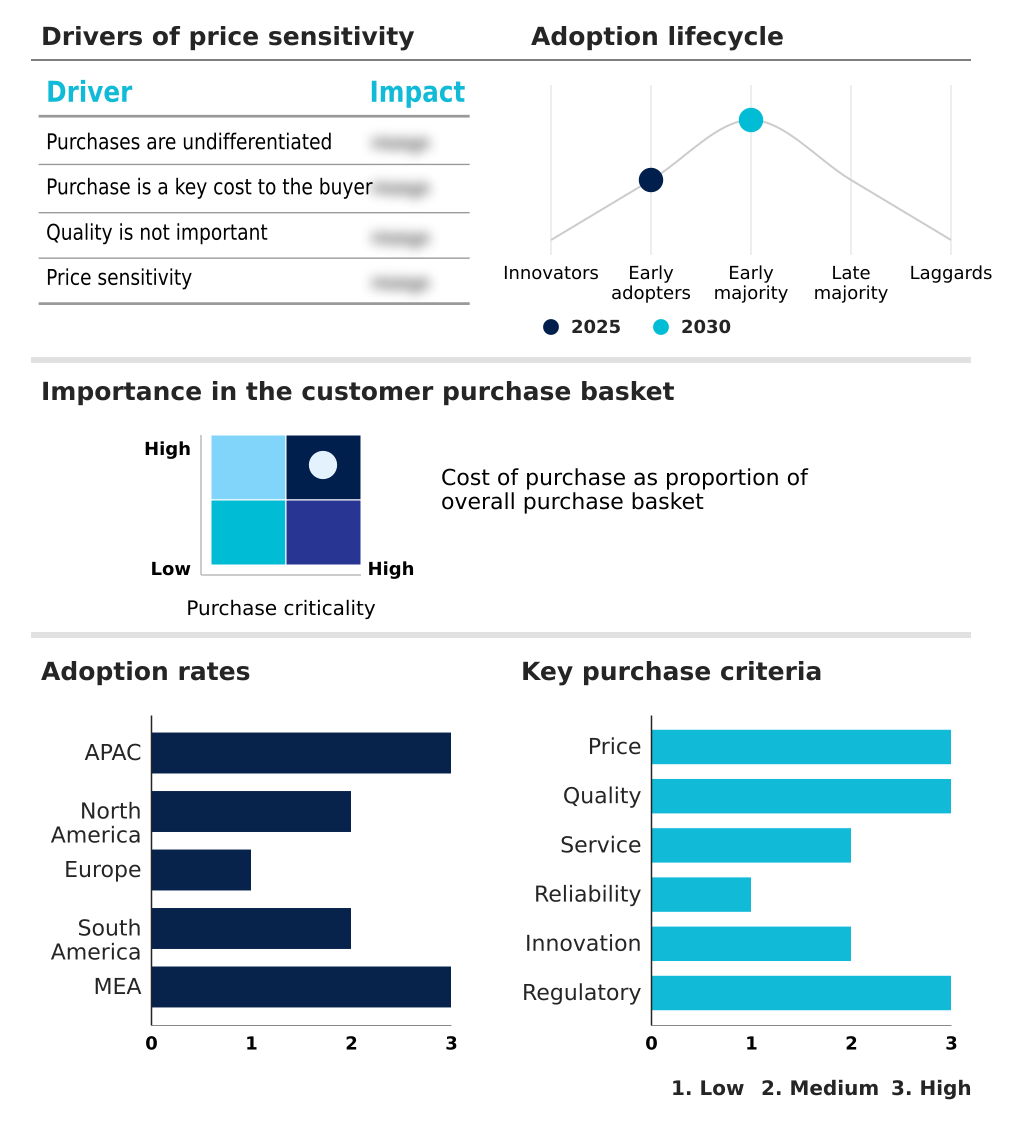
Exclusive Technavio Analysis on Customer Landscape

The coking coal market forecasting report includes the adoption lifecycle of the market, covering from the innovator’s stage to the laggard’s stage. It focuses on adoption rates in different regions based on penetration. Furthermore, the coking coal market report also includes key purchase criteria and drivers of price sensitivity to help companies evaluate and develop their market growth analysis strategies.

Customer Landscape of Coking Coal Industry

Competitive Landscape

Companies are implementing various strategies, such as strategic alliances, coking coal market forecast, partnerships, mergers and acquisitions, geographical expansion, and product/service launches, to enhance their presence in the industry.

Agility Global PLC - A specialized portfolio of high-quality metallurgical coal, hard coking coal, and customized blended products meets the rigorous demands of global steel producers.

The industry research and growth report includes detailed analyses of the competitive landscape of the market and information about key companies, including:

  • Agility Global PLC
  • Alpha Metallurgical Resources
  • Anglo American plc
  • Arch Capital Group Ltd.
  • BHP Group Ltd.
  • Bollore SE
  • Coronado Global Resources Inc.
  • Exxaro Resources Ltd
  • Glencore Plc
  • KLN Logistics Group Ltd.
  • Metinvest Holding LLC
  • Peabody Energy Corp.
  • PT Bumi Resources Tbk
  • Ramaco Resources Inc.
  • Stanmore Resources
  • SunCoke Energy Inc
  • Toll Holdings Ltd.
  • Warrior Met Coal Inc.
  • Yusen Logistics Co. Ltd.

Qualitative and quantitative analysis of companies has been conducted to help clients understand the wider business environment as well as the strengths and weaknesses of key industry players. Data is qualitatively analyzed to categorize companies as pure play, category-focused, industry-focused, and diversified; it is quantitatively analyzed to categorize companies as dominant, leading, strong, tentative, and weak.

Recent Development and News in Coking coal market

  • In April, 2025, ArcelorMittal successfully inaugurated a large-scale industrial pilot for hydrogen-based smelting at its flagship facility in Belgium, which significantly reduces the reliance of the plant on traditional metallurgical coke.
  • In June, 2025, JSW Steel Limited in India successfully commissioned an advanced blast furnace at the Vijayanagar facility, which significantly increases the requirement for high-quality imported coking coal to sustain continuous operations.
  • In October, 2025, the Japanese Ministry of Economy, Trade and Industry initiated a formal partnership with the Canadian province of British Columbia to facilitate the long-term expansion of export terminals and rail infrastructure dedicated specifically to high-quality metallurgical coal shipments for the Japanese steel industry.
  • In March, 2025, Consol Energy commenced a comprehensive project at the Pennsylvania Mining Complex to utilize regenerative thermal oxidizers for the destruction of ventilation air methane, marking a major shift toward low-carbon extraction techniques in the North American metallurgical sector.

Dive into Technavio’s robust research methodology, blending expert interviews, extensive data synthesis, and validated models for unparalleled Coking Coal Market insights. See full methodology.

Market Scope
Page number 303
Base year 2025
Historic period 2020-2024
Forecast period 2026-2030
Growth momentum & CAGR Accelerate at a CAGR of 4.3%
Market growth 2026-2030 USD 48756.4 million
Market structure Fragmented
YoY growth 2025-2026(%) 4.0%
Key countries China, India, Japan, Australia, South Korea, Indonesia, US, Canada, Mexico, Germany, Russia, Poland, Italy, France, UK, Brazil, Argentina, Colombia, Turkey, South Africa, Egypt, Saudi Arabia and UAE
Competitive landscape Leading Companies, Market Positioning of Companies, Competitive Strategies, and Industry Risks

Request Free Sample

Research Analyst Overview

  • The coking coal market is evolving under the dual pressures of persistent industrial demand and a global push for decarbonization. The intrinsic value of this commodity lies in its specific caking properties and chemical composition, making it a critical metallurgical raw material for blast furnace operations.
  • High-grade coking coal, particularly premium hard coking coal (phcc), is essential for producing high-strength coke, which is measured by its coke strength after reaction (csr). Steelmakers utilize sophisticated coal blending and petrographic analysis to optimize the coal carbonization process in coke oven batteries, often supplementing with pulverized coal injection (pci) to lower the coke rate.
  • Boardroom decisions now center on balancing the high capital expenditure for new mines against the risk of esg-driven divestment and the rise of green steel alternatives. For instance, autonomous longwall shearers have demonstrated a 15% improvement in production consistency, justifying investment in automation.
  • The focus is on materials with low volatile matter, low phosphorus content, and low sulfur content to improve efficiency and reduce environmental impact, making factors like vitrinite reflectance and fluidity key differentiators.

What are the Key Data Covered in this Coking Coal Market Research and Growth Report?

  • What is the expected growth of the Coking Coal Market between 2026 and 2030?

    • USD 48.76 billion, at a CAGR of 4.3%

  • What segmentation does the market report cover?

    • The report is segmented by Application (Steel industry, Construction industry, Automotive industry, and Others), Type (Hard coking coal, Semi-soft coking coal, and Semi-hard coking coal), Grade Type (High grade coking coal, Medium grade coking coal, and Low grade coking coal) and Geography (APAC, North America, Europe, South America, Middle East and Africa)

  • Which regions are analyzed in the report?

    • APAC, North America, Europe, South America and Middle East and Africa

  • What are the key growth drivers and market challenges?

    • Expansion of global steel production capacities in emerging markets, Accelerated transition toward low-emission steelmaking technologies

  • Who are the major players in the Coking Coal Market?

    • Agility Global PLC, Alpha Metallurgical Resources, Anglo American plc, Arch Capital Group Ltd., BHP Group Ltd., Bollore SE, Coronado Global Resources Inc., Exxaro Resources Ltd, Glencore Plc, KLN Logistics Group Ltd., Metinvest Holding LLC, Peabody Energy Corp., PT Bumi Resources Tbk, Ramaco Resources Inc., Stanmore Resources, SunCoke Energy Inc, Toll Holdings Ltd., Warrior Met Coal Inc. and Yusen Logistics Co. Ltd.

Market Research Insights

  • The coking coal market is defined by a dynamic interplay between robust industrial demand and significant structural shifts. While infrastructure projects continue to drive consumption, the industry is shaped by pressures for greater efficiency and sustainability.
  • For instance, the adoption of methane abatement technologies can reduce mine-site emissions by over 60%, a critical factor for companies seeking to align with stringent esg standards. Concurrently, predictive maintenance algorithms in coal handling preparation plants are improving operational uptime by as much as 20%.
  • The move toward bilateral supply agreements reflects a strategic pivot to ensure supply chain security amidst geopolitical uncertainty. This complex environment demands that producers balance traditional production with investments in innovation and environmental compliance to maintain market viability.

We can help! Our analysts can customize this coking coal market research report to meet your requirements.

Get in touch

1. Executive Summary

1.1 Market overview

Executive Summary - Chart on Market Overview
Executive Summary - Data Table on Market Overview
Executive Summary - Chart on Global Market Characteristics
Executive Summary - Chart on Market by Geography
Executive Summary - Chart on Market Segmentation by Application
Executive Summary - Chart on Market Segmentation by Type
Executive Summary - Chart on Market Segmentation by Grade Type
Executive Summary - Chart on Incremental Growth
Executive Summary - Data Table on Incremental Growth
Executive Summary - Chart on Company Market Positioning

2. Technavio Analysis

2.1 Analysis of price sensitivity, lifecycle, customer purchase basket, adoption rates, and purchase criteria

2.2 Criticality of inputs and Factors of differentiation

Chart on Overview on criticality of inputs and factors of differentiation

2.3 Factors of disruption

Chart on Overview on factors of disruption

2.4 Impact of drivers and challenges

Chart on Impact of drivers and challenges in 2025 and 2030

3. Market Landscape

3.1 Market ecosystem

Chart on Parent Market
Data Table on - Parent Market

3.2 Market characteristics

Chart on Market characteristics analysis

3.3 Value chain analysis

Chart on Value chain analysis

4. Market Sizing

4.1 Market definition

Data Table on Offerings of companies included in the market definition

4.2 Market segment analysis

Market segments

4.3 Market size 2025

4.4 Market outlook: Forecast for 2025-2030

Chart on Global - Market size and forecast 2025-2030 ($ million)
Data Table on Global - Market size and forecast 2025-2030 ($ million)
Chart on Global Market: Year-over-year growth 2025-2030 (%)
Data Table on Global Market: Year-over-year growth 2025-2030 (%)

5. Historic Market Size

5.1 Global Coking Coal Market 2020 - 2024

Historic Market Size - Data Table on Global Coking Coal Market 2020 - 2024 ($ million)

5.2 Application segment analysis 2020 - 2024

Historic Market Size - Application Segment 2020 - 2024 ($ million)

5.3 Type segment analysis 2020 - 2024

Historic Market Size - Type Segment 2020 - 2024 ($ million)

5.4 Grade Type segment analysis 2020 - 2024

Historic Market Size - Grade Type Segment 2020 - 2024 ($ million)

5.5 Geography segment analysis 2020 - 2024

Historic Market Size - Geography Segment 2020 - 2024 ($ million)

5.6 Country segment analysis 2020 - 2024

Historic Market Size - Country Segment 2020 - 2024 ($ million)

6. Qualitative Analysis

6.1 Impact of AI on Global Coking Coal Market

6.2 Impact of geopolitical conflicts on Global Coking Coal Market

7. Five Forces Analysis

7.1 Five forces summary

Five forces analysis - Comparison between 2025 and 2030

7.2 Bargaining power of buyers

Bargaining power of buyers - Impact of key factors 2025 and 2030

7.3 Bargaining power of suppliers

Bargaining power of suppliers - Impact of key factors in 2025 and 2030

7.4 Threat of new entrants

Threat of new entrants - Impact of key factors in 2025 and 2030

7.5 Threat of substitutes

Threat of substitutes - Impact of key factors in 2025 and 2030

7.6 Threat of rivalry

Threat of rivalry - Impact of key factors in 2025 and 2030

7.7 Market condition

Chart on Market condition - Five forces 2025 and 2030

8. Market Segmentation by Application

8.1 Market segments

Chart on Application - Market share 2025-2030 (%)
Data Table on Application - Market share 2025-2030 (%)

8.2 Comparison by Application

Chart on Comparison by Application
Data Table on Comparison by Application

8.3 Steel industry - Market size and forecast 2025-2030

Chart on Steel industry - Market size and forecast 2025-2030 ($ million)
Data Table on Steel industry - Market size and forecast 2025-2030 ($ million)
Chart on Steel industry - Year-over-year growth 2025-2030 (%)
Data Table on Steel industry - Year-over-year growth 2025-2030 (%)

8.4 Construction industry - Market size and forecast 2025-2030

Chart on Construction industry - Market size and forecast 2025-2030 ($ million)
Data Table on Construction industry - Market size and forecast 2025-2030 ($ million)
Chart on Construction industry - Year-over-year growth 2025-2030 (%)
Data Table on Construction industry - Year-over-year growth 2025-2030 (%)

8.5 Automotive industry - Market size and forecast 2025-2030

Chart on Automotive industry - Market size and forecast 2025-2030 ($ million)
Data Table on Automotive industry - Market size and forecast 2025-2030 ($ million)
Chart on Automotive industry - Year-over-year growth 2025-2030 (%)
Data Table on Automotive industry - Year-over-year growth 2025-2030 (%)

8.6 Others - Market size and forecast 2025-2030

Chart on Others - Market size and forecast 2025-2030 ($ million)
Data Table on Others - Market size and forecast 2025-2030 ($ million)
Chart on Others - Year-over-year growth 2025-2030 (%)
Data Table on Others - Year-over-year growth 2025-2030 (%)

8.7 Market opportunity by Application

Market opportunity by Application ($ million)
Data Table on Market opportunity by Application ($ million)

9. Market Segmentation by Type

9.1 Market segments

Chart on Type - Market share 2025-2030 (%)
Data Table on Type - Market share 2025-2030 (%)

9.2 Comparison by Type

Chart on Comparison by Type
Data Table on Comparison by Type

9.3 Hard coking coal - Market size and forecast 2025-2030

Chart on Hard coking coal - Market size and forecast 2025-2030 ($ million)
Data Table on Hard coking coal - Market size and forecast 2025-2030 ($ million)
Chart on Hard coking coal - Year-over-year growth 2025-2030 (%)
Data Table on Hard coking coal - Year-over-year growth 2025-2030 (%)

9.4 Semi-soft coking coal - Market size and forecast 2025-2030

Chart on Semi-soft coking coal - Market size and forecast 2025-2030 ($ million)
Data Table on Semi-soft coking coal - Market size and forecast 2025-2030 ($ million)
Chart on Semi-soft coking coal - Year-over-year growth 2025-2030 (%)
Data Table on Semi-soft coking coal - Year-over-year growth 2025-2030 (%)

9.5 Semi-hard coking coal - Market size and forecast 2025-2030

Chart on Semi-hard coking coal - Market size and forecast 2025-2030 ($ million)
Data Table on Semi-hard coking coal - Market size and forecast 2025-2030 ($ million)
Chart on Semi-hard coking coal - Year-over-year growth 2025-2030 (%)
Data Table on Semi-hard coking coal - Year-over-year growth 2025-2030 (%)

9.6 Market opportunity by Type

Market opportunity by Type ($ million)
Data Table on Market opportunity by Type ($ million)

10. Market Segmentation by Grade Type

10.1 Market segments

Chart on Grade Type - Market share 2025-2030 (%)
Data Table on Grade Type - Market share 2025-2030 (%)

10.2 Comparison by Grade Type

Chart on Comparison by Grade Type
Data Table on Comparison by Grade Type

10.3 High grade coking coal - Market size and forecast 2025-2030

Chart on High grade coking coal - Market size and forecast 2025-2030 ($ million)
Data Table on High grade coking coal - Market size and forecast 2025-2030 ($ million)
Chart on High grade coking coal - Year-over-year growth 2025-2030 (%)
Data Table on High grade coking coal - Year-over-year growth 2025-2030 (%)

10.4 Medium grade coking coal - Market size and forecast 2025-2030

Chart on Medium grade coking coal - Market size and forecast 2025-2030 ($ million)
Data Table on Medium grade coking coal - Market size and forecast 2025-2030 ($ million)
Chart on Medium grade coking coal - Year-over-year growth 2025-2030 (%)
Data Table on Medium grade coking coal - Year-over-year growth 2025-2030 (%)

10.5 Low grade coking coal - Market size and forecast 2025-2030

Chart on Low grade coking coal - Market size and forecast 2025-2030 ($ million)
Data Table on Low grade coking coal - Market size and forecast 2025-2030 ($ million)
Chart on Low grade coking coal - Year-over-year growth 2025-2030 (%)
Data Table on Low grade coking coal - Year-over-year growth 2025-2030 (%)

10.6 Market opportunity by Grade Type

Market opportunity by Grade Type ($ million)
Data Table on Market opportunity by Grade Type ($ million)

11. Customer Landscape

11.1 Customer landscape overview

Analysis of price sensitivity, lifecycle, customer purchase basket, adoption rates, and purchase criteria

12. Geographic Landscape

12.1 Geographic segmentation

Chart on Market share by geography 2025-2030 (%)
Data Table on Market share by geography 2025-2030 (%)

12.2 Geographic comparison

Chart on Geographic comparison
Data Table on Geographic comparison

12.3 APAC - Market size and forecast 2025-2030

Chart on APAC - Market size and forecast 2025-2030 ($ million)
Data Table on APAC - Market size and forecast 2025-2030 ($ million)
Chart on APAC - Year-over-year growth 2025-2030 (%)
Data Table on APAC - Year-over-year growth 2025-2030 (%)
Chart on Regional Comparison - APAC
Data Table on Regional Comparison - APAC

12.3.1 China - Market size and forecast 2025-2030

Chart on China - Market size and forecast 2025-2030 ($ million)
Data Table on China - Market size and forecast 2025-2030 ($ million)
Chart on China - Year-over-year growth 2025-2030 (%)
Data Table on China - Year-over-year growth 2025-2030 (%)

12.3.2 India - Market size and forecast 2025-2030

Chart on India - Market size and forecast 2025-2030 ($ million)
Data Table on India - Market size and forecast 2025-2030 ($ million)
Chart on India - Year-over-year growth 2025-2030 (%)
Data Table on India - Year-over-year growth 2025-2030 (%)

12.3.3 Japan - Market size and forecast 2025-2030

Chart on Japan - Market size and forecast 2025-2030 ($ million)
Data Table on Japan - Market size and forecast 2025-2030 ($ million)
Chart on Japan - Year-over-year growth 2025-2030 (%)
Data Table on Japan - Year-over-year growth 2025-2030 (%)

12.3.4 Australia - Market size and forecast 2025-2030

Chart on Australia - Market size and forecast 2025-2030 ($ million)
Data Table on Australia - Market size and forecast 2025-2030 ($ million)
Chart on Australia - Year-over-year growth 2025-2030 (%)
Data Table on Australia - Year-over-year growth 2025-2030 (%)

12.3.5 South Korea - Market size and forecast 2025-2030

Chart on South Korea - Market size and forecast 2025-2030 ($ million)
Data Table on South Korea - Market size and forecast 2025-2030 ($ million)
Chart on South Korea - Year-over-year growth 2025-2030 (%)
Data Table on South Korea - Year-over-year growth 2025-2030 (%)

12.3.6 Indonesia - Market size and forecast 2025-2030

Chart on Indonesia - Market size and forecast 2025-2030 ($ million)
Data Table on Indonesia - Market size and forecast 2025-2030 ($ million)
Chart on Indonesia - Year-over-year growth 2025-2030 (%)
Data Table on Indonesia - Year-over-year growth 2025-2030 (%)

12.4 North America - Market size and forecast 2025-2030

Chart on North America - Market size and forecast 2025-2030 ($ million)
Data Table on North America - Market size and forecast 2025-2030 ($ million)
Chart on North America - Year-over-year growth 2025-2030 (%)
Data Table on North America - Year-over-year growth 2025-2030 (%)
Chart on Regional Comparison - North America
Data Table on Regional Comparison - North America

12.4.1 US - Market size and forecast 2025-2030

Chart on US - Market size and forecast 2025-2030 ($ million)
Data Table on US - Market size and forecast 2025-2030 ($ million)
Chart on US - Year-over-year growth 2025-2030 (%)
Data Table on US - Year-over-year growth 2025-2030 (%)

12.4.2 Canada - Market size and forecast 2025-2030

Chart on Canada - Market size and forecast 2025-2030 ($ million)
Data Table on Canada - Market size and forecast 2025-2030 ($ million)
Chart on Canada - Year-over-year growth 2025-2030 (%)
Data Table on Canada - Year-over-year growth 2025-2030 (%)

12.4.3 Mexico - Market size and forecast 2025-2030

Chart on Mexico - Market size and forecast 2025-2030 ($ million)
Data Table on Mexico - Market size and forecast 2025-2030 ($ million)
Chart on Mexico - Year-over-year growth 2025-2030 (%)
Data Table on Mexico - Year-over-year growth 2025-2030 (%)

12.5 Europe - Market size and forecast 2025-2030

Chart on Europe - Market size and forecast 2025-2030 ($ million)
Data Table on Europe - Market size and forecast 2025-2030 ($ million)
Chart on Europe - Year-over-year growth 2025-2030 (%)
Data Table on Europe - Year-over-year growth 2025-2030 (%)
Chart on Regional Comparison - Europe
Data Table on Regional Comparison - Europe

12.5.1 Germany - Market size and forecast 2025-2030

Chart on Germany - Market size and forecast 2025-2030 ($ million)
Data Table on Germany - Market size and forecast 2025-2030 ($ million)
Chart on Germany - Year-over-year growth 2025-2030 (%)
Data Table on Germany - Year-over-year growth 2025-2030 (%)

12.5.2 Russia - Market size and forecast 2025-2030

Chart on Russia - Market size and forecast 2025-2030 ($ million)
Data Table on Russia - Market size and forecast 2025-2030 ($ million)
Chart on Russia - Year-over-year growth 2025-2030 (%)
Data Table on Russia - Year-over-year growth 2025-2030 (%)

12.5.3 Poland - Market size and forecast 2025-2030

Chart on Poland - Market size and forecast 2025-2030 ($ million)
Data Table on Poland - Market size and forecast 2025-2030 ($ million)
Chart on Poland - Year-over-year growth 2025-2030 (%)
Data Table on Poland - Year-over-year growth 2025-2030 (%)

12.5.4 Italy - Market size and forecast 2025-2030

Chart on Italy - Market size and forecast 2025-2030 ($ million)
Data Table on Italy - Market size and forecast 2025-2030 ($ million)
Chart on Italy - Year-over-year growth 2025-2030 (%)
Data Table on Italy - Year-over-year growth 2025-2030 (%)

12.5.5 France - Market size and forecast 2025-2030

Chart on France - Market size and forecast 2025-2030 ($ million)
Data Table on France - Market size and forecast 2025-2030 ($ million)
Chart on France - Year-over-year growth 2025-2030 (%)
Data Table on France - Year-over-year growth 2025-2030 (%)

12.5.6 UK - Market size and forecast 2025-2030

Chart on UK - Market size and forecast 2025-2030 ($ million)
Data Table on UK - Market size and forecast 2025-2030 ($ million)
Chart on UK - Year-over-year growth 2025-2030 (%)
Data Table on UK - Year-over-year growth 2025-2030 (%)

12.6 South America - Market size and forecast 2025-2030

Chart on South America - Market size and forecast 2025-2030 ($ million)
Data Table on South America - Market size and forecast 2025-2030 ($ million)
Chart on South America - Year-over-year growth 2025-2030 (%)
Data Table on South America - Year-over-year growth 2025-2030 (%)
Chart on Regional Comparison - South America
Data Table on Regional Comparison - South America

12.6.1 Brazil - Market size and forecast 2025-2030

Chart on Brazil - Market size and forecast 2025-2030 ($ million)
Data Table on Brazil - Market size and forecast 2025-2030 ($ million)
Chart on Brazil - Year-over-year growth 2025-2030 (%)
Data Table on Brazil - Year-over-year growth 2025-2030 (%)

12.6.2 Argentina - Market size and forecast 2025-2030

Chart on Argentina - Market size and forecast 2025-2030 ($ million)
Data Table on Argentina - Market size and forecast 2025-2030 ($ million)
Chart on Argentina - Year-over-year growth 2025-2030 (%)
Data Table on Argentina - Year-over-year growth 2025-2030 (%)

12.6.3 Colombia - Market size and forecast 2025-2030

Chart on Colombia - Market size and forecast 2025-2030 ($ million)
Data Table on Colombia - Market size and forecast 2025-2030 ($ million)
Chart on Colombia - Year-over-year growth 2025-2030 (%)
Data Table on Colombia - Year-over-year growth 2025-2030 (%)

12.7 Middle East and Africa - Market size and forecast 2025-2030

Chart on Middle East and Africa - Market size and forecast 2025-2030 ($ million)
Data Table on Middle East and Africa - Market size and forecast 2025-2030 ($ million)
Chart on Middle East and Africa - Year-over-year growth 2025-2030 (%)
Data Table on Middle East and Africa - Year-over-year growth 2025-2030 (%)
Chart on Regional Comparison - Middle East and Africa
Data Table on Regional Comparison - Middle East and Africa

12.7.1 Turkey - Market size and forecast 2025-2030

Chart on Turkey - Market size and forecast 2025-2030 ($ million)
Data Table on Turkey - Market size and forecast 2025-2030 ($ million)
Chart on Turkey - Year-over-year growth 2025-2030 (%)
Data Table on Turkey - Year-over-year growth 2025-2030 (%)

12.7.2 South Africa - Market size and forecast 2025-2030

Chart on South Africa - Market size and forecast 2025-2030 ($ million)
Data Table on South Africa - Market size and forecast 2025-2030 ($ million)
Chart on South Africa - Year-over-year growth 2025-2030 (%)
Data Table on South Africa - Year-over-year growth 2025-2030 (%)

12.7.3 Egypt - Market size and forecast 2025-2030

Chart on Egypt - Market size and forecast 2025-2030 ($ million)
Data Table on Egypt - Market size and forecast 2025-2030 ($ million)
Chart on Egypt - Year-over-year growth 2025-2030 (%)
Data Table on Egypt - Year-over-year growth 2025-2030 (%)

12.7.4 Saudi Arabia - Market size and forecast 2025-2030

Chart on Saudi Arabia - Market size and forecast 2025-2030 ($ million)
Data Table on Saudi Arabia - Market size and forecast 2025-2030 ($ million)
Chart on Saudi Arabia - Year-over-year growth 2025-2030 (%)
Data Table on Saudi Arabia - Year-over-year growth 2025-2030 (%)

12.7.5 UAE - Market size and forecast 2025-2030

Chart on UAE - Market size and forecast 2025-2030 ($ million)
Data Table on UAE - Market size and forecast 2025-2030 ($ million)
Chart on UAE - Year-over-year growth 2025-2030 (%)
Data Table on UAE - Year-over-year growth 2025-2030 (%)

12.8 Market opportunity by geography

Market opportunity by geography ($ million)
Data Tables on Market opportunity by geography ($ million)

13. Drivers, Challenges, and Opportunity

13.1 Market drivers

Expansion of global steel production capacities in emerging markets
Intensive infrastructure redevelopment and urbanization initiatives
Technological integration and operational efficiency in metallurgical processing

13.2 Market challenges

Accelerated transition toward low-emission steelmaking technologies
Stringent environmental permitting and regulatory constraints on mining operations
Financial divergence and ESG-driven divestment strategies

13.3 Impact of drivers and challenges

Impact of drivers and challenges in 2025 and 2030

13.4 Market opportunities

Integration of autonomous systems and AI in mining operations
Strategic shifts toward long-term bilateral supply agreements and geopolitical security
Adoption of methane abatement technologies and enhanced ESG compliance

14. Competitive Landscape

14.1 Overview

14.2

Overview on criticality of inputs and factors of differentiation

14.3 Landscape disruption

Overview on factors of disruption

14.4 Industry risks

Impact of key risks on business

15. Competitive Analysis

15.1 Companies profiled

Companies covered

15.2 Company ranking index

15.3 Market positioning of companies

Matrix on companies position and classification

15.4 Alpha Metallurgical Resources

Alpha Metallurgical Resources - Overview
Alpha Metallurgical Resources - Business segments
Alpha Metallurgical Resources - Key offerings
Alpha Metallurgical Resources - Segment focus
SWOT

15.5 Anglo American plc

Anglo American plc - Overview
Anglo American plc - Business segments
Anglo American plc - Key offerings
Anglo American plc - Segment focus
SWOT

15.6 BHP Group Ltd.

BHP Group Ltd. - Overview
BHP Group Ltd. - Business segments
BHP Group Ltd. - Key offerings
BHP Group Ltd. - Segment focus
SWOT

15.7 Bollore SE

Bollore SE - Overview
Bollore SE - Business segments
Bollore SE - Key offerings
Bollore SE - Segment focus
SWOT

15.8 Coronado Global Resources Inc.

Coronado Global Resources Inc. - Overview
Coronado Global Resources Inc. - Business segments
Coronado Global Resources Inc. - Key offerings
Coronado Global Resources Inc. - Segment focus
SWOT

15.9 Exxaro Resources Ltd

Exxaro Resources Ltd - Overview
Exxaro Resources Ltd - Business segments
Exxaro Resources Ltd - Key offerings
Exxaro Resources Ltd - Segment focus
SWOT

15.10 Glencore Plc

Glencore Plc - Overview
Glencore Plc - Business segments
Glencore Plc - Key offerings
Glencore Plc - Segment focus
SWOT

15.11 Metinvest Holding LLC

Metinvest Holding LLC - Overview
Metinvest Holding LLC - Product / Service
Metinvest Holding LLC - Key offerings
SWOT

15.12 Peabody Energy Corp.

Peabody Energy Corp. - Overview
Peabody Energy Corp. - Business segments
Peabody Energy Corp. - Key offerings
Peabody Energy Corp. - Segment focus
SWOT

15.13 PT Bumi Resources Tbk

PT Bumi Resources Tbk - Overview
PT Bumi Resources Tbk - Product / Service
PT Bumi Resources Tbk - Key offerings
SWOT

15.14 Ramaco Resources Inc.

Ramaco Resources Inc. - Overview
Ramaco Resources Inc. - Product / Service
Ramaco Resources Inc. - Key offerings
SWOT

15.15 Stanmore Resources

Stanmore Resources - Overview
Stanmore Resources - Product / Service
Stanmore Resources - Key offerings
SWOT

15.16 SunCoke Energy Inc

SunCoke Energy Inc - Overview
SunCoke Energy Inc - Business segments
SunCoke Energy Inc - Key offerings
SunCoke Energy Inc - Segment focus
SWOT

15.17 Warrior Met Coal Inc.

Warrior Met Coal Inc. - Overview
Warrior Met Coal Inc. - Product / Service
Warrior Met Coal Inc. - Key offerings
SWOT

15.18 Yusen Logistics Co. Ltd.

Yusen Logistics Co. Ltd. - Overview
Yusen Logistics Co. Ltd. - Product / Service
Yusen Logistics Co. Ltd. - Key offerings
SWOT

16. Appendix

16.1 Scope of the report

Market definition
Objectives
Notes and caveats

16.2 Inclusions and exclusions checklist

Inclusions checklist
Exclusions checklist

16.3 Currency conversion rates for US$

16.4 Research methodology

16.5 Data procurement

Information sources

16.6 Data validation

16.7 Validation techniques employed for market sizing

16.8 Data synthesis

16.9 360 degree market analysis

16.10 List of abbreviations

Research Methodology

Technavio presents a detailed picture of the market by way of study, synthesis, and summation of data from multiple sources. The analysts have presented the various facets of the market with a particular focus on identifying the key industry influencers. The data thus presented is comprehensive, reliable, and the result of extensive research, both primary and secondary.

INFORMATION SOURCES

Primary sources

  • Manufacturers and suppliers
  • Channel partners
  • Industry experts
  • Strategic decision makers

Secondary sources

  • Industry journals and periodicals
  • Government data
  • Financial reports of key industry players
  • Historical data
  • Press releases

DATA ANALYSIS

Data Synthesis

  • Collation of data
  • Estimation of key figures
  • Analysis of derived insights

Data Validation

  • Triangulation with data models
  • Reference against proprietary databases
  • Corroboration with industry experts

REPORT WRITING

Qualitative

  • Market drivers
  • Market challenges
  • Market trends
  • Five forces analysis

Quantitative

  • Market size and forecast
  • Market segmentation
  • Geographical insights
  • Competitive landscape

Interested in this report?

Get your sample now to see our research methodology and insights!

Download Now

Frequently Asked Questions

Coking Coal market growth will increase by USD 48756.4 million during 2026-2030.

The Coking Coal market is expected to grow at a CAGR of 4.3% during 2026-2030.

Coking Coal market is segmented by Application (Steel industry, Construction industry, Automotive industry, Others) Type (Hard coking coal, Semi-soft coking coal, Semi-hard coking coal) Grade type (High grade coking coal, Medium grade coking coal, Low grade coking coal)

Agility Global PLC, Alpha Metallurgical Resources, Anglo American plc, Arch Capital Group Ltd., BHP Group Ltd., Bollore SE, Coronado Global Resources Inc., Exxaro Resources Ltd, Glencore Plc, KLN Logistics Group Ltd., Metinvest Holding LLC, Peabody Energy Corp., PT Bumi Resources Tbk, Ramaco Resources Inc., Stanmore Resources, SunCoke Energy Inc, Toll Holdings Ltd., Warrior Met Coal Inc., Yusen Logistics Co. Ltd. are a few of the key vendors in the Coking Coal market.

APAC will register the highest growth rate of 61% among the other regions. Therefore, the Coking Coal market in APAC is expected to garner significant business opportunities for the vendors during the forecast period.

China, India, Japan, Australia, South Korea, Indonesia, US, Canada, Mexico, Germany, Russia, Poland, Italy, France, UK, Brazil, Argentina, Colombia, Turkey, South Africa, Egypt, Saudi Arabia, UAE

  • Expansion of global steel production capacities in emerging markets is the driving factor this market.

The Coking Coal market vendors should focus on grabbing business opportunities from the Application segment as it accounted for the largest market share in the base year.
RIA - Research AI Assistant
Ask RIA