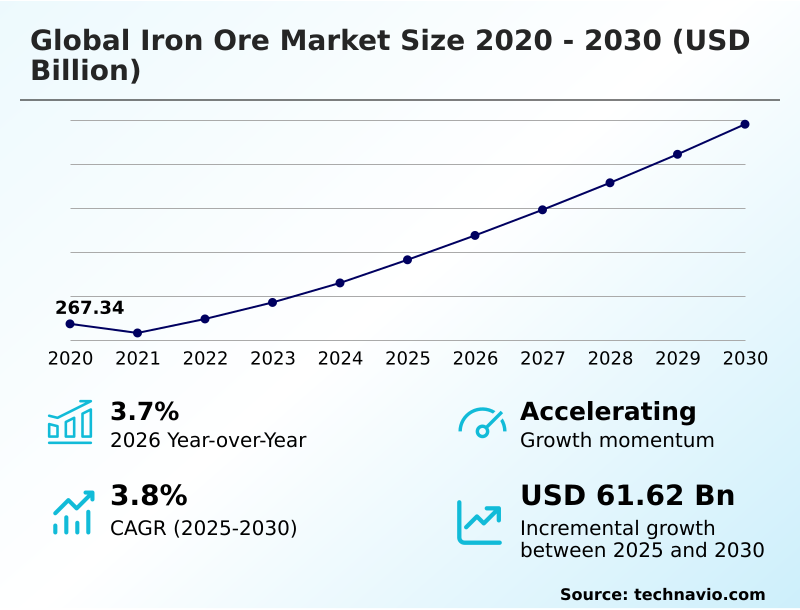
Iron Ore Market Size 2026-2030
The iron ore market size is valued to increase by USD 61.62 billion, at a CAGR of 3.8% from 2025 to 2030. High-grade supply expansion and operationalization of Simandou project will drive the iron ore market.
Major Market Trends & Insights
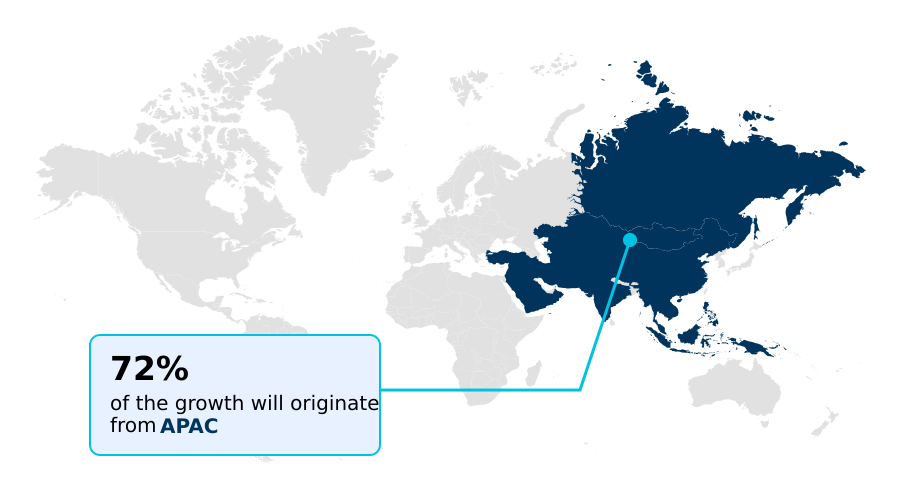
- APAC dominated the market and accounted for a 72.5% growth during the forecast period.
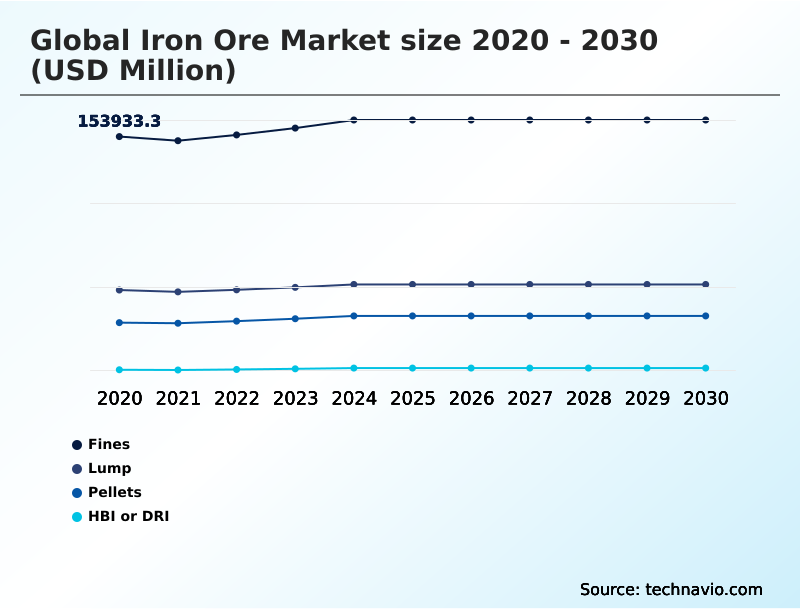
- By Product - Fines segment was valued at USD 164.02 billion in 2024
- By Source - Surface mining segment accounted for the largest market revenue share in 2024
Market Size & Forecast
- Market Opportunities: USD 90.74 billion
- Market Future Opportunities: USD 61.62 billion
- CAGR from 2025 to 2030 : 3.8%
Market Summary
- The iron ore market is undergoing a critical transformation, moving beyond volumetric growth to focus on technological optimization and value-added products. This evolution is driven by the global steel industry's pursuit of decarbonization, which elevates the importance of high-grade feedstocks compatible with low-emission processes.
- A key industry trend is the geographic diversification of supply, challenging traditional trade flows and pricing structures. For instance, a mining operation can leverage AI-driven predictive maintenance and autonomous haulage fleets to enhance operational efficiency, compressing unit costs by over 15% to remain competitive against new, high-grade market entrants.
- At the same time, the industry grapples with geopolitical fragmentation and the high capital expenditure required for green mining transitions. The synergy between massive investments in new frontiers and the digital transformation of legacy operations defines the market's current strategic landscape, ensuring its resilience as a vital segment of the international commodities trade.
What will be the Size of the Iron Ore Market during the forecast period?
Get Key Insights on Market Forecast (PDF) Get Free Sample
How is the Iron Ore Market Segmented?
The iron ore industry research report provides comprehensive data (region-wise segment analysis), with forecasts and estimates in "USD million" for the period 2026-2030, as well as historical data from 2020-2024 for the following segments.
- Product
- Fines
- Lump
- Pellets
- HBI or DRI
- Source
- Surface mining
- Underground mining
- Type
- Hematite
- Magnetite
- Others
- Geography
- APAC
- China
- Australia
- India
- Europe
- Germany
- France
- UK
- South America
- Brazil
- Argentina
- Colombia
- North America
- US
- Canada
- Mexico
- Middle East and Africa
- South Africa
- Saudi Arabia
- UAE
- Rest of World (ROW)
- APAC
By Product Insights
The fines segment is estimated to witness significant growth during the forecast period.
The fines segment remains foundational to steelmaking, but its dynamics are shifting. These small mineral particles require an intensive sintering and pelletizing process to be used effectively, influencing blast furnace burden chemistry.
As steelmakers focus on metallurgical performance enhancement, a clear preference for high-grade fines with low iron ore grade variability is reshaping procurement.
This drives the adoption of advanced beneficiation and ore blending strategies to create high-purity iron concentrate from lower-quality stock. The emphasis on value-in-use ore pricing and high-efficiency hematite production is critical, as producers aim to supply low-carbon steelmaking inputs.
Consequently, leading producers have scaled operations, with one confirming annual output reached 336.1 million tonnes by maximizing high-quality fines production.
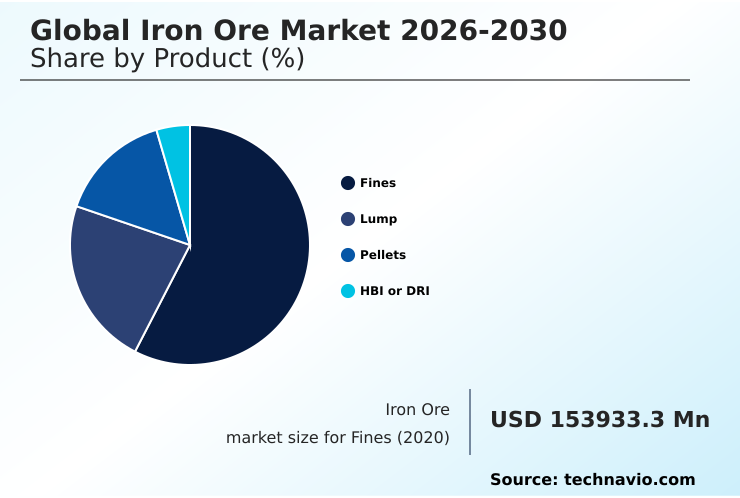
The Fines segment was valued at USD 164.02 billion in 2024 and showed a gradual increase during the forecast period.
Regional Analysis
APAC is estimated to contribute 72.5% to the growth of the global market during the forecast period.Technavio’s analysts have elaborately explained the regional trends and drivers that shape the market during the forecast period.
See How Iron Ore Market Demand is Rising in APAC Get Free Sample
The geographic landscape of the iron ore market is defined by regional specialization and logistical efficiency. APAC dominates consumption, accounting for over 72% of seaborne demand, with its industrial core reliant on Australian hematite direct shipping ore.
Here, integrated mining operations leverage advanced pit-to-port logistics optimization. In North America, the focus is on magnetite concentrate pellet feed derived from taconite pellet production, a process benefiting from the mineral's ferrimagnetic mineral properties.
South America, particularly Brazil, is a key supplier of high-grade ore, utilizing advanced beneficiation and agglomeration to enhance resource utilization efficiency. The use of mineral prospectivity mapping is accelerating exploration in emerging frontiers.
This regional differentiation in production and processing, including a 40% increase in efficiency for complex deposits through automation, is crucial for meeting global steel demand.
Market Dynamics
Our researchers analyzed the data with 2025 as the base year, along with the key drivers, trends, and challenges. A holistic analysis of drivers will help companies refine their marketing strategies to gain a competitive advantage.
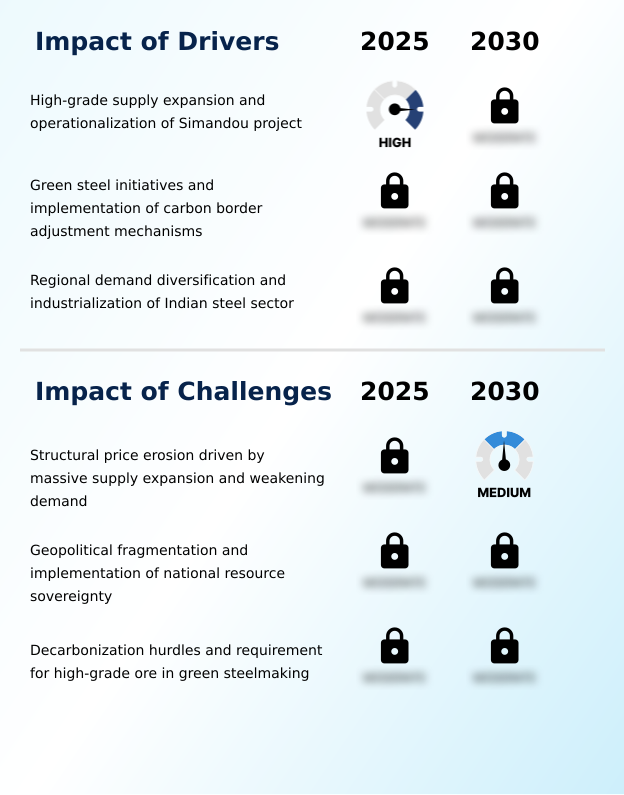
- Analyzing the future of the market requires a deep dive into several interconnected dynamics. The Simandou project iron ore impact is poised to reshape seaborne iron ore trade logistics, introducing new supply and influencing the high-grade ore price premium.
- This development coincides with the growing importance of magnetite use in green steel, a trend that pits direct reduced iron vs scrap as primary feedstocks for low-emission furnaces. In established regions, operators of autonomous mining systems in Pilbara are focused on using digital twins in mineral processing and haulage fleet predictive maintenance to cut costs.
- Concurrently, the CBAM impact on ore procurement is forcing a re-evaluation of supply chains, where blockchain for ore traceability is becoming a key tool for verifying ESG factors in mining investment. This is critical as the industry faces geopolitical risk in ore supply.
- From a technical standpoint, advancements in taconite pelletizing technology advances and blast furnace lump ore optimization are crucial for efficiency. However, the challenges of deep-seated ore mining and the need for better water management in open-pit mines persist.
- Ultimately, understanding the hematite vs magnetite processing cost and the various steel mill decarbonization pathways, which is 20% more capital-intensive for older facilities, is essential for strategic planning.
What are the key market drivers leading to the rise in the adoption of Iron Ore Industry?
- The expansion of high-grade supply sources, highlighted by the operationalization of new mining projects, is a key driver for the market.
- Market growth is increasingly driven by the demand for specialized, high-quality products essential for the global energy transition.
- The push for green steel manufacturing has created a significant high-grade iron ore premium, as steelmakers require low-impurity iron feedstock for hydrogen-based iron reduction and other methods for the decarbonization of steelmaking.
- This has intensified the focus on premium-grade iron ore pellets and high-efficiency hematite production. To meet this demand, producers are optimizing capital expenditure to develop new sources of hematite direct shipping ore, with a renewed focus on ore body characterization.
- The expansion of seaborne iron ore trade is supported by sustainable mining practices, which are now a prerequisite for securing industrial raw material sourcing contracts.
- Investment in these areas has been shown to improve yield from complex deposits by over 8%.
What are the market trends shaping the Iron Ore Industry?
- The institutionalization of autonomous mining and AI-enhanced operational intelligence is an upcoming market trend. This involves deploying integrated digital twins and autonomous systems for continuous, optimized operations.
- The market is rapidly adopting a suite of technologies to enhance efficiency and transparency. The institutionalization of autonomous haulage systems (AHS) and AI-driven process logic is central to Mining 4.0 integration, with over 60% of new processing plants now incorporating these as standard features.
- This shift is enabling a more resilient supply chain, where a digital twin of mining operations allows for real-time adjustments. The use of satellite-based exploration and geospatial intelligence data has reduced initial survey costs by up to 40%. Furthermore, blockchain-enabled traceability and smart contract settlement are transforming digital trade finance systems, providing auditable supply chain transparency solutions.
- These operational intelligence platforms, which utilize predictive maintenance algorithms, ensure higher uptime and optimize ESG compliance in mining.
What challenges does the Iron Ore Industry face during its growth?
- Structural price erosion, driven by a massive expansion in supply coinciding with weakening demand, is a key challenge affecting industry growth.
- The industry faces a complex set of challenges, from market volatility to geopolitical pressures. Structural price erosion, a consequence of supply outpacing demand, is threatening the viability of high-cost marginal mines. Simultaneously, rising resource sovereignty policies and geopolitical trade fragmentation are creating an unpredictable trade environment, necessitating the creation of strategic mineral reserves and robust supply chain risk mitigation tactics.
- This is complicated by the logistical hurdles of cross-border trade documentation. The implementation of the Carbon Border Adjustment Mechanism (CBAM) is another critical factor, reshaping trade flows. The transition to green steel presents a technical bottleneck, as the supply of high-grade electric arc furnace (EAF) feedstock is limited.
- This requires massive investment in technologies for deep-seated mineral exploration and advanced tailings management, increasing operational costs by up to 15% for certain mines.
Exclusive Technavio Analysis on Customer Landscape
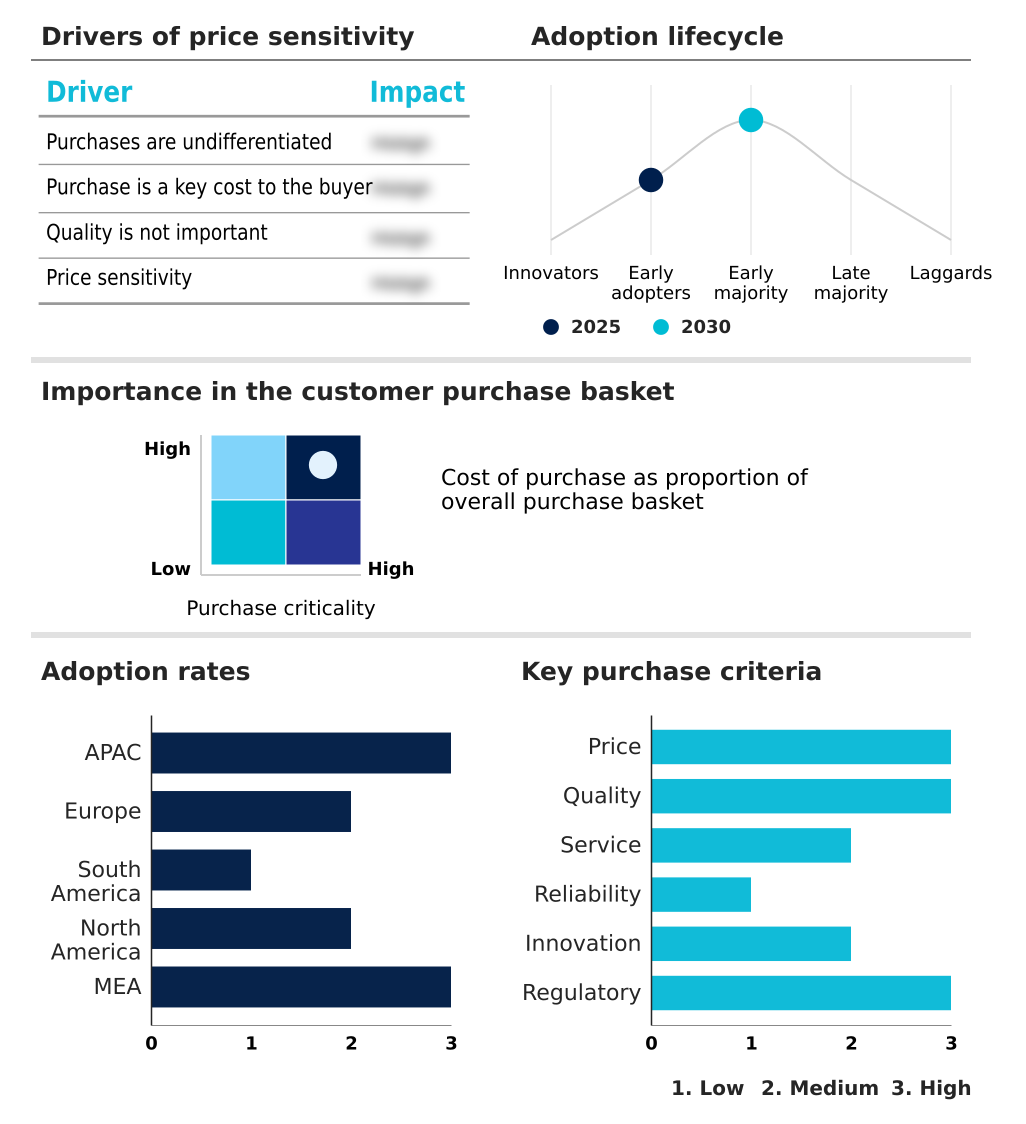
The iron ore market forecasting report includes the adoption lifecycle of the market, covering from the innovator’s stage to the laggard’s stage. It focuses on adoption rates in different regions based on penetration. Furthermore, the iron ore market report also includes key purchase criteria and drivers of price sensitivity to help companies evaluate and develop their market growth analysis strategies.
Customer Landscape of Iron Ore Industry
Competitive Landscape
Companies are implementing various strategies, such as strategic alliances, iron ore market forecast, partnerships, mergers and acquisitions, geographical expansion, and product/service launches, to enhance their presence in the industry.
Anglo American plc - Delivering high-grade ore and fines, a primary raw material essential for global steelmaking operations and supporting integrated supply chain efficiency.
The industry research and growth report includes detailed analyses of the competitive landscape of the market and information about key companies, including:
- Anglo American plc
- Ansteel Group Corp. Ltd.
- ArcelorMittal SA
- BHP Group Ltd.
- Champion Iron Ltd.
- China Hanking Holdings Ltd.
- Cleveland Cliffs Inc.
- Eurasian Resources Group Srl
- Ferrexpo Plc
- Fortescue Ltd.
- Hancock Prospecting Pty Ltd.
- KIOCL Ltd.
- Luossavaara Kiirunavaara AB
- Metinvest Holding LLC
- Mineral Resources Ltd.
- NMDC Ltd.
- Rio Tinto Ltd.
- Vale SA
- Vedanta Ltd.
Qualitative and quantitative analysis of companies has been conducted to help clients understand the wider business environment as well as the strengths and weaknesses of key industry players. Data is qualitatively analyzed to categorize companies as pure play, category-focused, industry-focused, and diversified; it is quantitatively analyzed to categorize companies as dominant, leading, strong, tentative, and weak.
Recent Development and News in Iron ore market
- In May 2025, NMDC Limited announced a strategic objective to produce 55.4 million tonnes of iron ore for the upcoming fiscal year to meet surging domestic steel demand.
- In January 2025, Rio Tinto and BHP Group announced a memorandum of understanding to explore a collaborative mining framework aimed at unlocking up to 200 million tonnes of high-grade iron ore resources in Western Australia.
- In December 2024, Vale S.A. confirmed its annual iron ore output reached 336.1 million tonnes, driven by the ramp-up of new projects and operational improvements at its Brazilian complexes.
- In October 2024, the European Commission finalized implementation details for the Carbon Border Adjustment Mechanism (CBAM), creating new compliance requirements for steel importers and incentivizing low-carbon iron ore procurement.
Dive into Technavio’s robust research methodology, blending expert interviews, extensive data synthesis, and validated models for unparalleled Iron Ore Market insights. See full methodology.
| Market Scope | |
|---|---|
| Page number | 293 |
| Base year | 2025 |
| Historic period | 2020-2024 |
| Forecast period | 2026-2030 |
| Growth momentum & CAGR | Accelerate at a CAGR of 3.8% |
| Market growth 2026-2030 | USD 61619.9 million |
| Market structure | Fragmented |
| YoY growth 2025-2026(%) | 3.7% |
| Key countries | China, Australia, India, Japan, South Korea, Indonesia, Germany, France, UK, Italy, Spain, The Netherlands, Brazil, Argentina, Colombia, US, Canada, Mexico, South Africa, Saudi Arabia, UAE, Turkey and Israel |
| Competitive landscape | Leading Companies, Market Positioning of Companies, Competitive Strategies, and Industry Risks |
Research Analyst Overview
- The iron ore market is navigating a paradigm shift defined by technological disruption and stringent environmental mandates. The core of this transition is the move toward green steel manufacturing, which fundamentally alters demand away from standard ores toward low-impurity iron feedstock. This requires a focus on the decarbonization of steelmaking through methods like hydrogen-based iron reduction.
- To meet this demand, firms are leveraging advanced geometallurgical modeling and satellite-based exploration, including real-time multispectral imagery and mineral prospectivity mapping, to improve resource utilization efficiency. The institutionalization of Mining 4.0 integration, characterized by the use of a digital twin of mining operations, AI-driven process logic, and predictive maintenance algorithms, is no longer optional.
- These technologies, combined with autonomous haulage systems (AHS), are critical for optimizing the entire value chain, from beneficiation and agglomeration to pit-to-port logistics optimization. For instance, integrated AI has improved ore grade variability detection by 30%.
- Managing the complexities of the seaborne iron ore trade is crucial, especially with the influence of the Carbon Border Adjustment Mechanism (CBAM) and resource sovereignty policies.
- The market now rewards suppliers who can deliver hematite direct shipping ore or magnetite concentrate pellet feed using methods like dry stacking tailings management and blockchain-enabled traceability, which address ESG concerns while maintaining a competitive high-grade iron ore premium.
What are the Key Data Covered in this Iron Ore Market Research and Growth Report?
-
What is the expected growth of the Iron Ore Market between 2026 and 2030?
-
USD 61.62 billion, at a CAGR of 3.8%
-
-
What segmentation does the market report cover?
-
The report is segmented by Product (Fines, Lump, Pellets, and HBI or DRI), Source (Surface mining, and Underground mining), Type (Hematite, Magnetite, and Others) and Geography (APAC, Europe, South America, North America, Middle East and Africa)
-
-
Which regions are analyzed in the report?
-
APAC, Europe, South America, North America and Middle East and Africa
-
-
What are the key growth drivers and market challenges?
-
High-grade supply expansion and operationalization of Simandou project, Structural price erosion driven by massive supply expansion and weakening demand
-
-
Who are the major players in the Iron Ore Market?
-
Anglo American plc, Ansteel Group Corp. Ltd., ArcelorMittal SA, BHP Group Ltd., Champion Iron Ltd., China Hanking Holdings Ltd., Cleveland Cliffs Inc., Eurasian Resources Group Srl, Ferrexpo Plc, Fortescue Ltd., Hancock Prospecting Pty Ltd., KIOCL Ltd., Luossavaara Kiirunavaara AB, Metinvest Holding LLC, Mineral Resources Ltd., NMDC Ltd., Rio Tinto Ltd., Vale SA and Vedanta Ltd.
-
Market Research Insights
- The market is defined by a pivot toward high-value products and operational excellence, driven by evolving industrial demands. The adoption of integrated mining operations and automated rail infrastructure enhances efficiency, with some operators achieving a 25% improvement in mine-to-mill optimization. Demand for premium-grade iron ore pellets is accelerating, supported by a clear trend toward low-carbon steelmaking inputs.
- This shift requires significant capital expenditure optimization to fund advanced mineral processing facilities. Geopolitical trade fragmentation and the need for robust supply chain risk mitigation strategies are compelling producers to prioritize ESG compliance in mining.
- Such measures not only secure market access but have been shown to improve investor confidence, leading to a more favorable cost of capital compared to less transparent operations. This focus on sustainability and efficiency underpins the industry's long-term competitive positioning.
We can help! Our analysts can customize this iron ore market research report to meet your requirements.
 RIA -
RIA - 
