Compounding Pharmacy Market Analysis, Size, and Forecast 2026-2030: North America (US, Canada, and Mexico), Europe (Germany, UK, and France), APAC (China, India, and Japan), South America (Brazil, Argentina, and Colombia), Middle East and Africa (Saudi Arabia, UAE, and Turkey), Asia, Rest of World (ROW)

Compounding Pharmacy Market Analysis, Size, and Forecast 2026-2030:
North America (US, Canada, and Mexico), Europe (Germany, UK, and France), APAC (China, India, and Japan), South America (Brazil, Argentina, and Colombia), Middle East and Africa (Saudi Arabia, UAE, and Turkey), Asia, Rest of World (ROW)

Published: May 2026 295 Pages SKU: IRTNTR74609

Market Overview at a Glance

$1.73 B
Market Opportunity
2.1%
CAGR 2025 - 2030
41%
North America Growth
$6.28 B
Topical medications segment 2024

Compounding Pharmacy Market Size 2026-2030

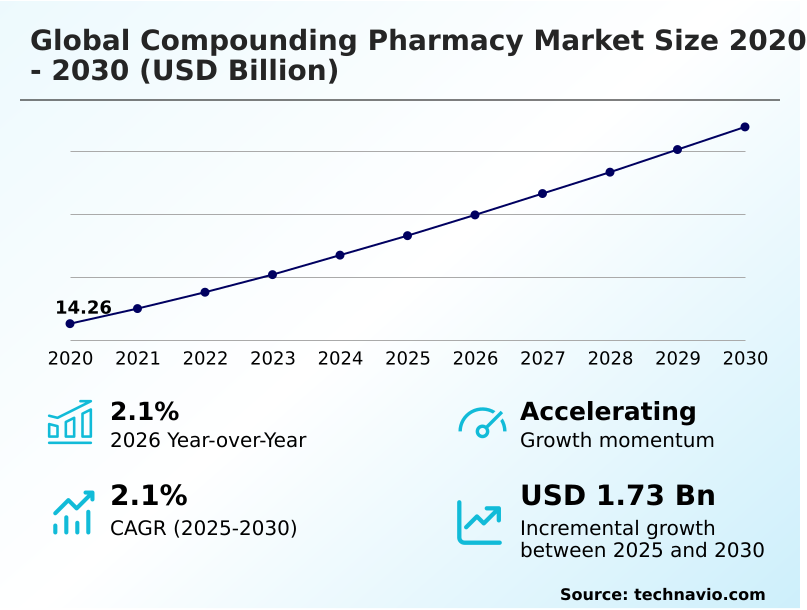
The Compounding Pharmacy Market size was valued at USD 15.66 billion in 2025, growing at a CAGR of 2.1% during the forecast period 2026-2030.

Major Market Trends & Insights

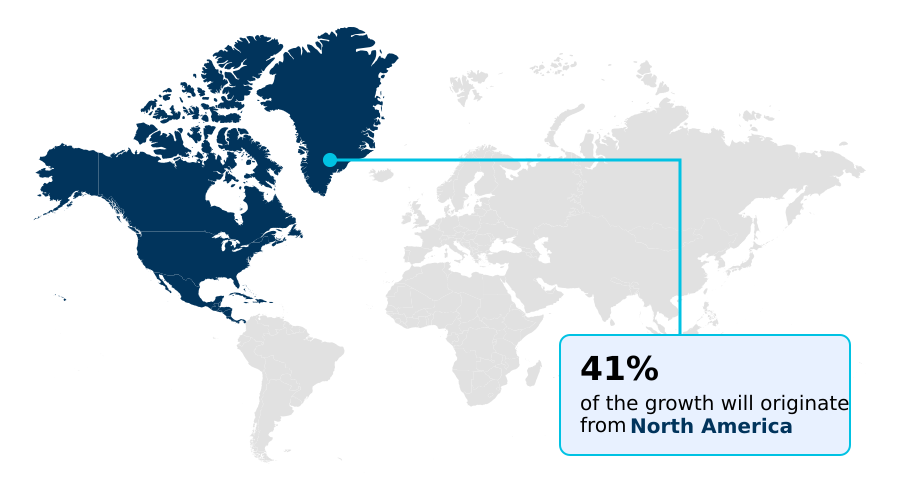
  • North America dominated the market and accounted for a 41% growth during the forecast period.
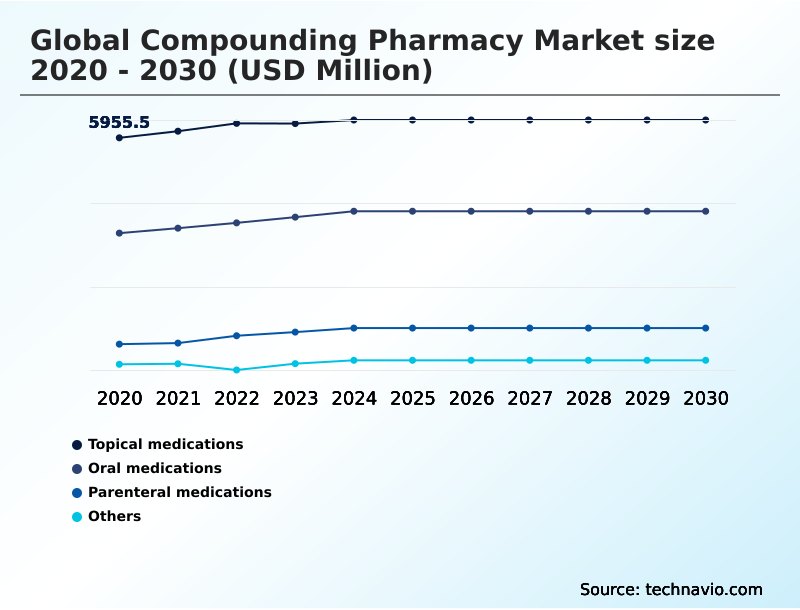
  • By Product - Topical medications segment was valued at USD 6.28 billion in 2024
  • By Therapeutic Area - Pain management segment accounted for the largest market revenue share in 2024

Market Size & Forecast

  • Historic Market Opportunities 2020-2024: USD 3.13 billion
  • Market Future Opportunities 2025-2030: USD 1.73 billion
  • CAGR from 2025 to 2030 : 2.1%

Market Summary

  • The compounding pharmacy market is defined by its essential role in providing personalized medical solutions where mass-produced drugs fall short. A 15% year-over-year rise in diagnosed hormonal disorders has significantly increased the need for individualized treatments like bioidentical hormone replacement therapy.
  • In a common operational scenario, a pharmacy invests in workflow management software to handle a 20% surge in demand for allergen-free formulations, triggered by a regional shortage of a commercial drug. This investment helps ensure supply chain traceability and compliance with regulatory standards during audits.
  • However, the industry faces the challenge of stringent regulatory scrutiny, which drives up costs for specialized cleanroom technology. Despite this, the ability to address drug shortages and provide patient-specific prescriptions solidifies the market's critical position within the broader healthcare ecosystem, improving medication adherence and therapeutic outcomes.

What will be the Size of the Compounding Pharmacy Market during the forecast period?

Get Key Insights on Market Forecast (PDF) Request Free Sample

How is the Compounding Pharmacy Market Segmented?

The compounding pharmacy industry research report provides comprehensive data (region-wise segment analysis), with forecasts and analysis for the period 2026-2030, as well as historical data from 2020-2024 for the following segments.

  • Product
    • Topical medications
    • Oral medications
    • Parenteral medications
    • Others
  • Therapeutic area
    • Pain management
    • Hormone replacement
    • Dermal disorders
    • Others
  • End-user
    • Hospital pharmacies
    • Retail pharmacies
    • Long-term care facilities
    • Others
  • Geography
    • North America
      • US
      • Canada
      • Mexico
    • Europe
      • Germany
      • UK
      • France
    • Asia
    • Rest of World (ROW)

How is the Compounding Pharmacy Market Segmented by Product?

The topical medications segment is estimated to witness significant growth during the forecast period.

The topical medications segment, which captures over 40% of the market by product, is driven by demand for localized treatment with minimal systemic side effects.

Advanced transdermal delivery systems have enhanced the efficacy of topical analgesics, improving drug penetration by up to 15% over traditional ointments. This innovation is critical in pain management formulations and dermatological compounding, where precise, targeted application is necessary.

Custom preparations in this segment allow for the combination of multiple active pharmaceutical ingredients into a single cream or gel, offering a significant advantage for patients with complex conditions like neuropathy or severe acne.

This level of customization through non-sterile preparations is a key factor in the segment's sustained relevance.

Request Free Sample

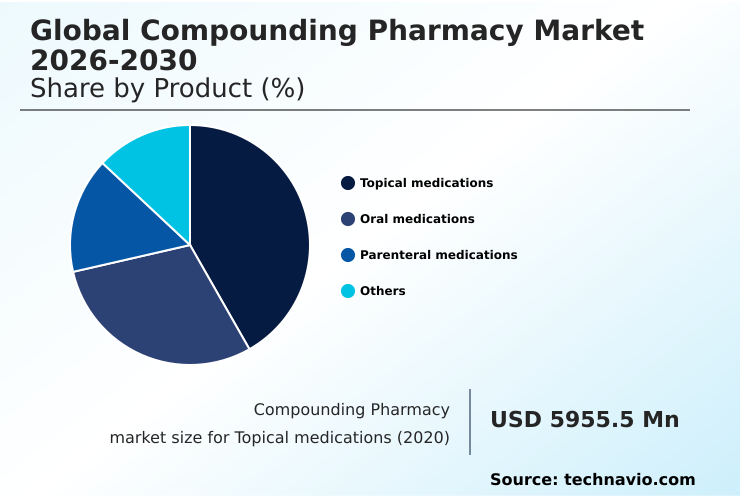
The Topical medications segment was valued at USD 6.28 billion in 2024 and showed a gradual increase during the forecast period.

Request Free Sample

How demand for the Compounding Pharmacy market is rising in the leading region?

North America is estimated to contribute 41% to the growth of the global market during the forecast period.Technavio’s analysts have elaborately explained the regional trends and drivers that shape the market during the forecast period.

See How Compounding Pharmacy Market demand is rising in North America Request Free Sample

North America dominates the compounding pharmacy market, contributing over 41% of the incremental growth, driven by high demand for personalized medicine and established regulatory frameworks.

The region's market maturity is characterized by a strong focus on good manufacturing practices (GMP) and advanced supply chain traceability for pharmaceutical-grade ingredients.

In contrast, Asia is the fastest-growing region, with a projected CAGR of 2.8%, fueled by expanding healthcare infrastructure and a rising middle class. This growth presents opportunities in veterinary compounding and drug shortages management, though challenges remain in standardization.

The adoption of automated compounding devices in Asia is approximately 15% lower than in North America, highlighting different stages of technological integration and investment priorities in cleanroom technology across the globe.

What are the key Drivers, Trends, and Challenges in the Compounding Pharmacy Market?

Our researchers analyzed the data with 2025 as the base year, along with the key drivers, trends, and challenges. A holistic analysis of drivers will help companies refine their marketing strategies to gain a competitive advantage.

  • The demand for specialized compounded medications is increasingly nuanced, reflecting specific clinical needs and patient populations. For instance, sterile injectable compounding services operate under regulatory standards that are up to 25% more stringent than those for non-sterile preparations, requiring significant investment in aseptic processing and environmental monitoring.
  • This contrasts with the requirements for a compounding pharmacy for dermatology, where the focus is on creating effective transdermal delivery systems and ensuring the stability of multiple active ingredients in a single topical formulation.
  • Similarly, personalized pain management medication often involves complex formulations of controlled-release medication to improve patient quality of life, a different clinical challenge than that addressed by pediatric medication flavoring pharmacies, which prioritize palatability to ensure medication adherence improvement.
  • The rise of bioidentical hormone therapy compounding has also carved out a major market segment, driven by patient demand for customized dosage forms that are not commercially available. Each of these areas requires unique expertise, equipment, and quality control testing, illustrating the diverse specialization within the broader compounding pharmacy landscape.

What are the key market drivers leading to the rise in the adoption of Compounding Pharmacy Industry?

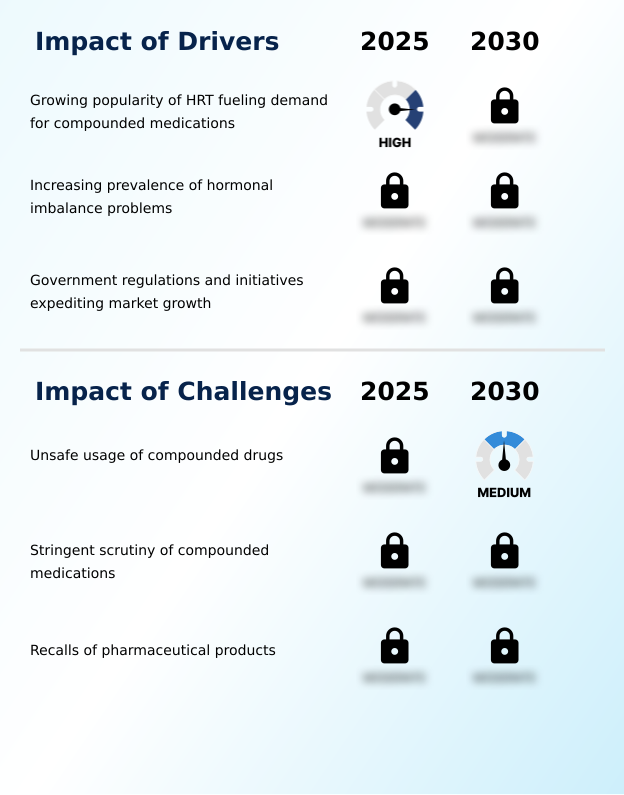
  • The growing popularity of hormone replacement therapy (HRT) is a significant driver, fueling demand for compounded medications as individuals seek personalized solutions.

  • The increasing prevalence of hormonal imbalances, affecting an estimated 15% more young adults annually, is a significant market driver.
  • This has led to a surge in demand for bioidentical hormone replacement therapy (BHRT), as patients seek alternatives to mass-produced synthetic hormones.
  • Compounding pharmacies address this need with patient-specific prescriptions, offering formats like topical gels which can improve symptom management by over 40% compared to standard oral tablets.
  • This driver is amplified by a growing focus on geriatric medication management and proactive hormone level monitoring.
  • As a result, the use of parenteral nutrition and other custom nutritional support is becoming more integrated into holistic wellness and preventative care plans.

What are the market trends shaping the Compounding Pharmacy Industry?

  • The rising popularity of personalized medicines is a transformative trend, redefining the relationship between patients and pharmacists by prioritizing tailored therapeutic solutions.

  • The rising popularity of personalized medicine is a primary trend, with pharmacogenomic testing enabling a 30% improvement in therapeutic efficacy by tailoring drugs to individual genetic profiles. This shift moves beyond one-size-fits-all solutions, driving demand for customized dosage forms.
  • For instance, the adoption of 3D printing in some advanced pharmacies allows for the creation of complex polypills, improving medication adherence by up to 25% for patients with multiple chronic conditions.
  • This technological improvisation is expanding the role of pharmacists in preparing clinical trial materials and creating new avenues for precision dosing, especially for orphan drug formulation, making healthcare more patient-centric through controlled-release medication.

What challenges does the Compounding Pharmacy Industry face during its growth?

  • The unsafe usage of compounded drugs represents a critical risk, stemming from the inherent variability in non-standardized medication preparation and posing a threat to patient safety.

  • Stringent regulatory scrutiny presents a major challenge, with compliance costs for new cleanroom technology increasing operating expenses by up to 20% for many pharmacies. Adherence to standards like USP 797 for aseptic processing requires significant investment in quality control testing and specialized workflows for hazardous drug handling.
  • This pressure is particularly acute for smaller 503A pharmacies compared to larger 503B outsourcing facilities, which can achieve economies of scale. The failure to meet these standards can lead to product recalls, which have seen a 10% increase in some segments, undermining prescriber confidence and threatening patient safety, especially with sterile injectable products.

Exclusive Technavio Analysis on Customer Landscape

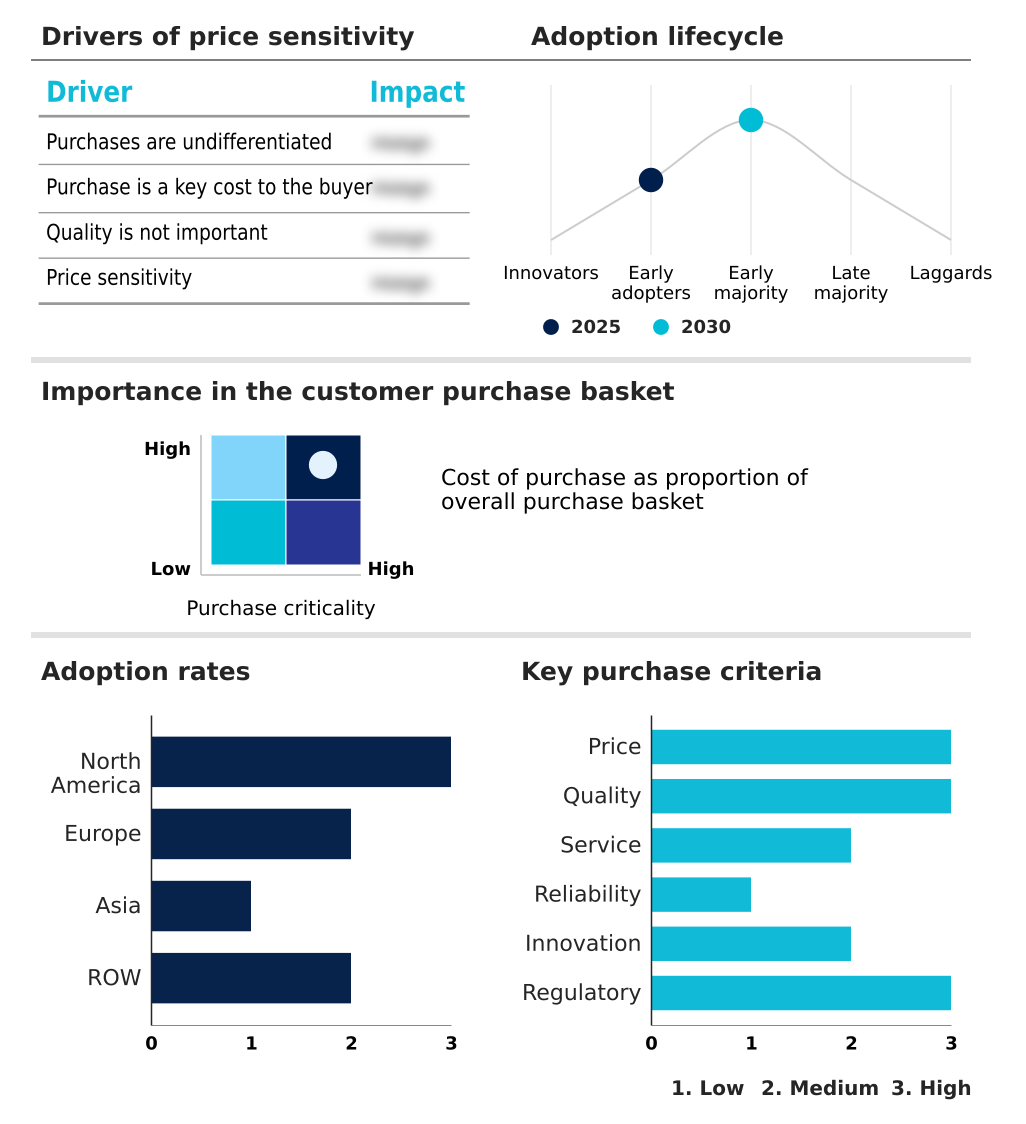
The compounding pharmacy market forecasting report includes the adoption lifecycle of the market, covering from the innovator’s stage to the laggard’s stage. It focuses on adoption rates in different regions based on penetration. Furthermore, the compounding pharmacy market report also includes key purchase criteria and drivers of price sensitivity to help companies evaluate and develop their market growth analysis strategies.

Customer Landscape of Compounding Pharmacy Industry

Competitive Landscape

Companies are implementing various strategies, such as strategic alliances, compounding pharmacy market forecast, partnerships, mergers and acquisitions, geographical expansion, and product/service launches, to enhance their presence in the industry.

AnazaoHealth - Specialized compounding pharmacy services provide customized medication solutions, focusing on hormone replacement therapy, pain management, and sterile preparations to meet individual patient needs.

The industry research and growth report includes detailed analyses of the competitive landscape of the market and information about key companies, including:

  • AnazaoHealth
  • Bayview Pharmacy
  • Belmar Pharma
  • CAPS Pharmacy
  • Clinigen Group Plc
  • Empower Pharmacy
  • Fagron NV
  • Fresenius Kabi AG
  • McGuff
  • Nephron Pharmaceuticals
  • Olympia Pharmacy
  • Pavilion Pharmacy
  • QuVa Pharma
  • SCA Pharma
  • T and C Compounding
  • Wedgewood Pharmacy
  • Wells Pharmacy

Qualitative and quantitative analysis of companies has been conducted to help clients understand the wider business environment as well as the strengths and weaknesses of key industry players. Data is qualitatively analyzed to categorize companies as pure play, category-focused, industry-focused, and diversified; it is quantitatively analyzed to categorize companies as dominant, leading, strong, tentative, and weak.

Market Intelligence Radar: High-Impact Developments & Growth Signals

  • In the Pharmaceuticals industry, persistent drug shortages for commercially manufactured products have increased reliance on compounding pharmacies to prepare essential medications, ensuring continuity of care for patients.
  • The broader shift toward personalized medicine within the Pharmaceuticals industry, underscored by advances in pharmacogenomic testing, is fueling demand for compounded medications tailored to individual genetic profiles and metabolic pathways.
  • In the Pharmaceuticals industry, heightened regulatory harmonization efforts, influenced by standards from bodies like the EMA and FDA, are pushing compounding pharmacies globally to adopt more stringent good manufacturing practices (GMP) and quality control testing, particularly for sterile injectable products.
  • Supply chain vulnerabilities for critical active pharmaceutical ingredients (APIs) in the global Pharmaceuticals industry have prompted compounding pharmacies to diversify sourcing and invest in robust inventory management to mitigate risks and maintain production of patient-specific prescriptions.

Dive into Technavio’s robust research methodology, blending expert interviews, extensive data synthesis, and validated models for unparalleled Compounding Pharmacy Market insights. See full methodology.

Market Scope
Page number 295
Base year 2025
Historic period 2020-2024
Forecast period 2026-2030
Growth momentum & CAGR Accelerate at a CAGR of 2.1%
Market growth 2026-2030 USD 1725.6 million
Market structure Fragmented
YoY growth 2025-2026(%) 2.1%
Key countries US, Canada, Mexico, Germany, UK, France, Italy, Spain, The Netherlands, China, India, Japan, South Korea, Indonesia, Thailand, Brazil, Saudi Arabia, UAE, Turkey, Argentina, Colombia, South Africa and Israel
Competitive landscape Leading Companies, Market Positioning of Companies, Competitive Strategies, and Industry Risks

Request Free Sample

Research Analyst Overview

  • The compounding pharmacy market ecosystem is a complex network of stakeholders, where hospital pharmacies account for over 39% of end-user engagement. The value chain begins with suppliers of high-quality active pharmaceutical ingredients (APIs) and specialized drug excipients, who must meet rigorous standards.
  • Compounding pharmacies, including both small 503A community pharmacies and large 503B outsourcing facilities, act as the central manufacturers, creating patient-specific prescriptions. Regulatory bodies like the FDA and EMA provide critical oversight, enforcing standards such as USP 797 to ensure safety and efficacy, with non-compliance leading to penalties that can reduce a facility's operational capacity by 100%.
  • Distribution channels deliver these customized medications to end-users, including hospitals, retail pharmacies, and long-term care facilities, which rely on these services for personalized medicine and to manage commercial drug shortages.

What are the Key Data Covered in this Compounding Pharmacy Market Research and Growth Report?

  • What is the expected growth of the Compounding Pharmacy Market between 2026 and 2030?

    • The Compounding Pharmacy Market is expected to grow by USD 1.73 billion during 2026-2030, registering a CAGR of 2.1%. Year-over-year growth in 2026 is estimated at 2.1%%. This acceleration is shaped by growing popularity of hrt fueling demand for compounded medications, which is intensifying demand across multiple end-use verticals covered in the report.

  • What segmentation does the market report cover?

    • The report is segmented by Product (Topical medications, Oral medications, Parenteral medications, and Others), Therapeutic Area (Pain management, Hormone replacement, Dermal disorders, and Others), End-user (Hospital pharmacies, Retail pharmacies, Long-term care facilities, and Others) and Geography (North America, Europe, Asia, Rest of World (ROW)). Among these, the Topical medications segment is estimated to witness significant growth during the forecast period, driven by rising adoption across key application areas. Each segment includes detailed qualitative and quantitative analysis, along with historical data from 2020-2024 and forecasts through 2030 with year-over-year growth rates.

  • Which regions are analyzed in the report?

    • The report covers North America, Europe, Asia and Rest of World (ROW). North America is estimated to contribute 41% to market growth during the forecast period. Country-level analysis includes US, Canada, Mexico, Germany, UK, France, Italy, Spain, The Netherlands, China, India, Japan, South Korea, Indonesia, Thailand, Brazil, Saudi Arabia, UAE, Turkey, Argentina, Colombia, South Africa and Israel, with dedicated market size tables and year-over-year growth for each.

  • What are the key growth drivers and market challenges?

    • The primary driver is growing popularity of hrt fueling demand for compounded medications, which is accelerating investment and industry demand. The main challenge is unsafe usage of compounded drugs, creating operational barriers for key market participants. The report quantifies the impact of each driver and challenge across 2026 and 2030 with comparative analysis.

  • Who are the major players in the Compounding Pharmacy Market?

    • Key vendors include AnazaoHealth, Bayview Pharmacy, Belmar Pharma, CAPS Pharmacy, Clinigen Group Plc, Empower Pharmacy, Fagron NV, Fresenius Kabi AG, McGuff, Nephron Pharmaceuticals, Olympia Pharmacy, Pavilion Pharmacy, QuVa Pharma, SCA Pharma, T and C Compounding, Wedgewood Pharmacy and Wells Pharmacy. The report provides qualitative and quantitative analysis categorizing companies as dominant, leading, strong, tentative, and weak based on their market positioning. Company profiles include business segment analysis, SWOT assessment, key offerings, and recent strategic developments.

Market Research Insights

  • The global compounding pharmacy market's competitive landscape is moderately fragmented, with the top 15 vendors, including specialists like Fagron NV and large-scale providers like Fresenius Kabi AG, accounting for a significant portion of market share. These companies are navigating a market that requires high capital expenditure, often exceeding 20% of revenue for new 503B outsourcing facility development.
  • Recent developments center on expanding sterile compounding capabilities and investing in automated compounding devices to enhance safety and efficiency. For example, Empower Pharmacy has focused on scaling its 503A and 503B operations to meet national demand for wellness and hormone medications.
  • This push for technological adoption and capacity expansion directly addresses the industry's core challenge: meeting stringent regulatory compliance while managing persistent drug shortages and increasing demand for personalized medicine.

We can help! Our analysts can customize this compounding pharmacy market research report to meet your requirements.

Get in touch

1. Executive Summary

1.1 Market overview

Executive Summary - Chart on Market Overview
Executive Summary - Data Table on Market Overview
Executive Summary - Chart on Global Market Characteristics
Executive Summary - Chart on Market by Geography
Executive Summary - Chart on Market Segmentation by Product
Executive Summary - Chart on Market Segmentation by Therapeutic Area
Executive Summary - Chart on Market Segmentation by End-user
Executive Summary - Chart on Incremental Growth
Executive Summary - Data Table on Incremental Growth
Executive Summary - Chart on Company Market Positioning

2. Technavio Analysis

2.1 Analysis of price sensitivity, lifecycle, customer purchase basket, adoption rates, and purchase criteria

2.2 Criticality of inputs and Factors of differentiation

Chart on Overview on criticality of inputs and factors of differentiation

2.3 Factors of disruption

Chart on Overview on factors of disruption

2.4 Impact of drivers and challenges

Chart on Impact of drivers and challenges in 2025 and 2030

3. Market Landscape

3.1 Market ecosystem

Chart on Parent Market
Data Table on - Parent Market

3.2 Market characteristics

Chart on Market characteristics analysis

3.3 Value chain analysis

Chart on Value chain analysis

4. Market Sizing

4.1 Market definition

Data Table on Offerings of companies included in the market definition

4.2 Market segment analysis

Market segments

4.3 Market size 2025

4.4 Market outlook: Forecast for 2025-2030

Chart on Global - Market size and forecast 2025-2030 ($ million)
Data Table on Global - Market size and forecast 2025-2030 ($ million)
Chart on Global Market: Year-over-year growth 2025-2030 (%)
Data Table on Global Market: Year-over-year growth 2025-2030 (%)

5. Historic Market Size

5.1 Global Compounding Pharmacy Market 2020 - 2024

Historic Market Size - Data Table on Global Compounding Pharmacy Market 2020 - 2024 ($ million)

5.2 Product segment analysis 2020 - 2024

Historic Market Size - Product Segment 2020 - 2024 ($ million)

5.3 Therapeutic Area segment analysis 2020 - 2024

Historic Market Size - Therapeutic Area Segment 2020 - 2024 ($ million)

5.4 End-user segment analysis 2020 - 2024

Historic Market Size - End-user Segment 2020 - 2024 ($ million)

5.5 Geography segment analysis 2020 - 2024

Historic Market Size - Geography Segment 2020 - 2024 ($ million)

5.6 Country segment analysis 2020 - 2024

Historic Market Size - Country Segment 2020 - 2024 ($ million)

6. Qualitative Analysis

6.1 Impact of AI on Global Compounding Pharmacy Market

7. Five Forces Analysis

7.1 Five forces summary

Five forces analysis - Comparison between 2025 and 2030

7.2 Bargaining power of buyers

Bargaining power of buyers - Impact of key factors 2025 and 2030

7.3 Bargaining power of suppliers

Bargaining power of suppliers - Impact of key factors in 2025 and 2030

7.4 Threat of new entrants

Threat of new entrants - Impact of key factors in 2025 and 2030

7.5 Threat of substitutes

Threat of substitutes - Impact of key factors in 2025 and 2030

7.6 Threat of rivalry

Threat of rivalry - Impact of key factors in 2025 and 2030

7.7 Market condition

Chart on Market condition - Five forces 2025 and 2030

8. Market Segmentation by Product

8.1 Market segments

Chart on Product - Market share 2025-2030 (%)
Data Table on Product - Market share 2025-2030 (%)

8.2 Comparison by Product

Chart on Comparison by Product
Data Table on Comparison by Product

8.3 Topical medications - Market size and forecast 2025-2030

Chart on Topical medications - Market size and forecast 2025-2030 ($ million)
Data Table on Topical medications - Market size and forecast 2025-2030 ($ million)
Chart on Topical medications - Year-over-year growth 2025-2030 (%)
Data Table on Topical medications - Year-over-year growth 2025-2030 (%)

8.4 Oral medications - Market size and forecast 2025-2030

Chart on Oral medications - Market size and forecast 2025-2030 ($ million)
Data Table on Oral medications - Market size and forecast 2025-2030 ($ million)
Chart on Oral medications - Year-over-year growth 2025-2030 (%)
Data Table on Oral medications - Year-over-year growth 2025-2030 (%)

8.5 Parenteral medications - Market size and forecast 2025-2030

Chart on Parenteral medications - Market size and forecast 2025-2030 ($ million)
Data Table on Parenteral medications - Market size and forecast 2025-2030 ($ million)
Chart on Parenteral medications - Year-over-year growth 2025-2030 (%)
Data Table on Parenteral medications - Year-over-year growth 2025-2030 (%)

8.6 Others - Market size and forecast 2025-2030

Chart on Others - Market size and forecast 2025-2030 ($ million)
Data Table on Others - Market size and forecast 2025-2030 ($ million)
Chart on Others - Year-over-year growth 2025-2030 (%)
Data Table on Others - Year-over-year growth 2025-2030 (%)

8.7 Market opportunity by Product

Market opportunity by Product ($ million)
Data Table on Market opportunity by Product ($ million)

9. Market Segmentation by Therapeutic Area

9.1 Market segments

Chart on Therapeutic Area - Market share 2025-2030 (%)
Data Table on Therapeutic Area - Market share 2025-2030 (%)

9.2 Comparison by Therapeutic Area

Chart on Comparison by Therapeutic Area
Data Table on Comparison by Therapeutic Area

9.3 Pain management - Market size and forecast 2025-2030

Chart on Pain management - Market size and forecast 2025-2030 ($ million)
Data Table on Pain management - Market size and forecast 2025-2030 ($ million)
Chart on Pain management - Year-over-year growth 2025-2030 (%)
Data Table on Pain management - Year-over-year growth 2025-2030 (%)

9.4 Hormone replacement - Market size and forecast 2025-2030

Chart on Hormone replacement - Market size and forecast 2025-2030 ($ million)
Data Table on Hormone replacement - Market size and forecast 2025-2030 ($ million)
Chart on Hormone replacement - Year-over-year growth 2025-2030 (%)
Data Table on Hormone replacement - Year-over-year growth 2025-2030 (%)

9.5 Dermal disorders - Market size and forecast 2025-2030

Chart on Dermal disorders - Market size and forecast 2025-2030 ($ million)
Data Table on Dermal disorders - Market size and forecast 2025-2030 ($ million)
Chart on Dermal disorders - Year-over-year growth 2025-2030 (%)
Data Table on Dermal disorders - Year-over-year growth 2025-2030 (%)

9.6 Others - Market size and forecast 2025-2030

Chart on Others - Market size and forecast 2025-2030 ($ million)
Data Table on Others - Market size and forecast 2025-2030 ($ million)
Chart on Others - Year-over-year growth 2025-2030 (%)
Data Table on Others - Year-over-year growth 2025-2030 (%)

9.7 Market opportunity by Therapeutic Area

Market opportunity by Therapeutic Area ($ million)
Data Table on Market opportunity by Therapeutic Area ($ million)

10. Market Segmentation by End-user

10.1 Market segments

Chart on End-user - Market share 2025-2030 (%)
Data Table on End-user - Market share 2025-2030 (%)

10.2 Comparison by End-user

Chart on Comparison by End-user
Data Table on Comparison by End-user

10.3 Hospital pharmacies - Market size and forecast 2025-2030

Chart on Hospital pharmacies - Market size and forecast 2025-2030 ($ million)
Data Table on Hospital pharmacies - Market size and forecast 2025-2030 ($ million)
Chart on Hospital pharmacies - Year-over-year growth 2025-2030 (%)
Data Table on Hospital pharmacies - Year-over-year growth 2025-2030 (%)

10.4 Retail pharmacies - Market size and forecast 2025-2030

Chart on Retail pharmacies - Market size and forecast 2025-2030 ($ million)
Data Table on Retail pharmacies - Market size and forecast 2025-2030 ($ million)
Chart on Retail pharmacies - Year-over-year growth 2025-2030 (%)
Data Table on Retail pharmacies - Year-over-year growth 2025-2030 (%)

10.5 Long-term care facilities - Market size and forecast 2025-2030

Chart on Long-term care facilities - Market size and forecast 2025-2030 ($ million)
Data Table on Long-term care facilities - Market size and forecast 2025-2030 ($ million)
Chart on Long-term care facilities - Year-over-year growth 2025-2030 (%)
Data Table on Long-term care facilities - Year-over-year growth 2025-2030 (%)

10.6 Others - Market size and forecast 2025-2030

Chart on Others - Market size and forecast 2025-2030 ($ million)
Data Table on Others - Market size and forecast 2025-2030 ($ million)
Chart on Others - Year-over-year growth 2025-2030 (%)
Data Table on Others - Year-over-year growth 2025-2030 (%)

10.7 Market opportunity by End-user

Market opportunity by End-user ($ million)
Data Table on Market opportunity by End-user ($ million)

11. Customer Landscape

11.1 Customer landscape overview

Analysis of price sensitivity, lifecycle, customer purchase basket, adoption rates, and purchase criteria

12. Geographic Landscape

12.1 Geographic segmentation

Chart on Market share by geography 2025-2030 (%)
Data Table on Market share by geography 2025-2030 (%)

12.2 Geographic comparison

Chart on Geographic comparison
Data Table on Geographic comparison

12.3 North America - Market size and forecast 2025-2030

Chart on North America - Market size and forecast 2025-2030 ($ million)
Data Table on North America - Market size and forecast 2025-2030 ($ million)
Chart on North America - Year-over-year growth 2025-2030 (%)
Data Table on North America - Year-over-year growth 2025-2030 (%)
Chart on Regional Comparison - North America
Data Table on Regional Comparison - North America

12.3.1 US - Market size and forecast 2025-2030

Chart on US - Market size and forecast 2025-2030 ($ million)
Data Table on US - Market size and forecast 2025-2030 ($ million)
Chart on US - Year-over-year growth 2025-2030 (%)
Data Table on US - Year-over-year growth 2025-2030 (%)

12.3.2 Canada - Market size and forecast 2025-2030

Chart on Canada - Market size and forecast 2025-2030 ($ million)
Data Table on Canada - Market size and forecast 2025-2030 ($ million)
Chart on Canada - Year-over-year growth 2025-2030 (%)
Data Table on Canada - Year-over-year growth 2025-2030 (%)

12.3.3 Mexico - Market size and forecast 2025-2030

Chart on Mexico - Market size and forecast 2025-2030 ($ million)
Data Table on Mexico - Market size and forecast 2025-2030 ($ million)
Chart on Mexico - Year-over-year growth 2025-2030 (%)
Data Table on Mexico - Year-over-year growth 2025-2030 (%)

12.4 Europe - Market size and forecast 2025-2030

Chart on Europe - Market size and forecast 2025-2030 ($ million)
Data Table on Europe - Market size and forecast 2025-2030 ($ million)
Chart on Europe - Year-over-year growth 2025-2030 (%)
Data Table on Europe - Year-over-year growth 2025-2030 (%)
Chart on Regional Comparison - Europe
Data Table on Regional Comparison - Europe

12.4.1 Germany - Market size and forecast 2025-2030

Chart on Germany - Market size and forecast 2025-2030 ($ million)
Data Table on Germany - Market size and forecast 2025-2030 ($ million)
Chart on Germany - Year-over-year growth 2025-2030 (%)
Data Table on Germany - Year-over-year growth 2025-2030 (%)

12.4.2 UK - Market size and forecast 2025-2030

Chart on UK - Market size and forecast 2025-2030 ($ million)
Data Table on UK - Market size and forecast 2025-2030 ($ million)
Chart on UK - Year-over-year growth 2025-2030 (%)
Data Table on UK - Year-over-year growth 2025-2030 (%)

12.4.3 France - Market size and forecast 2025-2030

Chart on France - Market size and forecast 2025-2030 ($ million)
Data Table on France - Market size and forecast 2025-2030 ($ million)
Chart on France - Year-over-year growth 2025-2030 (%)
Data Table on France - Year-over-year growth 2025-2030 (%)

12.4.4 Italy - Market size and forecast 2025-2030

Chart on Italy - Market size and forecast 2025-2030 ($ million)
Data Table on Italy - Market size and forecast 2025-2030 ($ million)
Chart on Italy - Year-over-year growth 2025-2030 (%)
Data Table on Italy - Year-over-year growth 2025-2030 (%)

12.4.5 Spain - Market size and forecast 2025-2030

Chart on Spain - Market size and forecast 2025-2030 ($ million)
Data Table on Spain - Market size and forecast 2025-2030 ($ million)
Chart on Spain - Year-over-year growth 2025-2030 (%)
Data Table on Spain - Year-over-year growth 2025-2030 (%)

12.4.6 The Netherlands - Market size and forecast 2025-2030

Chart on The Netherlands - Market size and forecast 2025-2030 ($ million)
Data Table on The Netherlands - Market size and forecast 2025-2030 ($ million)
Chart on The Netherlands - Year-over-year growth 2025-2030 (%)
Data Table on The Netherlands - Year-over-year growth 2025-2030 (%)

12.5 Asia - Market size and forecast 2025-2030

Chart on Asia - Market size and forecast 2025-2030 ($ million)
Data Table on Asia - Market size and forecast 2025-2030 ($ million)
Chart on Asia - Year-over-year growth 2025-2030 (%)
Data Table on Asia - Year-over-year growth 2025-2030 (%)
Chart on Regional Comparison - Asia
Data Table on Regional Comparison - Asia

12.5.1 China - Market size and forecast 2025-2030

Chart on China - Market size and forecast 2025-2030 ($ million)
Data Table on China - Market size and forecast 2025-2030 ($ million)
Chart on China - Year-over-year growth 2025-2030 (%)
Data Table on China - Year-over-year growth 2025-2030 (%)

12.5.2 India - Market size and forecast 2025-2030

Chart on India - Market size and forecast 2025-2030 ($ million)
Data Table on India - Market size and forecast 2025-2030 ($ million)
Chart on India - Year-over-year growth 2025-2030 (%)
Data Table on India - Year-over-year growth 2025-2030 (%)

12.5.3 Japan - Market size and forecast 2025-2030

Chart on Japan - Market size and forecast 2025-2030 ($ million)
Data Table on Japan - Market size and forecast 2025-2030 ($ million)
Chart on Japan - Year-over-year growth 2025-2030 (%)
Data Table on Japan - Year-over-year growth 2025-2030 (%)

12.5.4 South Korea - Market size and forecast 2025-2030

Chart on South Korea - Market size and forecast 2025-2030 ($ million)
Data Table on South Korea - Market size and forecast 2025-2030 ($ million)
Chart on South Korea - Year-over-year growth 2025-2030 (%)
Data Table on South Korea - Year-over-year growth 2025-2030 (%)

12.5.5 Indonesia - Market size and forecast 2025-2030

Chart on Indonesia - Market size and forecast 2025-2030 ($ million)
Data Table on Indonesia - Market size and forecast 2025-2030 ($ million)
Chart on Indonesia - Year-over-year growth 2025-2030 (%)
Data Table on Indonesia - Year-over-year growth 2025-2030 (%)

12.5.6 Thailand - Market size and forecast 2025-2030

Chart on Thailand - Market size and forecast 2025-2030 ($ million)
Data Table on Thailand - Market size and forecast 2025-2030 ($ million)
Chart on Thailand - Year-over-year growth 2025-2030 (%)
Data Table on Thailand - Year-over-year growth 2025-2030 (%)

12.6 Rest of World (ROW) - Market size and forecast 2025-2030

Chart on Rest of World (ROW) - Market size and forecast 2025-2030 ($ million)
Data Table on Rest of World (ROW) - Market size and forecast 2025-2030 ($ million)
Chart on Rest of World (ROW) - Year-over-year growth 2025-2030 (%)
Data Table on Rest of World (ROW) - Year-over-year growth 2025-2030 (%)
Chart on Regional Comparison - Rest of World (ROW)
Data Table on Regional Comparison - Rest of World (ROW)

12.6.1 Brazil - Market size and forecast 2025-2030

Chart on Brazil - Market size and forecast 2025-2030 ($ million)
Data Table on Brazil - Market size and forecast 2025-2030 ($ million)
Chart on Brazil - Year-over-year growth 2025-2030 (%)
Data Table on Brazil - Year-over-year growth 2025-2030 (%)

12.6.2 Saudi Arabia - Market size and forecast 2025-2030

Chart on Saudi Arabia - Market size and forecast 2025-2030 ($ million)
Data Table on Saudi Arabia - Market size and forecast 2025-2030 ($ million)
Chart on Saudi Arabia - Year-over-year growth 2025-2030 (%)
Data Table on Saudi Arabia - Year-over-year growth 2025-2030 (%)

12.6.3 UAE - Market size and forecast 2025-2030

Chart on UAE - Market size and forecast 2025-2030 ($ million)
Data Table on UAE - Market size and forecast 2025-2030 ($ million)
Chart on UAE - Year-over-year growth 2025-2030 (%)
Data Table on UAE - Year-over-year growth 2025-2030 (%)

12.6.4 Turkey - Market size and forecast 2025-2030

Chart on Turkey - Market size and forecast 2025-2030 ($ million)
Data Table on Turkey - Market size and forecast 2025-2030 ($ million)
Chart on Turkey - Year-over-year growth 2025-2030 (%)
Data Table on Turkey - Year-over-year growth 2025-2030 (%)

12.6.5 Argentina - Market size and forecast 2025-2030

Chart on Argentina - Market size and forecast 2025-2030 ($ million)
Data Table on Argentina - Market size and forecast 2025-2030 ($ million)
Chart on Argentina - Year-over-year growth 2025-2030 (%)
Data Table on Argentina - Year-over-year growth 2025-2030 (%)

12.6.6 Colombia - Market size and forecast 2025-2030

Chart on Colombia - Market size and forecast 2025-2030 ($ million)
Data Table on Colombia - Market size and forecast 2025-2030 ($ million)
Chart on Colombia - Year-over-year growth 2025-2030 (%)
Data Table on Colombia - Year-over-year growth 2025-2030 (%)

12.6.7 South Africa - Market size and forecast 2025-2030

Chart on South Africa - Market size and forecast 2025-2030 ($ million)
Data Table on South Africa - Market size and forecast 2025-2030 ($ million)
Chart on South Africa - Year-over-year growth 2025-2030 (%)
Data Table on South Africa - Year-over-year growth 2025-2030 (%)

12.6.8 Israel - Market size and forecast 2025-2030

Chart on Israel - Market size and forecast 2025-2030 ($ million)
Data Table on Israel - Market size and forecast 2025-2030 ($ million)
Chart on Israel - Year-over-year growth 2025-2030 (%)
Data Table on Israel - Year-over-year growth 2025-2030 (%)

12.7 Market opportunity by geography

Market opportunity by geography ($ million)
Data Tables on Market opportunity by geography ($ million)

13. Drivers, Challenges, and Opportunity

13.1 Market drivers

Growing popularity of HRT fueling demand for compounded medications
Increasing prevalence of hormonal imbalance problems
Government regulations and initiatives expediting market growth

13.2 Market challenges

Unsafe usage of compounded drugs
Stringent scrutiny of compounded medications
Recalls of pharmaceutical products

13.3 Impact of drivers and challenges

Impact of drivers and challenges in 2025 and 2030

13.4 Market opportunities

Rising popularity of personalized medicines
Untapped opportunities in emerging markets
Improvisation of essential drugs fostering market growth

14. Competitive Landscape

14.1 Overview

14.2

Overview on criticality of inputs and factors of differentiation

14.3 Landscape disruption

Overview on factors of disruption

14.4 Industry risks

Impact of key risks on business

15. Competitive Analysis

15.1 Companies profiled

Companies covered

15.2 Company ranking index

15.3 Market positioning of companies

Matrix on companies position and classification

15.4 AnazaoHealth

AnazaoHealth - Overview
AnazaoHealth - Product / Service
AnazaoHealth - Key offerings
SWOT

15.5 Bayview Pharmacy

Bayview Pharmacy - Overview
Bayview Pharmacy - Product / Service
Bayview Pharmacy - Key offerings
SWOT

15.6 Belmar Pharma

Belmar Pharma - Overview
Belmar Pharma - Product / Service
Belmar Pharma - Key offerings
SWOT

15.7 CAPS Pharmacy

CAPS Pharmacy - Overview
CAPS Pharmacy - Product / Service
CAPS Pharmacy - Key offerings
SWOT

15.8 Clinigen Group Plc

Clinigen Group Plc - Overview
Clinigen Group Plc - Product / Service
Clinigen Group Plc - Key offerings
SWOT

15.9 Empower Pharmacy

Empower Pharmacy - Overview
Empower Pharmacy - Product / Service
Empower Pharmacy - Key offerings
SWOT

15.10 Fagron NV

Fagron NV - Overview
Fagron NV - Business segments
Fagron NV - Key offerings
Fagron NV - Segment focus
SWOT

15.11 Fresenius Kabi AG

Fresenius Kabi AG - Overview
Fresenius Kabi AG - Product / Service
Fresenius Kabi AG - Key offerings
SWOT

15.12 McGuff

McGuff - Overview
McGuff - Product / Service
McGuff - Key offerings
SWOT

15.13 Olympia Pharmacy

Olympia Pharmacy - Overview
Olympia Pharmacy - Product / Service
Olympia Pharmacy - Key offerings
SWOT

15.14 Pavilion Pharmacy

Pavilion Pharmacy - Overview
Pavilion Pharmacy - Product / Service
Pavilion Pharmacy - Key offerings
SWOT

15.15 QuVa Pharma

QuVa Pharma - Overview
QuVa Pharma - Product / Service
QuVa Pharma - Key offerings
SWOT

15.16 SCA Pharma

SCA Pharma - Overview
SCA Pharma - Product / Service
SCA Pharma - Key offerings
SWOT

15.17 Wedgewood Pharmacy

Wedgewood Pharmacy - Overview
Wedgewood Pharmacy - Product / Service
Wedgewood Pharmacy - Key offerings
SWOT

15.18 Wells Pharmacy

Wells Pharmacy - Overview
Wells Pharmacy - Product / Service
Wells Pharmacy - Key offerings
SWOT

16. Appendix

16.1 Scope of the report

Market definition
Objectives
Notes and caveats

16.2 Inclusions and exclusions checklist

Inclusions checklist
Exclusions checklist

16.3 Currency conversion rates for US$

16.4 Research methodology

16.5 Data procurement

Information sources

16.6 Data validation

16.7 Validation techniques employed for market sizing

16.8 Data synthesis

16.9 360 degree market analysis

16.10 List of abbreviations

Research Methodology

Technavio presents a detailed picture of the market by way of study, synthesis, and summation of data from multiple sources. The analysts have presented the various facets of the market with a particular focus on identifying the key industry influencers. The data thus presented is comprehensive, reliable, and the result of extensive research, both primary and secondary.

INFORMATION SOURCES

Primary sources

  • Manufacturers and suppliers
  • Channel partners
  • Industry experts
  • Strategic decision makers

Secondary sources

  • Industry journals and periodicals
  • Government data
  • Financial reports of key industry players
  • Historical data
  • Press releases

DATA ANALYSIS

Data Synthesis

  • Collation of data
  • Estimation of key figures
  • Analysis of derived insights

Data Validation

  • Triangulation with data models
  • Reference against proprietary databases
  • Corroboration with industry experts

REPORT WRITING

Qualitative

  • Market drivers
  • Market challenges
  • Market trends
  • Five forces analysis

Quantitative

  • Market size and forecast
  • Market segmentation
  • Geographical insights
  • Competitive landscape

Interested in this report?

Get your sample now to see our research methodology and insights!

Download Now

Frequently Asked Questions

Compounding Pharmacy market growth will increase by USD 1725.6 million during 2026-2030.

The Compounding Pharmacy market is expected to grow at a CAGR of 2.1% during 2026-2030.

Compounding Pharmacy market is segmented by Product (Topical medications, Oral medications, Parenteral medications, Others) Therapeutic area (Pain management, Hormone replacement, Dermal disorders, Others) End-user (Hospital pharmacies, Retail pharmacies, Long-term care facilities, Others)

AnazaoHealth, Bayview Pharmacy, Belmar Pharma, CAPS Pharmacy, Clinigen Group Plc, Empower Pharmacy, Fagron NV, Fresenius Kabi AG, McGuff, Nephron Pharmaceuticals, Olympia Pharmacy, Pavilion Pharmacy, QuVa Pharma, SCA Pharma, T and C Compounding, Wedgewood Pharmacy, Wells Pharmacy are a few of the key vendors in the Compounding Pharmacy market.

North America will register the highest growth rate of 41% among the other regions. Therefore, the Compounding Pharmacy market in North America is expected to garner significant business opportunities for the vendors during the forecast period.

US, Canada, Mexico, Germany, UK, France, Italy, Spain, The Netherlands, China, India, Japan, South Korea, Indonesia, Thailand, Brazil, Saudi Arabia, UAE, Turkey, Argentina, Colombia, South Africa, Israel

  • Growing popularity of HRT fueling demand for compounded medications is the driving factor this market.

The Compounding Pharmacy market vendors should focus on grabbing business opportunities from the Product segment as it accounted for the largest market share in the base year.
RIA - Research AI Assistant
Ask RIA