France Cosmetics Products Market Size 2025-2029
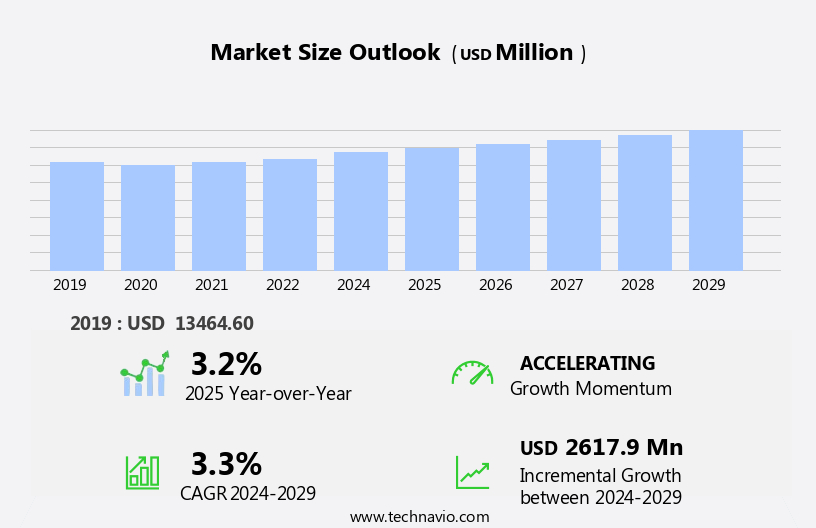
The France cosmetics products market size is forecast to increase by USD 2.62 billion, at a CAGR of 3.3% between 2024 and 2029.
- The cosmetics market is experiencing significant growth, driven primarily by the expanding population of middle-aged consumers (30-50 years) who represent a substantial market segment. This demographic is increasingly prioritizing their appearance and seeking high-quality cosmetics and cosmeceuticals. Another key trend is the rising preference for organic and natural cosmetics, reflecting consumers' heightened awareness of health and wellness. However, this market landscape is not without challenges. Intense price competition among companies is intensifying, putting pressure on profit margins and necessitating strategic pricing and cost management. Another trend is the increasing demand for antiperspirants, fragrances, make-up, shampoos, soaps, and sunscreens, as people seek to maintain their attractiveness and personal hygiene.
- Companies must navigate these dynamics to capitalize on growth opportunities and maintain a competitive edge. Organic and natural cosmetics, in particular, present a significant growth avenue, as consumers express a willingness to pay a premium for these products. To succeed, companies must focus on product innovation, sustainable sourcing, and effective marketing strategies that resonate with their target demographics. Organic certification and natural cosmetics are also on the rise, as consumers seek safer and healthier alternatives for their personal care.
What will be the size of the France Cosmetics Products Market during the forecast period?
- In the dynamic cosmetics market, customer feedback plays a pivotal role in shaping brand reputation and loyalty. Sustainable packaging, a growing trend, is increasingly important to consumers, driving innovation in biodegradable materials and recyclable components. Beauty technology advances, such as fragrance notes and clinical studies, cater to consumers' desire for effective and personalized products. Ethical sourcing of ingredients and brand awareness are also key considerations, as consumers seek transparency in their skincare and beauty routines. Brand awareness and innovation pipeline are crucial for staying competitive in the industry. Skin health and body image continue to be major drivers of consumer behavior, with skin tone, hair texture, and beauty standards influencing purchasing decisions.
- Online reviews and social media engagement shape consumer insights and influence beauty trends. Personalized products cater to individual skin types and preferences, offering a competitive advantage. Beauty services, such as makeup techniques and beauty trends, further enhance the overall customer experience. Market research indicates that growth potential remains strong, with continued innovation and consumer demand for product efficacy and brand loyalty. Digital marketing and beauty influencers are essential tools for reaching and engaging with consumers. Beauty communities foster a sense of belonging and provide valuable feedback. Industry trends, such as biodegradable materials and ethical sourcing, reflect a shift towards more sustainable and socially responsible practices.
- Brand reputation and product efficacy are paramount in the cosmetics market, with consumer experience and social media engagement shaping brand loyalty. Beauty technology, innovation, and ingredient sourcing are essential components of a successful brand strategy. Skin health, body image, and consumer behavior continue to be major factors influencing market dynamics.
How is this market segmented?
The market research report provides comprehensive data (region-wise segment analysis), with forecasts and estimates in "USD million" for the period 2025-2029, as well as historical data from 2019-2023 for the following segments.
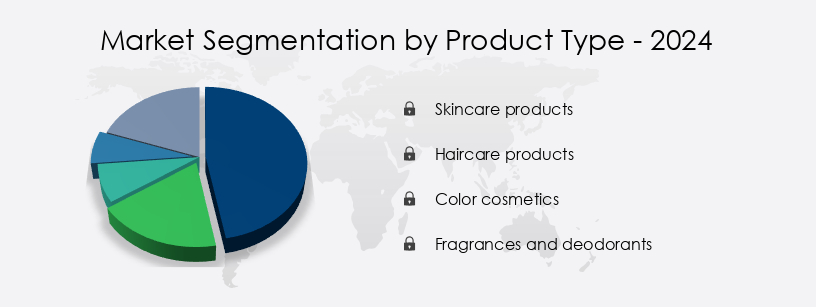
- Product Type
- Skincare products
- Haircare products
- Color cosmetics
- Fragrances and deodorants
- Distribution Channel
- Offline
- Online
- Price
- Budget
- Mid-range
- Premium
- Gender
- Women
- Men
- Geography
- Europe
- France
- Europe
By Product Type Insights
The skincare products segment is estimated to witness significant growth during the forecast period. In the dynamic cosmetics market, various segments continue to gain traction in the US. Makeup brushes, essential for both men and women, are experiencing increased demand due to their role in enhancing the application of cosmetics. Vegan cosmetics, a growing trend, is gaining popularity among consumers seeking ethical and cruelty-free options. Sun protection remains a crucial segment, with vegan certification becoming increasingly important for those who prefer products free from animal derivatives. Subscription boxes catering to personalized beauty needs offer convenience and customized recommendations, while hair styling products continue to evolve with innovative technologies and natural ingredients.
Body lotions, body washes, and personal care products catering to these preferences are gaining traction. Luxury cosmetics, driven by innovation and exclusivity, continue to attract consumers. Mineral makeup, prescription cosmetics, and anti-aging skincare catering to specific needs are also popular. Hair care, including hair dye, hair styling tools, and treatments, remains a significant segment. Augmented reality and virtual try-on technologies are transforming the shopping experience, allowing customers to test products virtually before purchasing.
Acne treatment, nail polish, and beauty tools are other essential segments in the cosmetics market. Skin analysis, allergy testing, and safety testing ensure the production of high-quality and safe cosmetics. Regulatory compliance and clinical trials are crucial for brands to establish credibility and trust with consumers. Mass market cosmetics and online retailers cater to a broad consumer base, while beauty salons offer professional services and personalized recommendations. Artificial intelligence and personalized skincare are emerging trends, offering customized solutions for individual skin types. Content marketing and product reviews play a vital role in consumer decision-making. The cosmetics market in the US is witnessing a shift towards personalized, ethical, and technologically advanced products.
Consumers are increasingly seeking high-quality, natural, and vegan options, with a focus on convenience and customization. Brands that prioritize innovation, safety, and sustainability are likely to succeed in this evolving market.
Get a glance at the market share of various segments Request Free Sample
The Skincare products segment was valued at USD 5141.70 million in 2019 and showed a gradual increase during the forecast period.
Market Dynamics
Our researchers analyzed the data with 2024 as the base year, along with the key drivers, trends, and challenges. A holistic analysis of drivers will help companies refine their marketing strategies to gain a competitive advantage.
What are the key market drivers leading to the rise in the adoption of Cosmetics Products in France Industry?
- The population demographic, specifically individuals aged between 30 and 50 years, serves as the primary catalyst for market growth. The cosmetics market is experiencing significant growth due to the increasing population in the 30-45 age group, who seek cosmetic skincare products to address aging-related concerns. Middle-aged individuals grapple with both intrinsic and extrinsic aging factors, leading to changes in skin appearance such as loss of elasticity, reduced collagen production, fine lines, wrinkles, and hyperpigmentation. Intrinsic aging is a natural part of the aging process, while extrinsic aging is caused by external factors like climate, pollution, stress, and unhealthy diets. To cater to this growing demand, cosmetic companies are focusing on innovative technologies such as virtual try-on and skin analysis to offer personalized recommendations.
- Moreover, there is a rising preference for cruelty-free certification and allergy testing to ensure safety and ethical production. Beauty tools, nail polish, lip gloss, and other beauty products continue to be popular categories, with a strong emphasis on safety testing to ensure product efficacy and consumer safety. Overall, the cosmetics market is expected to continue its growth trajectory, driven by consumer demand for effective and ethical skincare solutions.
What are the market trends shaping the Cosmetics Products in France Industry?
- The increasing demand for organic cosmetics and cosmeceuticals represents a significant market trend. Consumers are increasingly seeking out products made with natural ingredients and free from harsh chemicals, driving growth in this sector.
- The cosmetics market is witnessing a significant shift towards men's grooming, organic, and chemical-free products. Consumers are increasingly seeking cosmetics that are free from harsh chemicals and offer health benefits. Similarly, makeup brushes and vegan cosmetics, certified organic or vegan, are gaining popularity due to their ethical and health benefits. Sun protection is another crucial category, with consumers looking for effective and eco-friendly options. Subscription boxes offer a convenient solution for trying new products and discovering new brands. Brand ambassadors and influencers play a crucial role in promoting these products and creating awareness.
What challenges does the Cosmetics Products in France Industry face during its growth?
- The intense price competition among market players poses a significant challenge to the industry's growth trajectory. The cosmetics products market is witnessing intense competition, with established players and new entrants vying for market share. While some companies offer a range of cosmetics for both body care and personal grooming, the high growth potential of the industry continues to attract new players. In response to the increasing competition, several companies are adopting various strategies to gain a competitive edge. One such strategy is offering cosmetic products at reduced prices. For instance, L'Oreal's brand Garnier provides antioxidant products starting at USD4. This pricing strategy is expected to be prevalent during the forecast period as companies look to retain customers and differentiate themselves in the market.
- Moreover, consumer preferences are evolving, with a growing demand for cruelty-free, organic, and natural cosmetics. Influencer marketing and social media platforms are increasingly being used to reach out to consumers and build customer loyalty. Online retailers are also gaining popularity due to their convenience and wide product range. The cosmetics products market is dynamic, with companies adapting to changing consumer preferences and competition through various strategies.
Exclusive Customer Landscape
The cosmetics products market in France forecasting report includes the adoption lifecycle of the market, covering from the innovator's stage to the laggard's stage. It focuses on adoption rates in different regions based on penetration. Furthermore, the cosmetics products market in France report also includes key purchase criteria and drivers of price sensitivity to help companies evaluate and develop their market growth analysis strategies.
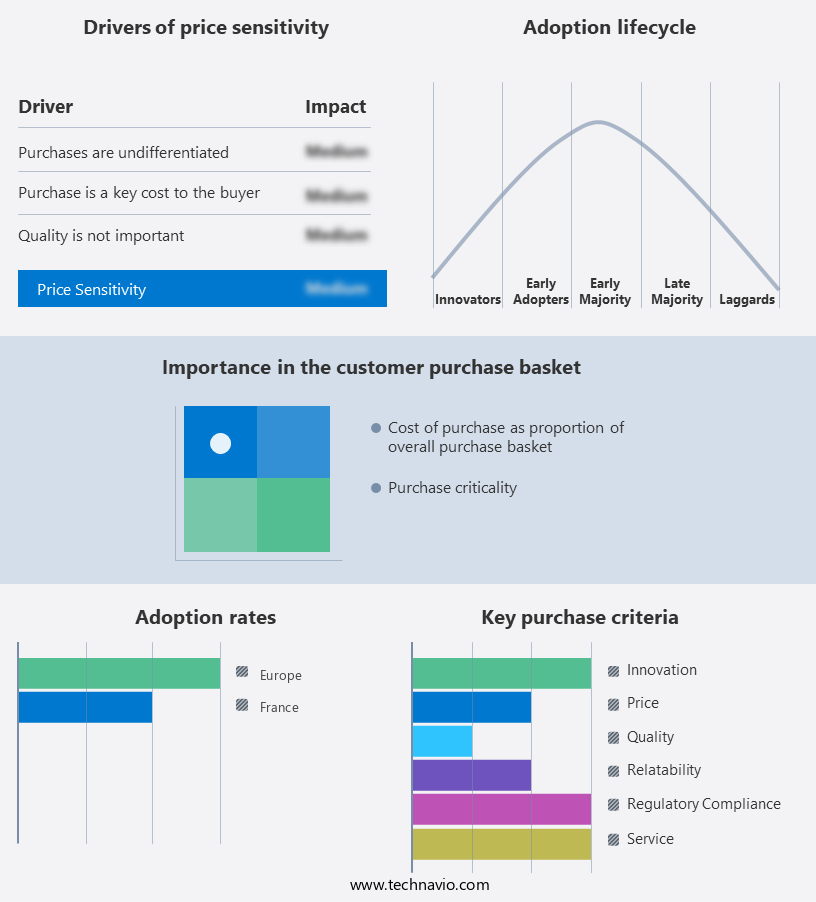
Customer Landscape
Key Companies & Market Insights
Companies are implementing various strategies, such as strategic alliances, cosmetics products market in France forecast, partnerships, mergers and acquisitions, geographical expansion, and product/service launches, to enhance their presence in the industry.
Amorepacific Corp. - This company specializes in the development and distribution of high-quality skincare and haircare solutions, catering to diverse age groups.
The industry research and growth report includes detailed analyses of the competitive landscape of the market and information about key companies, including:
- Amorepacific Corp.
- Amway Corp.
- Caudalie International SE
- Christian Louboutin LLC
- Embryolisse
- Johnson and Johnson
- Kao Corp.
- LABORATOIRES FILORGA COSMETIQUES
- LOccitane Groupe SA
- LOreal SA
- LVMH Moet Hennessy Louis Vuitton SE
- MacAndrews and Forbes Inc.
- maxingvest AG
- Oriflame Cosmetics S.A.
- PUIG S.L.
- Shiseido Co. Ltd.
- The Estee Lauder Co. Inc.
- The Procter and Gamble Co.
- Unilever PLC
- Yves Rocher
Qualitative and quantitative analysis of companies has been conducted to help clients understand the wider business environment as well as the strengths and weaknesses of key industry players. Data is qualitatively analyzed to categorize companies as pure play, category-focused, industry-focused, and diversified; it is quantitatively analyzed to categorize companies as dominant, leading, strong, tentative, and weak.
Recent Development and News in Cosmetics Products Market In France
- In February 2023, L'Oréal, the world's leading cosmetics company, introduced a new range of vegan and sustainable beauty products under its brand, Seed Phytonutrients. This launch signified a significant shift towards eco-conscious consumer preferences (L'Oréal Press Release, 2023).
- In June 2024, Estée Lauder Companies and Deciem, a popular independent beauty brand, announced a strategic partnership to expand Deciem's global reach and distribution. This collaboration aimed to capitalize on Deciem's innovative product offerings and Estée Lauder's extensive distribution network (Estée Lauder Companies Press Release, 2024).
- In October 2024, Coty Inc. completed the acquisition of a 60% stake in Kylie Jenner's Kylie Cosmetics for USD 600 million. This deal marked a major milestone in Coty's efforts to strengthen its presence in the lucrative celebrity-endorsed beauty market (Coty Inc. SEC Filing, 2024).
- In March 2025, the European Union passed a new regulation banning the sale of animal-tested cosmetics. This policy change was a significant step towards promoting cruelty-free cosmetics and aligning with evolving consumer values (European Commission Press Release, 2025).
Research Analyst Overview
The market continues to evolve, with various sectors experiencing dynamic shifts. Men's grooming products witness an increasing demand as societal norms evolve, offering a broad spectrum of offerings from skincare to hair styling. Makeup brushes undergo advancements, with innovations in materials and designs enhancing application precision. Vegan cosmetics gain traction as consumers prioritize ethical and sustainable options, leading to the rise of vegan certification bodies. Sun protection remains a priority, driving the development of advanced formulations and delivery systems. Subscription boxes cater to diverse preferences, delivering personalized selections of cosmetics and beauty products. Brand ambassadors and influencer marketing strategies amplify reach and engagement, while organic certification and cruelty-free certifications further cater to consumer preferences.
Body lotions, hair styling products, and mineral makeup continue to innovate, integrating natural ingredients and advanced technologies. Retail stores and online platforms adapt to consumer preferences, offering personalized skincare recommendations and virtual try-on features. Regulatory compliance and safety testing remain crucial, with clinical trials and product reviews shaping market trends. The market landscape for cosmetics is ever-changing, with ongoing advancements in personal care, anti-aging skincare, hair care, and nail polish. Emerging trends include augmented reality, prescription cosmetics, and personalized recommendations, reflecting the industry's continuous commitment to meeting evolving consumer needs.
The Cosmetics Products Market in France is thriving as consumers seek personalized beauty solutions. Understanding skin type is key to selecting the right products, ensuring effective results. A well-planned skincare routine helps maintain healthy skin, while a structured beauty routine enhances overall appearance and confidence. The market is driven by beauty innovation, with brands introducing cutting-edge formulations and technologies to meet evolving customer preferences. A strong beauty community fosters engagement, influencing trends and product development. Sustainability is gaining importance, with companies focusing on recyclable materials to reduce environmental impact.
Dive into Technavio's robust research methodology, blending expert interviews, extensive data synthesis, and validated models for unparalleled Cosmetics Products Market in France insights. See full methodology.
|
Market Scope |
|
|
Report Coverage |
Details |
|
Page number |
178 |
|
Base year |
2024 |
|
Historic period |
2019-2023 |
|
Forecast period |
2025-2029 |
|
Growth momentum & CAGR |
Accelerate at a CAGR of 3.3% |
|
Market growth 2025-2029 |
USD 2.62 billion |
|
Market structure |
Fragmented |
|
YoY growth 2024-2025(%) |
3.2 |
|
Key countries |
France |
|
Competitive landscape |
Leading Companies, Market Positioning of Companies, Competitive Strategies, and Industry Risks, market research and growth, market growth and forecasting, Market forecasting, market report, market forecast |
What are the Key Data Covered in this Cosmetics Products Market in France Research and Growth Report?
- CAGR of the Cosmetics Products in France industry during the forecast period
- Detailed information on factors that will drive the growth and forecasting between 2025 and 2029
- Precise estimation of the size of the market and its contribution of the industry in focus to the parent market
- Accurate predictions about upcoming growth and trends and changes in consumer behaviour
- Growth of the market across France
- Thorough analysis of the market's competitive landscape and detailed information about companies
- Comprehensive analysis of factors that will challenge the cosmetics products market in France growth of industry companies
We can help! Our analysts can customize this cosmetics products market in France research report to meet your requirements.
 RIA -
RIA - 
