Crop Monitoring Devices Market Analysis North America, Europe, APAC, South America, Middle East and Africa - US, China, Japan, Germany, France - Size and Forecast 2024-2028

Crop Monitoring Devices Market Analysis North America, Europe, APAC, South America, Middle East and Africa - US, China, Japan, Germany, France - Size and Forecast 2024-2028

Published: Jan 2024 174 Pages SKU: IRTNTR77281

Market Overview at a Glance

$762.17 Mn
Market Opportunity
7.74%
CAGR
6.65
YoY growth 2023-2024(%)

Crop Monitoring Devices Market Size 2024-2028 

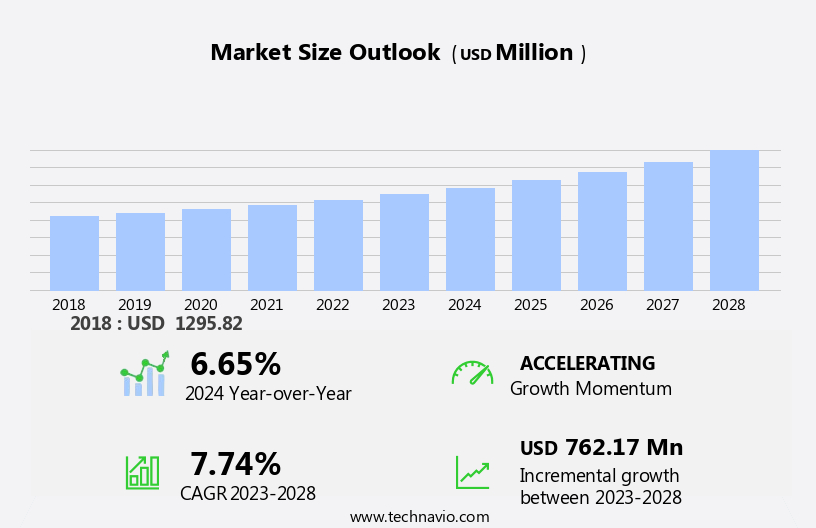
The crop monitoring devices market size is forecast to increase by USD 762.17 million at a CAGR of 7.74% between 2023 and 2028.

  • The market is experiencing significant growth due to the increasing prioritization of food security and safety in the agriculture sector. With the integration of advanced technologies such as Geo-positioning, the Internet of Things (IoT), and Artificial Intelligence (AI), farmers can now effectively monitor farm conditions in real-time. These devices enable the assessment of in-field crop health, soil moisture, water levels, weather status, fuel levels, and more. The adoption of these solutions is on the rise as farmers seek to enhance productivity and efficiency in their operations. However, a lack of awareness among farmers regarding these new technologies presents a challenge to market growth. Despite this, the potential benefits of these devices are undeniable, making them a valuable investment for farmers and the agriculture industry as a whole. By leveraging the power of AI and Machine Learning (ML), these devices offer accurate and timely insights, enabling farmers to make informed decisions and optimize their resources. Incorporating these technologies into crop monitoring devices is a key trend driving market growth.

What will be the Size of the Market During the Forecast Period?

Crop Monitoring Devices Market Size

 Request Free Sample

  • The market is witnessing significant growth as farmers in both rural and urban areas seek to improve farm productivity and profitability. The implementation of digital agriculture automation and robotics technologies is bridging the digital divide between tech-savvy farmers and those with limited resources. Labor shortages in manufacturing facilities have accelerated the need for automation in agriculture. Medium-sized farms are increasingly adopting crop monitoring devices to optimize their operations and achieve economies of scale. These devices utilize intelligent sensors to collect real-time data on crop health, soil moisture, and weather conditions.
  • The use of crop monitoring devices offers numerous benefits. By providing farmers with actionable insights, these technologies enable timely interventions to mitigate potential crop losses. Additionally, they help farmers make informed decisions regarding irrigation, fertilization, and pest management. The APAC region is a major market for crop monitoring devices due to its large agricultural sector and growing investment in digital agriculture. Government reforms and subsidies are also driving adoption in Southeast Asian countries. Digitization is transforming agriculture, allowing farmers to make data-driven decisions and improve overall efficiency. Crop monitoring devices are a crucial component of this digital transformation, providing farmers with valuable insights to enhance their returns.

How is this market segmented and which is the largest segment?

The market research report provides comprehensive data (region-wise segment analysis), with forecasts and estimates in "USD billion" for the period 2024-2028, as well as historical data from 2018-2022 for the following segments.

  • Area
    • Medium-sized
    • Large-sized
    • Small-sized
  • Product
    • Sensing and monitoring devices
    • Automation and control
    • Drones and others
  • Geography
    • North America
      • US
    • Europe
      • Germany
      • France
    • APAC
      • China
      • Japan
    • South America
    • Middle East and Africa

By Area Insights

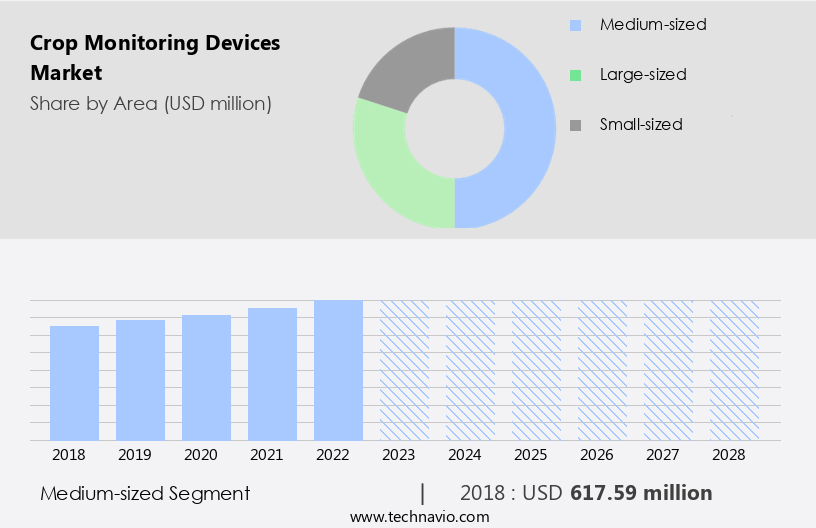
  • The medium-sized segment is estimated to witness significant growth during the forecast period.

Medium-sized agricultural holdings have witnessed notable expansion over the last decade, particularly in Africa. In Kenya, Ghana, Tanzania, and Zambia, approximately 20%, 32%, 39%, and over 50% of the agricultural land, respectively, comprises medium-sized farms. This trend is driven by the increasing number of urban-based farmers or influencers, linked to burgeoning urban populations and escalating food demand. This growth is anticipated to fuel the expansion of the medium-sized farms segment in The market. Intelligent sensors play a pivotal role in this context, enabling farmers to monitor temperatures and moisture levels in their soil effectively. Companies such as Sensoterra provide advanced solutions to facilitate data collection and in-field observations.

Furthermore, these devices are essential for farmers to optimize crop yields and maintain soil health, thereby contributing to the market's growth. The market is expected to experience substantial growth during the forecast period due to the increasing demand for efficient farming practices and the need for accurate data to inform decision-making.

Crop Monitoring Devices Market Size

Get a glance at the market report of share of various segments Request Free Sample

The medium-sized segment was valued at USD 617.59 million in 2018 and showed a gradual increase during the forecast period.

Regional Analysis

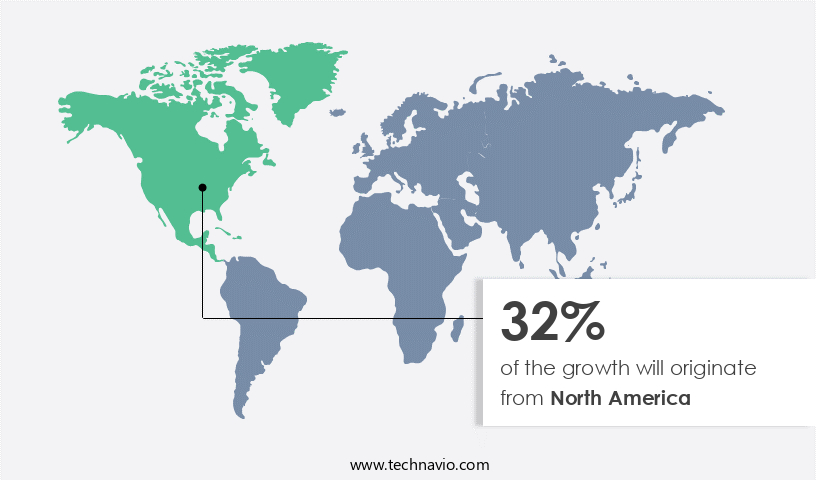
  • North America is estimated to contribute 32% to the growth of the global market during the forecast period.

Technavio's analysts have elaborately explained the regional trends and drivers that shape the market during the forecast period.

Crop Monitoring Devices Market Share by Geography

For more insights on the market share of various regions Request Free Sample

In the United States, the agricultural sector is witnessing significant advancements due to government initiatives and the adoption of modern technologies. For instance, the National Institute of Food and Agriculture (NIFA), a part of the US Department of Agriculture (USDA), is promoting the use of geospatial, sensor, and precision technology projects to increase farm productivity and profitability. The implementation of cloud-based technology and the increasing popularity of smart farming techniques are key factors driving the growth of the market in the region. Furthermore, the Canadian government is supporting precision agriculture through financial incentives. The demand for food production to meet the needs of an expanding population is another significant factor fueling market expansion. Despite the digital divide between rural and urban areas, unskilled farmers are increasingly adopting tech-savvy solutions to mitigate labor shortages in manufacturing facilities. The market in North America is poised for steady growth due to these factors.

Market Dynamics

Our researchers analyzed the data with 2023 as the base year, along with the key drivers, trends, and challenges. A holistic analysis of drivers will help companies refine their marketing strategies to gain a competitive advantage.

What are the key market drivers leading to the rise in adoption of Crop Monitoring Devices Market?

Growing focus on increasing productivity and efficiency in agriculture sector is the key driver of the market.

  • Crop monitoring devices, driven by automation and digitization, are revolutionizing digital agriculture in the US and beyond. These technologies enable farms, particularly medium-sized ones, to execute tasks with minimal human intervention, leading to increased productivity and efficiency. By deploying self-driving vehicles and automation and robotics, farmers can reduce downtime and focus on other essential farm-related tasks.
  • Economies of scale are also attainable as multiple devices work in unison, enhancing the overall efficiency of the farming business. Agricultural mechanization, a crucial aspect of modernizing agriculture, is increasingly replacing labor-intensive farming practices. Machines, such as those offered by Trimble and John Deere, are transforming the agricultural landscape by optimizing the utilization of farm implements, thereby improving farm productivity.

What are the market trends shaping the Crop Monitoring Devices Market?

The incorporation of AI and ML into crop monitoring devices is the upcoming trend in the market.

  • The integration of geo-positioning technology and the Internet of Things (IoT) is transforming the market in the United States. Artificial intelligence (AI) and machine learning (ML) technologies enable these systems to gather, process, and analyze data more intelligently, resulting in more accurate pest management and improved crop health. In real-time, these technologies assist in interpreting complex scenarios for robots used in farm monitoring.
  • AI and ML capabilities include resource usage planning, maximizing crop yields, and analyzing soil moisture, water levels, and weather status. Furthermore, they automate farm management, optimize workflow, and provide valuable insights on animal health and species management. These advancements contribute significantly to food security and safety in the agricultural sector. 

What challenges does Crop Monitoring Devices Market face during the growth?

Lack of awareness among farmers regarding new technologies in farming is a key challenge affecting the market growth.

  • Advanced crop monitoring devices employ intelligent sensors and connected technologies to provide farmers with data-driven insights for optimizing crop production. However, the agricultural sector faces challenges in adopting these solutions due to a lack of awareness. Inconsistencies in crop monitoring can lead to significant resource losses and crop damage. These inconsistencies may result from various factors, including the movement of pests, changes in illumination, camera focus, and the presence of non-pest organisms or other objects. Image processing in crop monitoring devices involves several steps, including image capturing, pre-processing, conversion to grayscale, resizing, and filtering.
  • These processes enable accurate identification and analysis of crop health, pests, and other factors affecting yield. Government reforms and initiatives aimed at promoting agricultural technology adoption can help bridge the gap and encourage farmers to invest in crop monitoring solutions. By leveraging these advanced tools, farmers can minimize crop losses and enhance overall productivity. In conclusion, crop monitoring devices play a crucial role in optimizing agricultural production by providing farmers with real-time insights into crop health and pest infestations. Despite their benefits, the adoption of these solutions remains limited due to a lack of awareness. To address this challenge, government initiatives, educational programs, and industry collaborations can help promote the adoption of crop monitoring devices and improve overall agricultural productivity.

Exclusive Customer Landscape

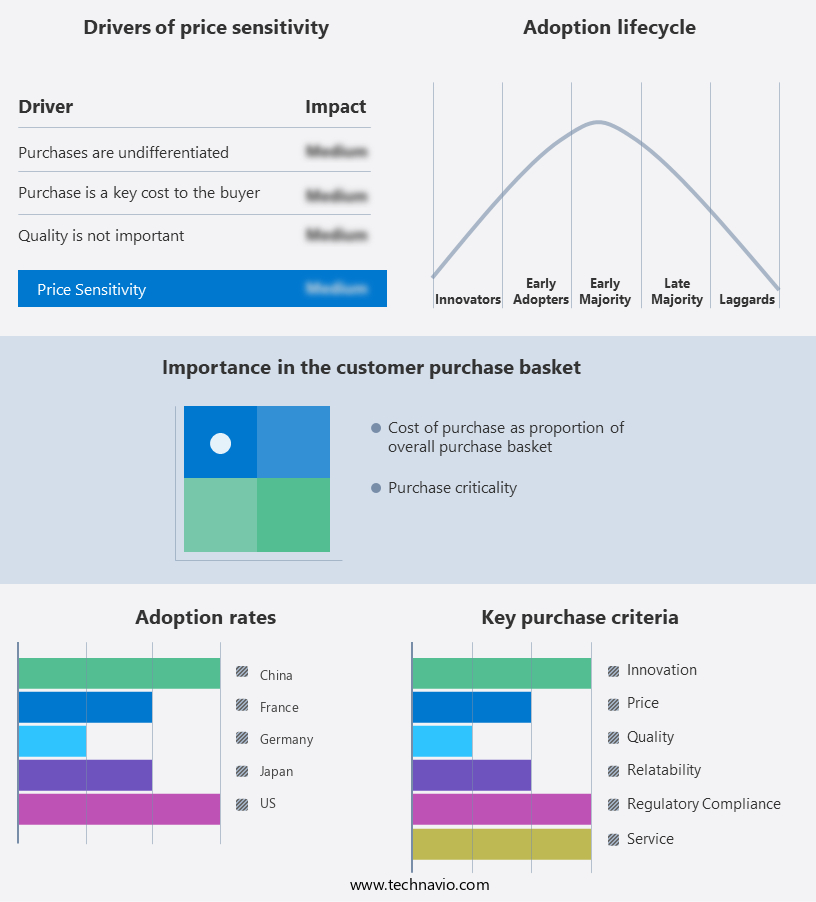
The market forecasting report includes the adoption lifecycle of the market, covering from the innovator's stage to the laggard's stage. It focuses on adoption rates in different regions based on penetration. Furthermore, the market report also includes key purchase criteria and drivers of price sensitivity to help companies evaluate and develop their market growth analysis strategies.

Crop Monitoring Devices Market Share by Geography

 Customer Landscape

Key Companies & Market Insights

Companies are implementing various strategies, such as strategic alliances, market forecast, partnerships, mergers and acquisitions, geographical expansion, and product/service launches, to enhance their presence in the market. The market research and growth report includes detailed analyses of the competitive landscape of the market and information about key companies, including:

  • Ag Leader Technology
  • AGCO Corp.
  • Chengdu JOUAV Automation Tech Co. Ltd.
  • CNH Industrial NV
  • CropX Technologies Ltd.
  • Deere and Co.
  • Hunan Rika Electronic Tech Co. Ltd.
  • Libelium Comunicaciones Distribuidas SL
  • MaxBotix Inc.
  • Meropy
  • METOS
  • Parrot Drones SAS
  • Sentera Inc.
  • Supertech Agroline ApS
  • Swift Sensors BV
  • Topcon Corp.
  • Trimble Inc.
  • TSI Inc.
  • Vyaprut Pvt. Ltd.
  • Yara International ASA

Qualitative and quantitative analysis of companies has been conducted to help clients understand the wider business environment as well as the strengths and weaknesses of key market players. Data is qualitatively analyzed to categorize companies as pure play, category-focused, industry-focused, and diversified; it is quantitatively analyzed to categorize companies as dominant, leading, strong, tentative, and weak.

Research Analyst Overview

Crop monitoring devices have become essential tools for farmers in both rural and urban areas to enhance farm productivity and profitability. Advanced technologies, such as digital agriculture, automation, and robotics, are revolutionizing agriculture by providing real-time data-driven insights. The digital divide between tech-savvy farmers and those with limited resources is being bridged by the availability of affordable and user-friendly crop monitoring solutions. Labor shortages in manufacturing facilities have led to the automation and digitization of various processes, including crop monitoring. Medium-sized farms are reaping the benefits of economies of scale by implementing these solutions. Returns on investment are significant, as farmers can minimize crop losses through early detection of issues and make necessary adjustments on time.

Furthermore, Southeast Asian countries are witnessing a rise in the adoption of crop monitoring devices, with governments implementing reforms to promote digital agriculture. Intelligent sensors and connected technologies are being used to collect data on soil moisture, water levels, weather status, fuel levels, in-field crop health, temperatures, and other critical parameters. Farmers can access this information through smartphones or computers, enabling them to make informed decisions and improve crop growth performance. IoT and AI-based devices are the latest advancements in crop monitoring, with smart sensors and remote sensors providing real-time information on humidity, air temperature, soil quality, yields, irrigation, and harvests. These devices are transforming agricultural management, making it more efficient, sustainable, and profitable.

Market Scope

Report Coverage

Details

Page number

174

Base year

2023

Historic period

2018-2022

Forecast period

2024-2028

Growth momentum & CAGR

Accelerate at a CAGR of 7.74%

Market Growth 2024-2028

USD 762.17 million

Market structure

Fragmented

YoY growth 2023-2024(%)

6.65

Key countries

US, China, Japan, Germany, and France

Competitive landscape

Leading Companies, Market Positioning of Companies, Competitive Strategies, and Industry Risks

Request Free Sample

What are the Key Data Covered in this Market Research and Growth Report?

  • CAGR of the market during the forecast period
  • Detailed information on factors that will drive the market growth and forecasting between 2024 and 2028
  • Precise estimation of the size of the market  and its contribution of the market in focus to the parent market
  • Accurate predictions about upcoming market growth and trends and changes in consumer behaviour
  • Growth of the market across North America, Europe, APAC, South America, and Middle East and Africa
  • Thorough analysis of the market's competitive landscape and detailed information about companies
  • Comprehensive analysis of factors that will challenge the growth of market companies

We can help! Our analysts can customize this market research report to meet your requirements. Get in touch

1 Executive Summary

  • 1.1 Market overview
    • Exhibit 01: Executive Summary – Chart on Market Overview
    • Exhibit 02: Executive Summary – Data Table on Market Overview
    • Exhibit 03: Executive Summary – Chart on Global Market Characteristics
    • Exhibit 04: Executive Summary – Chart on Market by Geography
    • Exhibit 05: Executive Summary – Chart on Market Segmentation by Area
    • Exhibit 06: Executive Summary – Chart on Market Segmentation by Product
    • Exhibit 07: Executive Summary – Chart on Incremental Growth
    • Exhibit 08: Executive Summary – Data Table on Incremental Growth
    • Exhibit 09: Executive Summary – Chart on Vendor Market Positioning

2 Market Landscape

  • 2.1 Market ecosystem
    • Exhibit 10: Parent market
    • Exhibit 11: Market Characteristics

3 Market Sizing

  • 3.1 Market definition
    • Exhibit 12: Offerings of vendors included in the market definition
  • 3.2 Market segment analysis
    • Exhibit 13: Market segments
  • 3.3 Market size 2023
    • 3.4 Market outlook: Forecast for 2023-2028
      • Exhibit 14: Chart on Global - Market size and forecast 2023-2028 ($ million)
      • Exhibit 15: Data Table on Global - Market size and forecast 2023-2028 ($ million)
      • Exhibit 16: Chart on Global Market: Year-over-year growth 2023-2028 (%)
      • Exhibit 17: Data Table on Global Market: Year-over-year growth 2023-2028 (%)

    4 Historic Market Size

    • 4.1 Global crop monitoring devices market 2018 - 2022
      • Exhibit 18: Historic Market Size – Data Table on global crop monitoring devices market 2018 - 2022 ($ million)
    • 4.2 Area Segment Analysis 2018 - 2022
      • Exhibit 19: Historic Market Size – Area Segment 2018 - 2022 ($ million)
    • 4.3 Product Segment Analysis 2018 - 2022
      • Exhibit 20: Historic Market Size – Product Segment 2018 - 2022 ($ million)
    • 4.4 Geography Segment Analysis 2018 - 2022
      • Exhibit 21: Historic Market Size – Geography Segment 2018 - 2022 ($ million)
    • 4.5 Country Segment Analysis 2018 - 2022
      • Exhibit 22: Historic Market Size – Country Segment 2018 - 2022 ($ million)

    5 Five Forces Analysis

    • 5.1 Five forces summary
      • Exhibit 23: Five forces analysis - Comparison between 2023 and 2028
    • 5.2 Bargaining power of buyers
      • Exhibit 24: Chart on Bargaining power of buyers – Impact of key factors 2023 and 2028
    • 5.3 Bargaining power of suppliers
      • Exhibit 25: Bargaining power of suppliers – Impact of key factors in 2023 and 2028
    • 5.4 Threat of new entrants
      • Exhibit 26: Threat of new entrants – Impact of key factors in 2023 and 2028
    • 5.5 Threat of substitutes
      • Exhibit 27: Threat of substitutes – Impact of key factors in 2023 and 2028
    • 5.6 Threat of rivalry
      • Exhibit 28: Threat of rivalry – Impact of key factors in 2023 and 2028
    • 5.7 Market condition
      • Exhibit 29: Chart on Market condition - Five forces 2023 and 2028

    6 Market Segmentation by Area

    • 6.1 Market segments
      • Exhibit 30: Chart on Area - Market share 2023-2028 (%)
      • Exhibit 31: Data Table on Area - Market share 2023-2028 (%)
    • 6.2 Comparison by Area
      • Exhibit 32: Chart on Comparison by Area
      • Exhibit 33: Data Table on Comparison by Area
    • 6.3 Medium-sized - Market size and forecast 2023-2028
      • Exhibit 34: Chart on Medium-sized - Market size and forecast 2023-2028 ($ million)
      • Exhibit 35: Data Table on Medium-sized - Market size and forecast 2023-2028 ($ million)
      • Exhibit 36: Chart on Medium-sized - Year-over-year growth 2023-2028 (%)
      • Exhibit 37: Data Table on Medium-sized - Year-over-year growth 2023-2028 (%)
    • 6.4 Large-sized - Market size and forecast 2023-2028
      • Exhibit 38: Chart on Large-sized - Market size and forecast 2023-2028 ($ million)
      • Exhibit 39: Data Table on Large-sized - Market size and forecast 2023-2028 ($ million)
      • Exhibit 40: Chart on Large-sized - Year-over-year growth 2023-2028 (%)
      • Exhibit 41: Data Table on Large-sized - Year-over-year growth 2023-2028 (%)
    • 6.5 Small-sized - Market size and forecast 2023-2028
      • Exhibit 42: Chart on Small-sized - Market size and forecast 2023-2028 ($ million)
      • Exhibit 43: Data Table on Small-sized - Market size and forecast 2023-2028 ($ million)
      • Exhibit 44: Chart on Small-sized - Year-over-year growth 2023-2028 (%)
      • Exhibit 45: Data Table on Small-sized - Year-over-year growth 2023-2028 (%)
    • 6.6 Market opportunity by Area
      • Exhibit 46: Market opportunity by Area ($ million)
      • Exhibit 47: Data Table on Market opportunity by Area ($ million)

    7 Market Segmentation by Product

    • 7.1 Market segments
      • Exhibit 48: Chart on Product - Market share 2023-2028 (%)
      • Exhibit 49: Data Table on Product - Market share 2023-2028 (%)
    • 7.2 Comparison by Product
      • Exhibit 50: Chart on Comparison by Product
      • Exhibit 51: Data Table on Comparison by Product
    • 7.3 Sensing and monitoring devices - Market size and forecast 2023-2028
      • Exhibit 52: Chart on Sensing and monitoring devices - Market size and forecast 2023-2028 ($ million)
      • Exhibit 53: Data Table on Sensing and monitoring devices - Market size and forecast 2023-2028 ($ million)
      • Exhibit 54: Chart on Sensing and monitoring devices - Year-over-year growth 2023-2028 (%)
      • Exhibit 55: Data Table on Sensing and monitoring devices - Year-over-year growth 2023-2028 (%)
    • 7.4 Automation and control - Market size and forecast 2023-2028
      • Exhibit 56: Chart on Automation and control - Market size and forecast 2023-2028 ($ million)
      • Exhibit 57: Data Table on Automation and control - Market size and forecast 2023-2028 ($ million)
      • Exhibit 58: Chart on Automation and control - Year-over-year growth 2023-2028 (%)
      • Exhibit 59: Data Table on Automation and control - Year-over-year growth 2023-2028 (%)
    • 7.5 Drones and others - Market size and forecast 2023-2028
      • Exhibit 60: Chart on Drones and others - Market size and forecast 2023-2028 ($ million)
      • Exhibit 61: Data Table on Drones and others - Market size and forecast 2023-2028 ($ million)
      • Exhibit 62: Chart on Drones and others - Year-over-year growth 2023-2028 (%)
      • Exhibit 63: Data Table on Drones and others - Year-over-year growth 2023-2028 (%)
    • 7.6 Market opportunity by Product
      • Exhibit 64: Market opportunity by Product ($ million)
      • Exhibit 65: Data Table on Market opportunity by Product ($ million)

    8 Customer Landscape

    • 8.1 Customer landscape overview
      • Exhibit 66: Analysis of price sensitivity, lifecycle, customer purchase basket, adoption rates, and purchase criteria

    9 Geographic Landscape

    • 9.1 Geographic segmentation
      • Exhibit 67: Chart on Market share by geography 2023-2028 (%)
      • Exhibit 68: Data Table on Market share by geography 2023-2028 (%)
    • 9.2 Geographic comparison
      • Exhibit 69: Chart on Geographic comparison
      • Exhibit 70: Data Table on Geographic comparison
    • 9.3 North America - Market size and forecast 2023-2028
      • Exhibit 71: Chart on North America - Market size and forecast 2023-2028 ($ million)
      • Exhibit 72: Data Table on North America - Market size and forecast 2023-2028 ($ million)
      • Exhibit 73: Chart on North America - Year-over-year growth 2023-2028 (%)
      • Exhibit 74: Data Table on North America - Year-over-year growth 2023-2028 (%)
    • 9.4 Europe - Market size and forecast 2023-2028
      • Exhibit 75: Chart on Europe - Market size and forecast 2023-2028 ($ million)
      • Exhibit 76: Data Table on Europe - Market size and forecast 2023-2028 ($ million)
      • Exhibit 77: Chart on Europe - Year-over-year growth 2023-2028 (%)
      • Exhibit 78: Data Table on Europe - Year-over-year growth 2023-2028 (%)
    • 9.5 APAC - Market size and forecast 2023-2028
      • Exhibit 79: Chart on APAC - Market size and forecast 2023-2028 ($ million)
      • Exhibit 80: Data Table on APAC - Market size and forecast 2023-2028 ($ million)
      • Exhibit 81: Chart on APAC - Year-over-year growth 2023-2028 (%)
      • Exhibit 82: Data Table on APAC - Year-over-year growth 2023-2028 (%)
    • 9.6 South America - Market size and forecast 2023-2028
      • Exhibit 83: Chart on South America - Market size and forecast 2023-2028 ($ million)
      • Exhibit 84: Data Table on South America - Market size and forecast 2023-2028 ($ million)
      • Exhibit 85: Chart on South America - Year-over-year growth 2023-2028 (%)
      • Exhibit 86: Data Table on South America - Year-over-year growth 2023-2028 (%)
    • 9.7 Middle East and Africa - Market size and forecast 2023-2028
      • Exhibit 87: Chart on Middle East and Africa - Market size and forecast 2023-2028 ($ million)
      • Exhibit 88: Data Table on Middle East and Africa - Market size and forecast 2023-2028 ($ million)
      • Exhibit 89: Chart on Middle East and Africa - Year-over-year growth 2023-2028 (%)
      • Exhibit 90: Data Table on Middle East and Africa - Year-over-year growth 2023-2028 (%)
    • 9.8 US - Market size and forecast 2023-2028
      • Exhibit 91: Chart on US - Market size and forecast 2023-2028 ($ million)
      • Exhibit 92: Data Table on US - Market size and forecast 2023-2028 ($ million)
      • Exhibit 93: Chart on US - Year-over-year growth 2023-2028 (%)
      • Exhibit 94: Data Table on US - Year-over-year growth 2023-2028 (%)
    • 9.9 China - Market size and forecast 2023-2028
      • Exhibit 95: Chart on China - Market size and forecast 2023-2028 ($ million)
      • Exhibit 96: Data Table on China - Market size and forecast 2023-2028 ($ million)
      • Exhibit 97: Chart on China - Year-over-year growth 2023-2028 (%)
      • Exhibit 98: Data Table on China - Year-over-year growth 2023-2028 (%)
    • 9.10 Germany - Market size and forecast 2023-2028
      • Exhibit 99: Chart on Germany - Market size and forecast 2023-2028 ($ million)
      • Exhibit 100: Data Table on Germany - Market size and forecast 2023-2028 ($ million)
      • Exhibit 101: Chart on Germany - Year-over-year growth 2023-2028 (%)
      • Exhibit 102: Data Table on Germany - Year-over-year growth 2023-2028 (%)
    • 9.11 France - Market size and forecast 2023-2028
      • Exhibit 103: Chart on France - Market size and forecast 2023-2028 ($ million)
      • Exhibit 104: Data Table on France - Market size and forecast 2023-2028 ($ million)
      • Exhibit 105: Chart on France - Year-over-year growth 2023-2028 (%)
      • Exhibit 106: Data Table on France - Year-over-year growth 2023-2028 (%)
    • 9.12 Japan - Market size and forecast 2023-2028
      • Exhibit 107: Chart on Japan - Market size and forecast 2023-2028 ($ million)
      • Exhibit 108: Data Table on Japan - Market size and forecast 2023-2028 ($ million)
      • Exhibit 109: Chart on Japan - Year-over-year growth 2023-2028 (%)
      • Exhibit 110: Data Table on Japan - Year-over-year growth 2023-2028 (%)
    • 9.13 Market opportunity by geography
      • Exhibit 111: Market opportunity by geography ($ million)
      • Exhibit 112: Data Tables on Market opportunity by geography ($ million)

    10 Drivers, Challenges, and Trends

    • 10.1 Market drivers
      • 10.2 Market challenges
        • 10.3 Impact of drivers and challenges
          • Exhibit 113: Impact of drivers and challenges in 2023 and 2028
        • 10.4 Market trends

          11 Vendor Landscape

          • 11.1 Overview
            • 11.2 Vendor landscape
              • Exhibit 114: Overview on Criticality of inputs and Factors of differentiation
            • 11.3 Landscape disruption
              • Exhibit 115: Overview on factors of disruption
            • 11.4 Industry risks
              • Exhibit 116: Impact of key risks on business

            12 Vendor Analysis

            • 12.1 Vendors covered
              • Exhibit 117: Vendors covered
            • 12.2 Market positioning of vendors
              • Exhibit 118: Matrix on vendor position and classification
            • 12.3 Ag Leader Technology
              • Exhibit 119: Ag Leader Technology - Overview
              • Exhibit 120: Ag Leader Technology - Product / Service
              • Exhibit 121: Ag Leader Technology - Key offerings
            • 12.4 AGCO Corp.
              • Exhibit 122: AGCO Corp. - Overview
              • Exhibit 123: AGCO Corp. - Business segments
              • Exhibit 124: AGCO Corp. - Key news
              • Exhibit 125: AGCO Corp. - Key offerings
              • Exhibit 126: AGCO Corp. - Segment focus
            • 12.5 CNH Industrial NV
              • Exhibit 127: CNH Industrial NV - Overview
              • Exhibit 128: CNH Industrial NV - Business segments
              • Exhibit 129: CNH Industrial NV - Key news
              • Exhibit 130: CNH Industrial NV - Key offerings
              • Exhibit 131: CNH Industrial NV - Segment focus
            • 12.6 CropX Technologies Ltd.
              • Exhibit 132: CropX Technologies Ltd. - Overview
              • Exhibit 133: CropX Technologies Ltd. - Product / Service
              • Exhibit 134: CropX Technologies Ltd. - Key offerings
            • 12.7 Deere and Co.
              • Exhibit 135: Deere and Co. - Overview
              • Exhibit 136: Deere and Co. - Business segments
              • Exhibit 137: Deere and Co. - Key news
              • Exhibit 138: Deere and Co. - Key offerings
              • Exhibit 139: Deere and Co. - Segment focus
            • 12.8 Hunan Rika Electronic Tech Co. Ltd.
              • Exhibit 140: Hunan Rika Electronic Tech Co. Ltd. - Overview
              • Exhibit 141: Hunan Rika Electronic Tech Co. Ltd. - Product / Service
              • Exhibit 142: Hunan Rika Electronic Tech Co. Ltd. - Key offerings
            • 12.9 Libelium Comunicaciones Distribuidas SL
              • Exhibit 143: Libelium Comunicaciones Distribuidas SL - Overview
              • Exhibit 144: Libelium Comunicaciones Distribuidas SL - Product / Service
              • Exhibit 145: Libelium Comunicaciones Distribuidas SL - Key offerings
            • 12.10 METOS
              • Exhibit 146: METOS - Overview
              • Exhibit 147: METOS - Product / Service
              • Exhibit 148: METOS - Key offerings
            • 12.11 Parrot Drones SAS
              • Exhibit 149: Parrot Drones SAS - Overview
              • Exhibit 150: Parrot Drones SAS - Product / Service
              • Exhibit 151: Parrot Drones SAS - Key offerings
            • 12.12 Supertech Agroline ApS
              • Exhibit 152: Supertech Agroline ApS - Overview
              • Exhibit 153: Supertech Agroline ApS - Product / Service
              • Exhibit 154: Supertech Agroline ApS - Key offerings
            • 12.13 Swift Sensors BV
              • Exhibit 155: Swift Sensors BV - Overview
              • Exhibit 156: Swift Sensors BV - Product / Service
              • Exhibit 157: Swift Sensors BV - Key offerings
            • 12.14 Topcon Corp.
              • Exhibit 158: Topcon Corp. - Overview
              • Exhibit 159: Topcon Corp. - Business segments
              • Exhibit 160: Topcon Corp. - Key news
              • Exhibit 161: Topcon Corp. - Key offerings
              • Exhibit 162: Topcon Corp. - Segment focus
            • 12.15 Trimble Inc.
              • Exhibit 163: Trimble Inc. - Overview
              • Exhibit 164: Trimble Inc. - Business segments
              • Exhibit 165: Trimble Inc. - Key offerings
              • Exhibit 166: Trimble Inc. - Segment focus
            • 12.16 TSI Inc.
              • Exhibit 167: TSI Inc. - Overview
              • Exhibit 168: TSI Inc. - Product / Service
              • Exhibit 169: TSI Inc. - Key offerings
            • 12.17 Yara International ASA
              • Exhibit 170: Yara International ASA - Overview
              • Exhibit 171: Yara International ASA - Business segments
              • Exhibit 172: Yara International ASA - Key news
              • Exhibit 173: Yara International ASA - Key offerings
              • Exhibit 174: Yara International ASA - Segment focus

            13 Appendix

            • 13.1 Scope of the report
              • 13.2 Inclusions and exclusions checklist
                • Exhibit 175: Inclusions checklist
                • Exhibit 176: Exclusions checklist
              • 13.3 Currency conversion rates for US$
                • Exhibit 177: Currency conversion rates for US$
              • 13.4 Research methodology
                • Exhibit 178: Research methodology
                • Exhibit 179: Validation techniques employed for market sizing
                • Exhibit 180: Information sources
              • 13.5 List of abbreviations
                • Exhibit 181: List of abbreviations

              Research Methodology

              Technavio presents a detailed picture of the market by way of study, synthesis, and summation of data from multiple sources. The analysts have presented the various facets of the market with a particular focus on identifying the key industry influencers. The data thus presented is comprehensive, reliable, and the result of extensive research, both primary and secondary.

              INFORMATION SOURCES

              Primary sources

              • Manufacturers and suppliers
              • Channel partners
              • Industry experts
              • Strategic decision makers

              Secondary sources

              • Industry journals and periodicals
              • Government data
              • Financial reports of key industry players
              • Historical data
              • Press releases

              DATA ANALYSIS

              Data Synthesis

              • Collation of data
              • Estimation of key figures
              • Analysis of derived insights

              Data Validation

              • Triangulation with data models
              • Reference against proprietary databases
              • Corroboration with industry experts

              REPORT WRITING

              Qualitative

              • Market drivers
              • Market challenges
              • Market trends
              • Five forces analysis

              Quantitative

              • Market size and forecast
              • Market segmentation
              • Geographical insights
              • Competitive landscape

              Interested in this report?

              Get your sample now to see our research methodology and insights!

              Download Now

              Frequently Asked Questions

              Crop Monitoring Devices market growth will increase by $ 762.17 mn during 2024-2028 .

              The Crop Monitoring Devices market is expected to grow at a CAGR of 7.74% during 2024-2028 .

              Crop Monitoring Devices market is segmented by Area( Medium-sized, Large-sized, Small-sized) Product( Sensing and monitoring devices, Automation and control, Drones and others)

              Ag Leader Technology, AGCO Corp., Chengdu JOUAV Automation Tech Co. Ltd., CNH Industrial NV, CropX Technologies Ltd., Deere and Co., Hunan Rika Electronic Tech Co. Ltd., Libelium Comunicaciones Distribuidas SL, MaxBotix Inc., Meropy, METOS, Parrot Drones SAS, Sentera Inc., Supertech Agroline ApS, Swift Sensors BV, Topcon Corp., Trimble Inc., TSI Inc., Vyaprut Pvt. Ltd., Yara International ASA are a few of the key vendors in the Crop Monitoring Devices market.

              North America will register the highest growth rate of 32% among the other regions. Therefore, the Crop Monitoring Devices market in North America is expected to garner significant business opportunities for the vendors during the forecast period.

              US, China, Japan, Germany, France

              • Growing focus on increasing productivity and efficiency in agriculture sectorThe ability of crop monitoring devices to perform tasks around the farm with little or no labor results in enhanced productivity and efficiency. For farmers is the driving factor this market.
              • this can mean less downtime is the driving factor this market.
              • which means they may focus on other day-to-day chores and live better. Moreover is the driving factor this market.
              • farmers can benefit from economies of scale when multiple self-driving vehicles are deployed on their farms is the driving factor this market.
              • which raises the overall efficiency of their business. Agricultural mechanization is important for the modernization of agriculture. Machines are steadily replacing people in agriculture in various countries and have significantly reshaped the agricultural landscape. The productivity of the farm has a direct relationship with the efficient utilization of farm implements. Agricultural mechanization is the process of utilizing agricultural machinery to mechanize work. It helps in improving the timeliness of operations and increases the quality of production. By maximizing harvest windows is the driving factor this market.
              • boosting productivity is the driving factor this market.
              • and expanding labor availability is the driving factor this market.
              • crop monitoring devices can have a substantial impact on agricultural yields and quality. Farmers can harvest their crops at the best time by maximizing their output and utilizing automation and machine learning technologies. Thus is the driving factor this market.
              • increasing focus on increasing productivity and efficiency in the agriculture sector will increase the deployment of crop monitoring devices and will drive the growth of the global crop monitoring devices market during the forecast period. is the driving factor this market.

              The Crop Monitoring Devices market vendors should focus on grabbing business opportunities from the Medium-sized segment as it accounted for the largest market share in the base year.