Crop Production Software Market Analysis North America, Europe, APAC, South America, Middle East and Africa - US, China, Australia, UK, Germany - Size and Forecast 2024-2028

Crop Production Software Market Analysis North America, Europe, APAC, South America, Middle East and Africa - US, China, Australia, UK, Germany - Size and Forecast 2024-2028

Published: Jan 2024 167 Pages SKU: IRTNTR77301

Market Overview at a Glance

$2.22 B
Market Opportunity
17.59%
CAGR
17.29
YoY growth 2023-2024(%)

Crop Production Software Market Size 2024-2028 

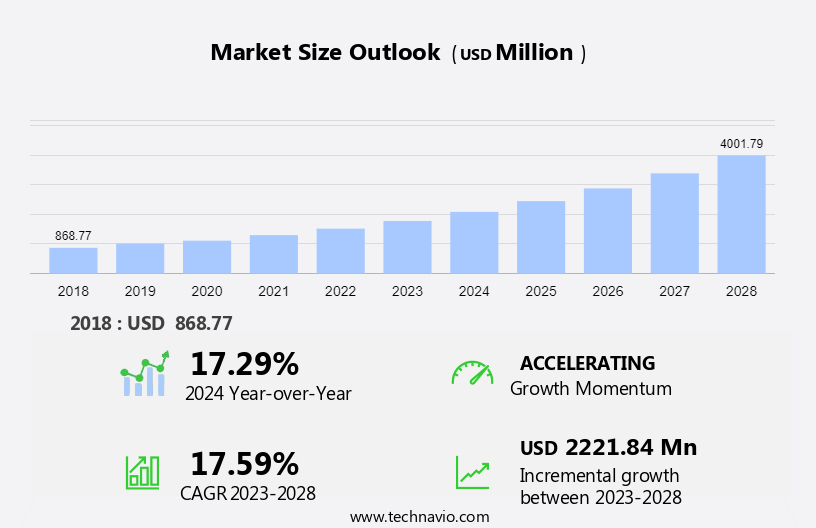
The crop production software market size is forecast to increase by USD 2.22 billion at a CAGR of 17.59% between 2023 and 2028.

  • The agricultural market is experiencing substantial growth due to several notable trends and challenges. One notable trend is the increasing use of precision farming, which employs advanced technologies to optimize crop yields and reduce waste. Another significant development is the integration of artificial intelligence (AI) and machine learning (ML) into crop production software. This innovation enables predictive analytics and the automation of farming processes, leading to improved efficiency and productivity. However, the substantial upfront capital investments required by farmers pose a significant barrier to market expansion. Despite this obstacle, the potential benefits of these technologies are compelling, making the agricultural sector an intriguing and dynamic area to monitor.

What will the size of the market be during the forecast period?

Crop Production Software Market Size

 Request Free Sample

  • The agribusiness sector is witnessing significant advancements in crop production, driven by the global population's increasing demand for food and the challenges of urbanization, climate change, and the depletion of arable land. Sustainable agriculture solutions, such as precision farming, real-time data collection and analysis, predictive modeling, monitoring, and control, are becoming essential for optimizing food production.
  • Companies are pioneering the use of Satellite IoT (SatIoT) and sensors, actuators, and devices to create greenhouses and monitor microclimates. Government investments in satellite imaging, in-field sensors, artificial intelligence, and machine learning are also playing a crucial role in developing regions. The integration of drones and Internet of Things (IoT) devices into crop production software is revolutionizing planting schedules and enhancing overall productivity in the agricultural sector.

How is this market segmented and which is the largest segment?

The market research report provides comprehensive data (region-wise segment analysis), with forecasts and estimates in "USD million" for the period 2024-2028, as well as historical data from 2018-2022 for the following segments.

  • Deployment
    • On-premises
    • Cloud
  • Type
    • Small
    • Medium
    • Large
  • Geography
    • North America
      • US
    • Europe
      • Germany
      • UK
    • APAC
      • China
    • South America
    • Middle East and Africa

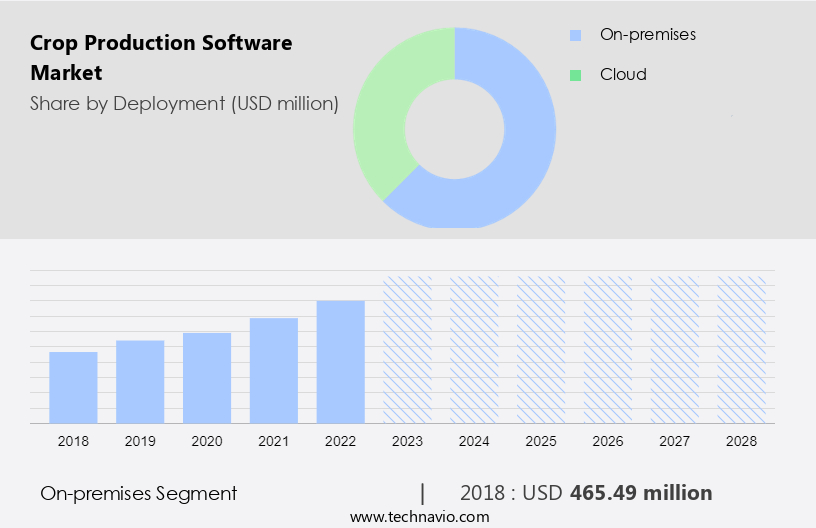
By Deployment Insights

  • The on-premises segment is estimated to witness significant growth during the forecast period.

Agribusinesses, farmers, ranchers, and growers worldwide are increasingly adopting crop production software to optimize food production in the face of global population growth, urbanization, climate change, and the need for sustainable agriculture. On-premises deployment of these solutions requires farmers to invest in hardware (servers, network equipment, security devices) and software, making it a significant upfront cost. However, the benefits include enhanced data security, real-time data collection and analysis, predictive modeling, monitoring, and control. Smart greenhouses utilize sensors, actuators, and devices to optimize microclimates, while Satellite IoT (SatIoT) and drones provide valuable data for precision farming.

Furthermore, in-field sensors, satellite imaging, and artificial intelligence enable advanced analytics and automation capabilities. Government investments in agriculture technology and cloud services facilitate the integration of mobile applications and data analysis tools. Despite the advantages, the high deployment costs may limit the adoption of on-premises crop production software, particularly in developing regions. However, the potential for increased efficiency, productivity, and profitability makes it an attractive option for agribusinesses and farmers alike. 

Crop Production Software Market Size

Get a glance at the market report of share of various segments Request Free Sample

The on-premises segment was valued at USD 465.49 million in 2018 and showed a gradual increase during the forecast period.
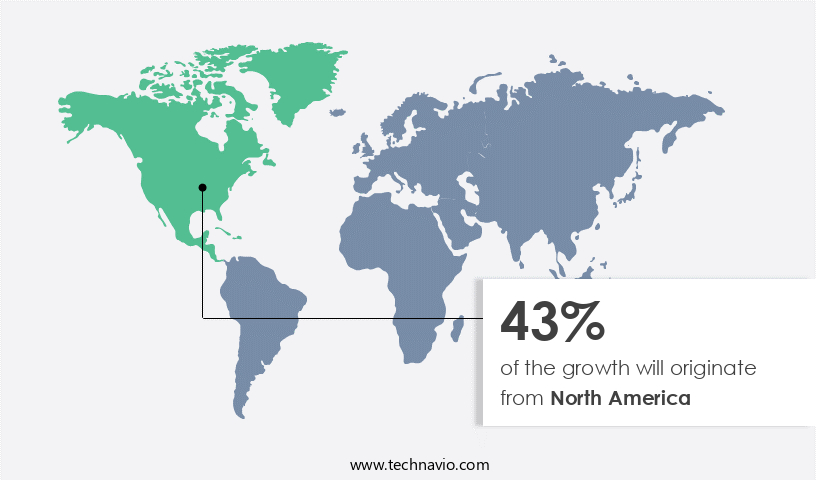
Regional Analysis

  • North America is estimated to contribute 43% to the growth of the global market during the forecast period.

Technavio's analysts have elaborately explained the regional trends and drivers that shape the market during the forecast period.

Crop Production Software Market Share by Geography

For more insights on the market share of various regions, Request Free Sample

The market is experiencing significant growth due to the integration of advanced technologies in agriculture. High-speed imagery services are becoming increasingly crucial for farmers to monitor crop quality and resource use, leading to improved precision in agriculture. This, in turn, helps in reducing input costs and enhancing food security. Sustainability is a key focus area, with weather conditions, temperatures, and moisture levels being closely monitored through software to optimize crop production. Crop prices are also influenced by these factors, making real-time data analysis essential for farmers. Government initiatives, such as those by the National Institute of Food and Agriculture (NIFA), are promoting the adoption of precision agriculture techniques, further driving market growth. Despite varying weather conditions and temperatures, the software enables farmers to make informed decisions based on accurate data, ensuring optimal crop productivity and ensuring global export of agricultural products.

Market Dynamics

Our researchers analyzed the data with 2023 as the base year, along with the key drivers, trends, and challenges. A holistic analysis of drivers will help companies refine their marketing strategies to gain a competitive advantage.

What are the key market drivers leading to the rise in the adoption of the Crop Production Software Market?

The growing popularity of precision farming is the key driver of the market.

  • Agribusinesses worldwide are embracing crop production software to optimize farm output and enhance crop yield with minimal input utilization. Farmers, ranchers, and growers leverage these tools for managing fertilizer applications, monitoring crops, and overseeing farm tasks. Real-time data collection and analysis, facilitated by sensors, actuators, and devices, enable farmers to make informed decisions regarding microclimate, moisture, and crop health. Global population growth, urbanization, climate change, and dwindling arable land necessitate sustainable agriculture practices, such as precision farming. Advanced technologies like predictive modeling, monitoring, and control systems are integral to precision farming. 
  • Government investments in agriculture technology and satellite imaging, coupled with in-field sensors and artificial intelligence, are revolutionizing agriculture. Drones and IoT devices are increasingly used for planting schedules, inventory management, and pest management. Incorporating advanced analytics and automation capabilities into cloud services and mobile applications streamlines data analysis and enhances overall farm management efficiency.

What are the market trends shaping the Crop Production Software Market?

The incorporation of AI and ML into crop production software is the upcoming trend in the market.

  • Agribusinesses worldwide are leveraging advanced technologies, including artificial intelligence (AI) and machine learning (ML), to enhance crop production software. This transformation is significantly impacting the global market, empowering farmers, ranchers, and growers to optimize food production for the burgeoning global population. The United Nations projects that urbanization and climate change will reduce arable land by 2050, necessitating sustainable agriculture and precision farming solutions. AI and ML enable these systems to collect, process, and analyze data in real-time, providing farmers with intelligent insights for resource usage, maximizing crop yield, and analyzing soil data. Predictive modeling, a key feature, anticipates pest infestations and crop disease outbreaks based on historical data, weather conditions, and pest lifecycles, enabling farmers to take preventative measures.
  • Smart greenhouses, sensors, actuators, and devices monitor microclimates, while satellite IoT (SatIoT) and drones collect data for advanced analytics. Government investments in smart agriculture solutions, such as Avirtech, Astrocast, and Avirlink, support the integration of AI and ML, enhancing automation capabilities, cloud services, and mobile applications. In-field sensors and inventory management systems further streamline operations, while pest management benefits from real-time monitoring and control. In developing regions, these technologies can revolutionize agriculture, improving planting schedules, reducing waste, and increasing overall efficiency. The integration of AI and ML in crop production software is a game-changer, ensuring food security and sustainable agriculture for the future.

What challenges does the Crop Production Software Market face during the growth?

The need for high initial capital investments by end-users is a key challenge affecting the market growth.

  • Agribusinesses worldwide are increasingly embracing advanced crop production techniques and software to enhance food production in response to the growing global population, urbanization, climate change, and the need for sustainable agriculture. However, the high costs associated with these solutions remain a significant barrier for farmers, ranchers, and growers, particularly in developing regions. The expenses encompass not only the purchase and implementation of smart farming tools but also the integration of these systems, data analytics tools, and training. The United Nations and various governments recognize the importance of precision farming, real-time data collection and analysis, predictive modeling, monitoring, and control in modern agriculture.
  • Technologies such as smart greenhouses, sensors, actuators, and devices enable farmers to optimize microclimates and improve crop yields. Satellite IoT (SatIoT), Astrocast, Avirtech, and other companies offer various smart agriculture solutions to help farmers make informed decisions based on accurate data. However, the costs of these advanced technologies can be prohibitive for many farmers. Government investments in satellite imaging, in-field sensors, artificial intelligence, and machine learning can help offset some of these expenses. Additionally, the use of drones, IoT devices, and mobile applications for planting schedules, inventory management, pest management, and advanced analytics can provide automation capabilities and cloud services to streamline farming operations.

Exclusive Customer Landscape

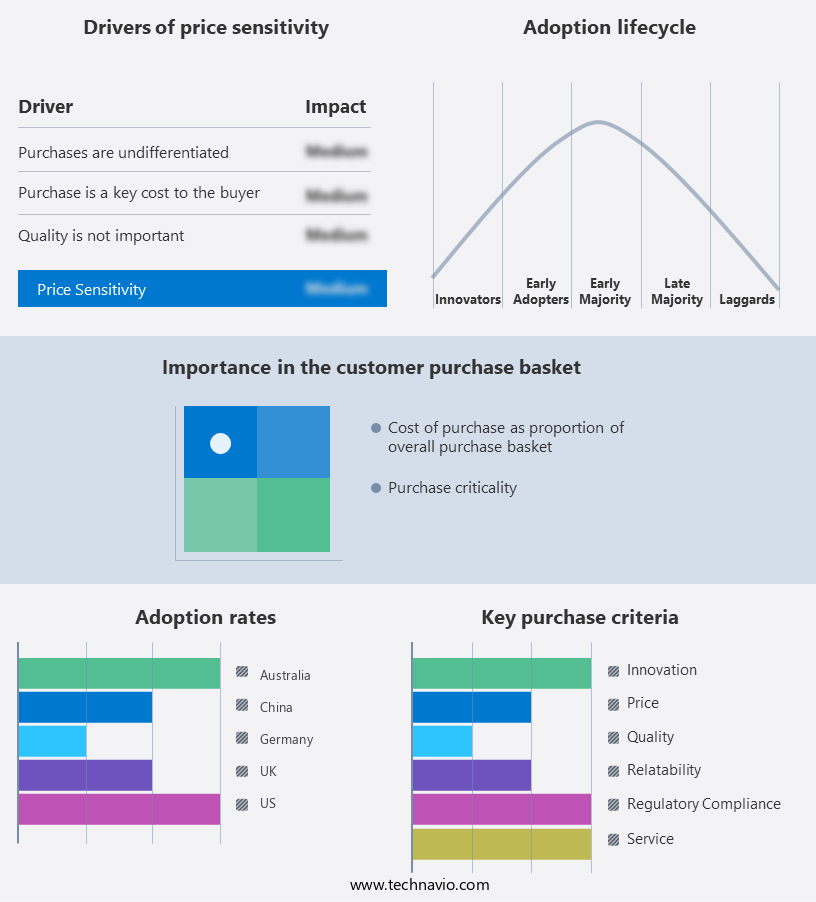
The market forecasting report includes the adoption lifecycle of the market, covering from the innovator's stage to the laggard's stage. It focuses on adoption rates in different regions based on penetration. Furthermore, the market report also includes key purchase criteria and drivers of price sensitivity to help companies evaluate and develop their market growth analysis strategies.

Crop Production Software Market Share by Geography

 Customer Landscape

Key Companies & Market Insights

Companies are implementing various strategies, such as strategic alliances, market forecast, partnerships, mergers and acquisitions, geographical expansion, and product/service launches, to enhance their presence in the market. The market research and growth report includes detailed analyses of the competitive landscape of the market and information about key companies, including:

  • Aerobotics Pty Ltd.
  • AgriApp
  • Agrivi d.o.o.
  • BASF SE
  • CNH Industrial NV
  • Conservis
  • Cropin Technology Solutions Pvt. Ltd.
  • Croptracker
  • CropX Technologies Ltd.
  • DeHaat
  • Farmonaut Technologies Pvt. Ltd.
  • FRONTIER AGRICULTURE LTD.
  • HELM AG
  • Kynetec
  • OneSoil
  • Syngenta Crop Protection AG
  • Topcon Corp.
  • Traction Ag
  • Trimble Inc.
  • Farmers Edge Inc.

Qualitative and quantitative analysis of companies has been conducted to help clients understand the wider business environment as well as the strengths and weaknesses of key market players. Data is qualitatively analyzed to categorize companies as pure play, category-focused, industry-focused, and diversified; it is quantitatively analyzed to categorize companies as dominant, leading, strong, tentative, and weak.

Research Analyst Overview

The market is a significant sector that relies on advanced technology to optimize farming operations and increase yields. crop production software plays a crucial role in this regard, providing farmers with real-time data and insights to make informed decisions. This software assists in various aspects of farming, including soil analysis, weather forecasting, crop monitoring, and inventory management. The market is growing at an impressive rate due to the increasing adoption of technology in agriculture. Farmers are recognizing the benefits of using software to manage their operations more efficiently and effectively. The market is driven by factors such as the need for higher crop yields, the availability of affordable technology, and government initiatives to promote technological advancements in agriculture.

Furthermore, the market caters to a wide range of farming activities, from small-scale operations to large commercial farms. It offers features such as satellite imagery, weather data, and precision farming tools to help farmers optimize their crop production. The market is also witnessing the emergence of cloud-based solutions, which offer greater flexibility and accessibility to farmers. In conclusion, the market is a dynamic and growing sector that is transforming agriculture by providing farmers with the tools they need to optimize their operations and increase yields. The market is driven by various factors, including the need for higher crop yields, the availability of affordable technology, and government initiatives. Farmers are increasingly recognizing the benefits of using software to manage their operations more efficiently and effectively.

Market Scope

Report Coverage

Details

Page number

167

Base year

2023

Historic period

2018-2022

Forecast period

2024-2028

Growth momentum & CAGR

Accelerate at a CAGR of 17.59%

Market Growth 2024-2028

USD 2.22 billion

Market structure

Fragmented

YoY growth 2023-2024(%)

17.29

Key countries

US, China, Australia, UK, and Germany

Competitive landscape

Leading Companies, Market Positioning of Companies, Competitive Strategies, and Industry Risks

Request Free Sample

What are the Key Data Covered in this Market Research and Growth Report?

  • CAGR of the market during the forecast period
  • Detailed information on factors that will drive the market growth and forecasting between 2024 and 2028
  • Precise estimation of the size of the market  and its contribution of the market in focus to the parent market
  • Accurate predictions about upcoming market growth and trends and changes in consumer behaviour
  • Growth of the market across North America, Europe, APAC, South America, and Middle East and Africa
  • Thorough analysis of the market's competitive landscape and detailed information about companies
  • Comprehensive analysis of factors that will challenge the growth of market companies

We can help! Our analysts can customize this market research report to meet your requirements. Get in touch

1 Executive Summary

  • 1.1 Market overview
    • Exhibit 01: Executive Summary – Chart on Market Overview
    • Exhibit 02: Executive Summary – Data Table on Market Overview
    • Exhibit 03: Executive Summary – Chart on Global Market Characteristics
    • Exhibit 04: Executive Summary – Chart on Market by Geography
    • Exhibit 05: Executive Summary – Chart on Market Segmentation by Deployment
    • Exhibit 06: Executive Summary – Chart on Market Segmentation by Type
    • Exhibit 07: Executive Summary – Chart on Incremental Growth
    • Exhibit 08: Executive Summary – Data Table on Incremental Growth
    • Exhibit 09: Executive Summary – Chart on Vendor Market Positioning

2 Market Landscape

  • 2.1 Market ecosystem
    • Exhibit 10: Parent market
    • Exhibit 11: Market Characteristics

3 Market Sizing

  • 3.1 Market definition
    • Exhibit 12: Offerings of vendors included in the market definition
  • 3.2 Market segment analysis
    • Exhibit 13: Market segments
  • 3.3 Market size 2023
    • 3.4 Market outlook: Forecast for 2023-2028
      • Exhibit 14: Chart on Global - Market size and forecast 2023-2028 ($ million)
      • Exhibit 15: Data Table on Global - Market size and forecast 2023-2028 ($ million)
      • Exhibit 16: Chart on Global Market: Year-over-year growth 2023-2028 (%)
      • Exhibit 17: Data Table on Global Market: Year-over-year growth 2023-2028 (%)

    4 Historic Market Size

    • 4.1 Global crop production software market 2018 - 2022
      • Exhibit 18: Historic Market Size – Data Table on global crop production software market 2018 - 2022 ($ million)
    • 4.2 Deployment Segment Analysis 2018 - 2022
      • Exhibit 19: Historic Market Size – Deployment Segment 2018 - 2022 ($ million)
    • 4.3 Type Segment Analysis 2018 - 2022
      • Exhibit 20: Historic Market Size – Type Segment 2018 - 2022 ($ million)
    • 4.4 Geography Segment Analysis 2018 - 2022
      • Exhibit 21: Historic Market Size – Geography Segment 2018 - 2022 ($ million)
    • 4.5 Country Segment Analysis 2018 - 2022
      • Exhibit 22: Historic Market Size – Country Segment 2018 - 2022 ($ million)

    5 Five Forces Analysis

    • 5.1 Five forces summary
      • Exhibit 23: Five forces analysis - Comparison between 2023 and 2028
    • 5.2 Bargaining power of buyers
      • Exhibit 24: Chart on Bargaining power of buyers – Impact of key factors 2023 and 2028
    • 5.3 Bargaining power of suppliers
      • Exhibit 25: Bargaining power of suppliers – Impact of key factors in 2023 and 2028
    • 5.4 Threat of new entrants
      • Exhibit 26: Threat of new entrants – Impact of key factors in 2023 and 2028
    • 5.5 Threat of substitutes
      • Exhibit 27: Threat of substitutes – Impact of key factors in 2023 and 2028
    • 5.6 Threat of rivalry
      • Exhibit 28: Threat of rivalry – Impact of key factors in 2023 and 2028
    • 5.7 Market condition
      • Exhibit 29: Chart on Market condition - Five forces 2023 and 2028

    6 Market Segmentation by Deployment

    • 6.1 Market segments
      • Exhibit 30: Chart on Deployment - Market share 2023-2028 (%)
      • Exhibit 31: Data Table on Deployment - Market share 2023-2028 (%)
    • 6.2 Comparison by Deployment
      • Exhibit 32: Chart on Comparison by Deployment
      • Exhibit 33: Data Table on Comparison by Deployment
    • 6.3 On-premises - Market size and forecast 2023-2028
      • Exhibit 34: Chart on On-premises - Market size and forecast 2023-2028 ($ million)
      • Exhibit 35: Data Table on On-premises - Market size and forecast 2023-2028 ($ million)
      • Exhibit 36: Chart on On-premises - Year-over-year growth 2023-2028 (%)
      • Exhibit 37: Data Table on On-premises - Year-over-year growth 2023-2028 (%)
    • 6.4 Cloud - Market size and forecast 2023-2028
      • Exhibit 38: Chart on Cloud - Market size and forecast 2023-2028 ($ million)
      • Exhibit 39: Data Table on Cloud - Market size and forecast 2023-2028 ($ million)
      • Exhibit 40: Chart on Cloud - Year-over-year growth 2023-2028 (%)
      • Exhibit 41: Data Table on Cloud - Year-over-year growth 2023-2028 (%)
    • 6.5 Market opportunity by Deployment
      • Exhibit 42: Market opportunity by Deployment ($ million)
      • Exhibit 43: Data Table on Market opportunity by Deployment ($ million)

    7 Market Segmentation by Type

    • 7.1 Market segments
      • Exhibit 44: Chart on Type - Market share 2023-2028 (%)
      • Exhibit 45: Data Table on Type - Market share 2023-2028 (%)
    • 7.2 Comparison by Type
      • Exhibit 46: Chart on Comparison by Type
      • Exhibit 47: Data Table on Comparison by Type
    • 7.3 Small - Market size and forecast 2023-2028
      • Exhibit 48: Chart on Small - Market size and forecast 2023-2028 ($ million)
      • Exhibit 49: Data Table on Small - Market size and forecast 2023-2028 ($ million)
      • Exhibit 50: Chart on Small - Year-over-year growth 2023-2028 (%)
      • Exhibit 51: Data Table on Small - Year-over-year growth 2023-2028 (%)
    • 7.4 Medium - Market size and forecast 2023-2028
      • Exhibit 52: Chart on Medium - Market size and forecast 2023-2028 ($ million)
      • Exhibit 53: Data Table on Medium - Market size and forecast 2023-2028 ($ million)
      • Exhibit 54: Chart on Medium - Year-over-year growth 2023-2028 (%)
      • Exhibit 55: Data Table on Medium - Year-over-year growth 2023-2028 (%)
    • 7.5 Large - Market size and forecast 2023-2028
      • Exhibit 56: Chart on Large - Market size and forecast 2023-2028 ($ million)
      • Exhibit 57: Data Table on Large - Market size and forecast 2023-2028 ($ million)
      • Exhibit 58: Chart on Large - Year-over-year growth 2023-2028 (%)
      • Exhibit 59: Data Table on Large - Year-over-year growth 2023-2028 (%)
    • 7.6 Market opportunity by Type
      • Exhibit 60: Market opportunity by Type ($ million)
      • Exhibit 61: Data Table on Market opportunity by Type ($ million)

    8 Customer Landscape

    • 8.1 Customer landscape overview
      • Exhibit 62: Analysis of price sensitivity, lifecycle, customer purchase basket, adoption rates, and purchase criteria

    9 Geographic Landscape

    • 9.1 Geographic segmentation
      • Exhibit 63: Chart on Market share by geography 2023-2028 (%)
      • Exhibit 64: Data Table on Market share by geography 2023-2028 (%)
    • 9.2 Geographic comparison
      • Exhibit 65: Chart on Geographic comparison
      • Exhibit 66: Data Table on Geographic comparison
    • 9.3 North America - Market size and forecast 2023-2028
      • Exhibit 67: Chart on North America - Market size and forecast 2023-2028 ($ million)
      • Exhibit 68: Data Table on North America - Market size and forecast 2023-2028 ($ million)
      • Exhibit 69: Chart on North America - Year-over-year growth 2023-2028 (%)
      • Exhibit 70: Data Table on North America - Year-over-year growth 2023-2028 (%)
    • 9.4 Europe - Market size and forecast 2023-2028
      • Exhibit 71: Chart on Europe - Market size and forecast 2023-2028 ($ million)
      • Exhibit 72: Data Table on Europe - Market size and forecast 2023-2028 ($ million)
      • Exhibit 73: Chart on Europe - Year-over-year growth 2023-2028 (%)
      • Exhibit 74: Data Table on Europe - Year-over-year growth 2023-2028 (%)
    • 9.5 APAC - Market size and forecast 2023-2028
      • Exhibit 75: Chart on APAC - Market size and forecast 2023-2028 ($ million)
      • Exhibit 76: Data Table on APAC - Market size and forecast 2023-2028 ($ million)
      • Exhibit 77: Chart on APAC - Year-over-year growth 2023-2028 (%)
      • Exhibit 78: Data Table on APAC - Year-over-year growth 2023-2028 (%)
    • 9.6 South America - Market size and forecast 2023-2028
      • Exhibit 79: Chart on South America - Market size and forecast 2023-2028 ($ million)
      • Exhibit 80: Data Table on South America - Market size and forecast 2023-2028 ($ million)
      • Exhibit 81: Chart on South America - Year-over-year growth 2023-2028 (%)
      • Exhibit 82: Data Table on South America - Year-over-year growth 2023-2028 (%)
    • 9.7 Middle East and Africa - Market size and forecast 2023-2028
      • Exhibit 83: Chart on Middle East and Africa - Market size and forecast 2023-2028 ($ million)
      • Exhibit 84: Data Table on Middle East and Africa - Market size and forecast 2023-2028 ($ million)
      • Exhibit 85: Chart on Middle East and Africa - Year-over-year growth 2023-2028 (%)
      • Exhibit 86: Data Table on Middle East and Africa - Year-over-year growth 2023-2028 (%)
    • 9.8 US - Market size and forecast 2023-2028
      • Exhibit 87: Chart on US - Market size and forecast 2023-2028 ($ million)
      • Exhibit 88: Data Table on US - Market size and forecast 2023-2028 ($ million)
      • Exhibit 89: Chart on US - Year-over-year growth 2023-2028 (%)
      • Exhibit 90: Data Table on US - Year-over-year growth 2023-2028 (%)
    • 9.9 China - Market size and forecast 2023-2028
      • Exhibit 91: Chart on China - Market size and forecast 2023-2028 ($ million)
      • Exhibit 92: Data Table on China - Market size and forecast 2023-2028 ($ million)
      • Exhibit 93: Chart on China - Year-over-year growth 2023-2028 (%)
      • Exhibit 94: Data Table on China - Year-over-year growth 2023-2028 (%)
    • 9.10 UK - Market size and forecast 2023-2028
      • Exhibit 95: Chart on UK - Market size and forecast 2023-2028 ($ million)
      • Exhibit 96: Data Table on UK - Market size and forecast 2023-2028 ($ million)
      • Exhibit 97: Chart on UK - Year-over-year growth 2023-2028 (%)
      • Exhibit 98: Data Table on UK - Year-over-year growth 2023-2028 (%)
    • 9.11 Germany - Market size and forecast 2023-2028
      • Exhibit 99: Chart on Germany - Market size and forecast 2023-2028 ($ million)
      • Exhibit 100: Data Table on Germany - Market size and forecast 2023-2028 ($ million)
      • Exhibit 101: Chart on Germany - Year-over-year growth 2023-2028 (%)
      • Exhibit 102: Data Table on Germany - Year-over-year growth 2023-2028 (%)
    • 9.12 Australia - Market size and forecast 2023-2028
      • Exhibit 103: Chart on Australia - Market size and forecast 2023-2028 ($ million)
      • Exhibit 104: Data Table on Australia - Market size and forecast 2023-2028 ($ million)
      • Exhibit 105: Chart on Australia - Year-over-year growth 2023-2028 (%)
      • Exhibit 106: Data Table on Australia - Year-over-year growth 2023-2028 (%)
    • 9.13 Market opportunity by geography
      • Exhibit 107: Market opportunity by geography ($ million)
      • Exhibit 108: Data Tables on Market opportunity by geography ($ million)

    10 Drivers, Challenges, and Trends

    • 10.1 Market drivers
      • 10.2 Market challenges
        • 10.3 Impact of drivers and challenges
          • Exhibit 109: Impact of drivers and challenges in 2023 and 2028
        • 10.4 Market trends

          11 Vendor Landscape

          • 11.1 Overview
            • 11.2 Vendor landscape
              • Exhibit 110: Overview on Criticality of inputs and Factors of differentiation
            • 11.3 Landscape disruption
              • Exhibit 111: Overview on factors of disruption
            • 11.4 Industry risks
              • Exhibit 112: Impact of key risks on business

            12 Vendor Analysis

            • 12.1 Vendors covered
              • Exhibit 113: Vendors covered
            • 12.2 Market positioning of vendors
              • Exhibit 114: Matrix on vendor position and classification
            • 12.3 AgriApp
              • Exhibit 115: AgriApp - Overview
              • Exhibit 116: AgriApp - Product / Service
              • Exhibit 117: AgriApp - Key offerings
            • 12.4 Agrivi d.o.o.
              • Exhibit 118: Agrivi d.o.o. - Overview
              • Exhibit 119: Agrivi d.o.o. - Product / Service
              • Exhibit 120: Agrivi d.o.o. - Key offerings
            • 12.5 BASF SE
              • Exhibit 121: BASF SE - Overview
              • Exhibit 122: BASF SE - Business segments
              • Exhibit 123: BASF SE - Key news
              • Exhibit 124: BASF SE - Key offerings
              • Exhibit 125: BASF SE - Segment focus
            • 12.6 CNH Industrial NV
              • Exhibit 126: CNH Industrial NV - Overview
              • Exhibit 127: CNH Industrial NV - Business segments
              • Exhibit 128: CNH Industrial NV - Key news
              • Exhibit 129: CNH Industrial NV - Key offerings
              • Exhibit 130: CNH Industrial NV - Segment focus
            • 12.7 Conservis
              • Exhibit 131: Conservis - Overview
              • Exhibit 132: Conservis - Product / Service
              • Exhibit 133: Conservis - Key offerings
            • 12.8 Cropin Technology Solutions Pvt. Ltd.
              • Exhibit 134: Cropin Technology Solutions Pvt. Ltd. - Overview
              • Exhibit 135: Cropin Technology Solutions Pvt. Ltd. - Product / Service
              • Exhibit 136: Cropin Technology Solutions Pvt. Ltd. - Key offerings
            • 12.9 Croptracker
              • Exhibit 137: Croptracker - Overview
              • Exhibit 138: Croptracker - Product / Service
              • Exhibit 139: Croptracker - Key offerings
            • 12.10 CropX Technologies Ltd.
              • Exhibit 140: CropX Technologies Ltd. - Overview
              • Exhibit 141: CropX Technologies Ltd. - Product / Service
              • Exhibit 142: CropX Technologies Ltd. - Key offerings
            • 12.11 DeHaat
              • Exhibit 143: DeHaat - Overview
              • Exhibit 144: DeHaat - Product / Service
              • Exhibit 145: DeHaat - Key offerings
            • 12.12 Farmers Edge Inc.
              • Exhibit 146: Farmers Edge Inc. - Overview
              • Exhibit 147: Farmers Edge Inc. - Product / Service
              • Exhibit 148: Farmers Edge Inc. - Key offerings
            • 12.13 FRONTIER AGRICULTURE LTD.
              • Exhibit 149: FRONTIER AGRICULTURE LTD. - Overview
              • Exhibit 150: FRONTIER AGRICULTURE LTD. - Product / Service
              • Exhibit 151: FRONTIER AGRICULTURE LTD. - Key offerings
            • 12.14 HELM AG
              • Exhibit 152: HELM AG - Overview
              • Exhibit 153: HELM AG - Product / Service
              • Exhibit 154: HELM AG - Key news
              • Exhibit 155: HELM AG - Key offerings
            • 12.15 Topcon Corp.
              • Exhibit 156: Topcon Corp. - Overview
              • Exhibit 157: Topcon Corp. - Business segments
              • Exhibit 158: Topcon Corp. - Key news
              • Exhibit 159: Topcon Corp. - Key offerings
              • Exhibit 160: Topcon Corp. - Segment focus
            • 12.16 Traction Ag
              • Exhibit 161: Traction Ag - Overview
              • Exhibit 162: Traction Ag - Product / Service
              • Exhibit 163: Traction Ag - Key offerings
            • 12.17 Trimble Inc.
              • Exhibit 164: Trimble Inc. - Overview
              • Exhibit 165: Trimble Inc. - Business segments
              • Exhibit 166: Trimble Inc. - Key offerings
              • Exhibit 167: Trimble Inc. - Segment focus

            13 Appendix

            • 13.1 Scope of the report
              • 13.2 Inclusions and exclusions checklist
                • Exhibit 168: Inclusions checklist
                • Exhibit 169: Exclusions checklist
              • 13.3 Currency conversion rates for US$
                • Exhibit 170: Currency conversion rates for US$
              • 13.4 Research methodology
                • Exhibit 171: Research methodology
                • Exhibit 172: Validation techniques employed for market sizing
                • Exhibit 173: Information sources
              • 13.5 List of abbreviations
                • Exhibit 174: List of abbreviations

              Research Methodology

              Technavio presents a detailed picture of the market by way of study, synthesis, and summation of data from multiple sources. The analysts have presented the various facets of the market with a particular focus on identifying the key industry influencers. The data thus presented is comprehensive, reliable, and the result of extensive research, both primary and secondary.

              INFORMATION SOURCES

              Primary sources

              • Manufacturers and suppliers
              • Channel partners
              • Industry experts
              • Strategic decision makers

              Secondary sources

              • Industry journals and periodicals
              • Government data
              • Financial reports of key industry players
              • Historical data
              • Press releases

              DATA ANALYSIS

              Data Synthesis

              • Collation of data
              • Estimation of key figures
              • Analysis of derived insights

              Data Validation

              • Triangulation with data models
              • Reference against proprietary databases
              • Corroboration with industry experts

              REPORT WRITING

              Qualitative

              • Market drivers
              • Market challenges
              • Market trends
              • Five forces analysis

              Quantitative

              • Market size and forecast
              • Market segmentation
              • Geographical insights
              • Competitive landscape

              Interested in this report?

              Get your sample now to see our research methodology and insights!

              Download Now

              Frequently Asked Questions

              Crop Production Software market growth will increase by $ 2221.84 mn during 2024-2028 .

              The Crop Production Software market is expected to grow at a CAGR of 17.59% during 2024-2028 .

              Crop Production Software market is segmented by Deployment( On-premises, Cloud) Type( Small, Medium, Large)

              Aerobotics Pty Ltd., AgriApp, Agrivi d.o.o., BASF SE, CNH Industrial NV, Conservis, Cropin Technology Solutions Pvt. Ltd., Croptracker, CropX Technologies Ltd., DeHaat, Farmonaut Technologies Pvt. Ltd., FRONTIER AGRICULTURE LTD., HELM AG, Kynetec, OneSoil, Syngenta Crop Protection AG, Topcon Corp., Traction Ag, Trimble Inc., Farmers Edge Inc. are a few of the key vendors in the Crop Production Software market.

              North America will register the highest growth rate of 43% among the other regions. Therefore, the Crop Production Software market in North America is expected to garner significant business opportunities for the vendors during the forecast period.

              US, China, Australia, UK, Germany

              • Growing popularity of precision farmingPrecision farming uses crop production software tools to maximize farm production and crop yield using fewer inputs. Software tools are used for purposes such as managing fertilizer inputs is the driving factor this market.
              • monitoring crops is the driving factor this market.
              • and managing tasks on the farm. For monitoring crops is the driving factor this market.
              • software tools use data such as crop yield and moisture content in the soil. The compatibility of crop production software with multiple devices makes the process convenient for farmers is the driving factor this market.
              • as they can view the information on their mobile devices. For example is the driving factor this market.
              • Trimble Inc. production Software has features for moisture is the driving factor this market.
              • variety is the driving factor this market.
              • and load tracking of crops grown on farms.  Precision farming also includes yield and soil mapping applications with input management. Yield and soil mapping are done by geographic information system (GIS) software packages is the driving factor this market.
              • which display desired data is the driving factor this market.
              • such as yield and soil nutrient information is the driving factor this market.
              • on a map. Farmers who need to increase their yield and improve soil nutrient concentration get an easy-to-understand view of the yield and soil nutrient variability in the form of a map is the driving factor this market.
              • which is helpful. Input management involves controlling the amount of seeds is the driving factor this market.
              • fertilizers is the driving factor this market.
              • and pesticides to be used in different areas of the field through variable-rate technology. Based on the mapping data is the driving factor this market.
              • the input can be predetermined through crop production software.  Thus is the driving factor this market.
              • the increasing adoption of precision farming leads to a proportional increase in demand for crop production software is the driving factor this market.
              • which is the driving factor this market.
              • in turn is the driving factor this market.
              • is anticipated to drive the growth of the global crop production software market during the forecast period. is the driving factor this market.

              The Crop Production Software market vendors should focus on grabbing business opportunities from the On-premises segment as it accounted for the largest market share in the base year.