Crystal Market Analysis, Size, and Forecast 2026-2030: APAC (China, Japan, and India), North America (US, Canada, and Mexico), Europe (Germany, France, and UK), Middle East and Africa (UAE, South Africa, and Israel), South America (Brazil, Argentina, and Colombia), and Rest of World (ROW)

Crystal Market Analysis, Size, and Forecast 2026-2030:
APAC (China, Japan, and India), North America (US, Canada, and Mexico), Europe (Germany, France, and UK), Middle East and Africa (UAE, South Africa, and Israel), South America (Brazil, Argentina, and Colombia), and Rest of World (ROW)

Published: Dec 2025 298 Pages SKU: IRTNTR81175

Market Overview at a Glance

$740.5 Mn
Market Opportunity
3.4%
CAGR 2025 - 2030
46.8%
APAC Growth
$2.58 B
MHz segment 2024

Crystal Market Size 2026-2030

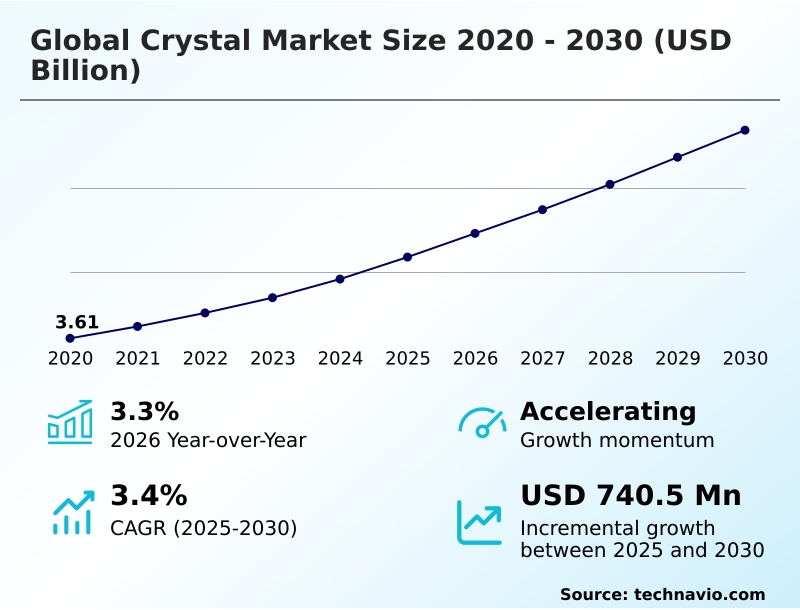
The crystal market size is valued to increase by USD 740.5 million, at a CAGR of 3.4% from 2025 to 2030. Proliferation of advanced semiconductor and 5g technology will drive the crystal market.

Major Market Trends & Insights

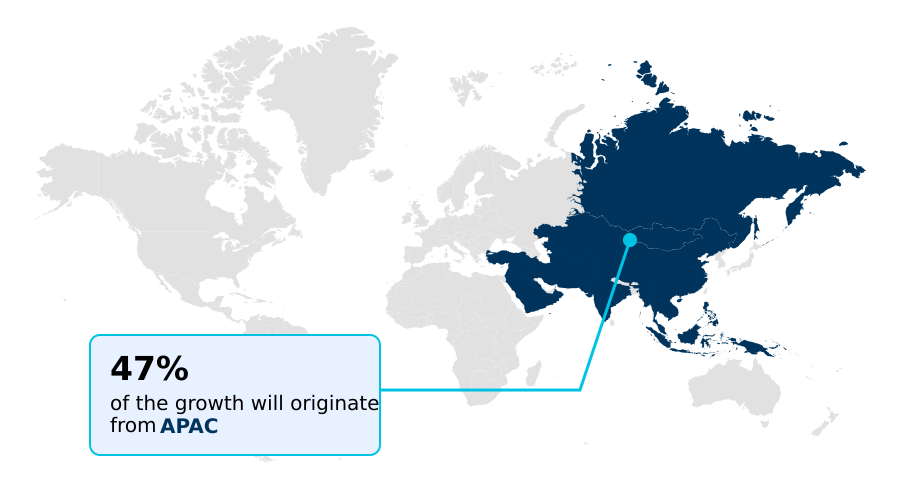
  • APAC dominated the market and accounted for a 46.8% growth during the forecast period.
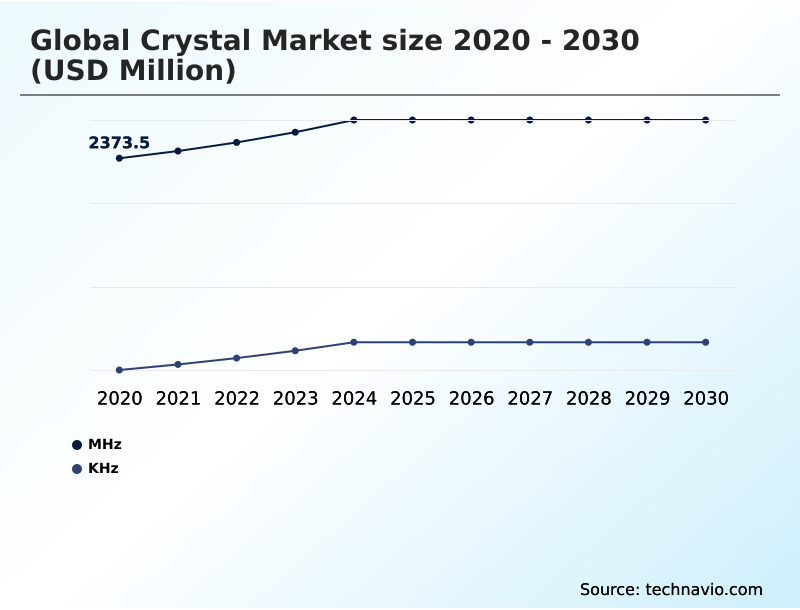
  • By Frequency Range - MHz segment was valued at USD 2.58 billion in 2024
  • By Application - Oscillators segment accounted for the largest market revenue share in 2024

Market Size & Forecast

  • Market Opportunities: USD 1.23 billion
  • Market Future Opportunities: USD 740.5 million
  • CAGR from 2025 to 2030 : 3.4%

Market Summary

  • The crystal market is experiencing a significant transformation, driven by the dual demands of technological advancement and evolving consumer preferences. At its core, the industry provides foundational components like piezoelectric crystal resonators and quartz crystal oscillators, which are indispensable for timing and frequency control in virtually all modern electronics.
  • Key drivers include the global rollout of 5G networks and the increasing electronic complexity in electric vehicles, which demand high-performance temperature-compensated crystal oscillators (TCXOs) and oven-controlled crystal oscillators (OCXOs) for system stability. Simultaneously, the market is navigating the growing adoption of wide-bandgap semiconductors such as silicon carbide (SiC) and gallium nitride (GaN).
  • A critical business scenario involves electronics manufacturers mitigating supply chain volatility. For instance, an automotive supplier facing disruptions in the high-purity quartz supply chain might diversify its sourcing strategy by qualifying multiple vendors across different geographies. This proactive measure, while increasing initial qualification costs, ensures production continuity for critical ADAS modules, safeguarding against potential shutdowns and revenue loss.
  • The industry also faces challenges from the high energy costs of manufacturing processes and increasing competition from alternative technologies like microelectromechanical systems (MEMS).

What will be the Size of the Crystal Market during the forecast period?

Get Key Insights on Market Forecast (PDF) Request Free Sample

How is the Crystal Market Segmented?

The crystal industry research report provides comprehensive data (region-wise segment analysis), with forecasts and estimates in "USD million" for the period 2026-2030, as well as historical data from 2020-2024 for the following segments.

  • Frequency range
    • MHz
    • KHz
  • Application
    • Oscillators
    • Resonators
    • Filters
  • End-user
    • Consumer electronics
    • IT and telecommunication
    • Automotive
    • Military and aerospace
    • Others
  • Geography
    • APAC
      • China
      • Japan
      • India
    • North America
      • US
      • Canada
      • Mexico
    • Europe
      • Germany
      • France
      • UK
    • Middle East and Africa
      • UAE
      • South Africa
      • Israel
    • South America
      • Brazil
      • Argentina
      • Colombia
    • Rest of World (ROW)

By Frequency Range Insights

The mhz segment is estimated to witness significant growth during the forecast period.

The megahertz (MHz) frequency segment is pivotal to the crystal market, underpinning high-speed data processing and communication systems.

These components, including quartz crystal oscillators and ceramic resonators, serve as the primary clock source for microprocessors and high-speed networking hardware, where precise timing is non-negotiable.

The demand for these MHz crystals is driven by advancements in telecommunications and enterprise networking, which require lower jitter and improved phase noise to handle escalating data traffic.

The transition to advanced protocols like PCIe 5.0 in hyperscale data centers has increased the need for high-performance timing references, with some implementations achieving up to a 20% reduction in data transmission errors.

This segment's trajectory is closely tied to the innovation cycle in high-performance computing, automotive electronics, particularly ADAS, and industrial automation, where reliable, high-frequency timing from components like TCXOs is critical for system integrity.

Request Free Sample

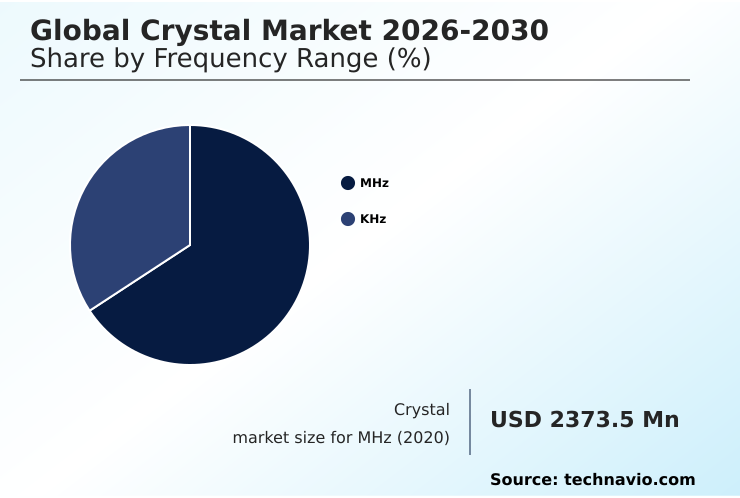
The MHz segment was valued at USD 2.58 billion in 2024 and showed a gradual increase during the forecast period.

Request Free Sample

Regional Analysis

APAC is estimated to contribute 46.8% to the growth of the global market during the forecast period.Technavio’s analysts have elaborately explained the regional trends and drivers that shape the market during the forecast period.

See How Crystal Market Demand is Rising in APAC Request Free Sample

The geographic landscape of the global crystal market is characterized by distinct regional specializations. APAC, accounting for over 45% of global production, serves as the manufacturing powerhouse, driven by its dominance in consumer electronics, semiconductors, and solar panel production.

This region leverages massive economies of scale in producing monocrystalline silicon wafers and a wide array of timing components.

North America leads in high-value applications and R&D, particularly in the aerospace, defense, and electric vehicle sectors, where advanced synthetic crystals like silicon carbide and gallium nitride are critical.

Strategic initiatives in the region have helped some firms reduce R&D-to-production timelines by nearly 20% for next-generation materials. Europe excels in the automotive and luxury goods segments, combining industrial might with a rich heritage in craftsmanship.

The market's future will be shaped by how these regions navigate geopolitical tensions and supply chain risks.

Market Dynamics

Our researchers analyzed the data with 2025 as the base year, along with the key drivers, trends, and challenges. A holistic analysis of drivers will help companies refine their marketing strategies to gain a competitive advantage.

  • Strategic decision-making in the global crystal market 2026-2030 is increasingly complex, requiring a nuanced understanding of competing technologies and their specific use cases. The debate over SiC vs GaN in EV inverters continues, with silicon carbide often favored for high-voltage powertrains while gallium nitride shows promise in on-board chargers.
  • Similarly, the choice of MEMS oscillators for automotive applications is gaining traction due to their robustness, though high-stability OCXOs for 5G base stations remain the gold standard for network synchronization. For designers, quartz crystal selection for low-power IoT devices is a critical decision, balancing cost, size, and power consumption to maximize battery life.
  • The market is also bifurcated by the lab-grown vs natural crystals jewelry market, where consumer perceptions of value and ethics play a significant role. Operationally, the impact of geopolitical tension on quartz supply is a primary concern.
  • Firms that proactively diversify their sourcing have maintained up to 98% of their target inventory levels, in stark contrast to competitors facing significant shortfalls. This dynamic extends to the use of crystal filters for military radio communication, where secure, domestic supply chains are paramount.
  • The foundational role of silicon wafers in semiconductor manufacturing, challenges in high-purity silicon production, and the emergence of advanced crystals for micro-LED displays further highlight the market's intricate and interconnected nature.

What are the key market drivers leading to the rise in the adoption of Crystal Industry?

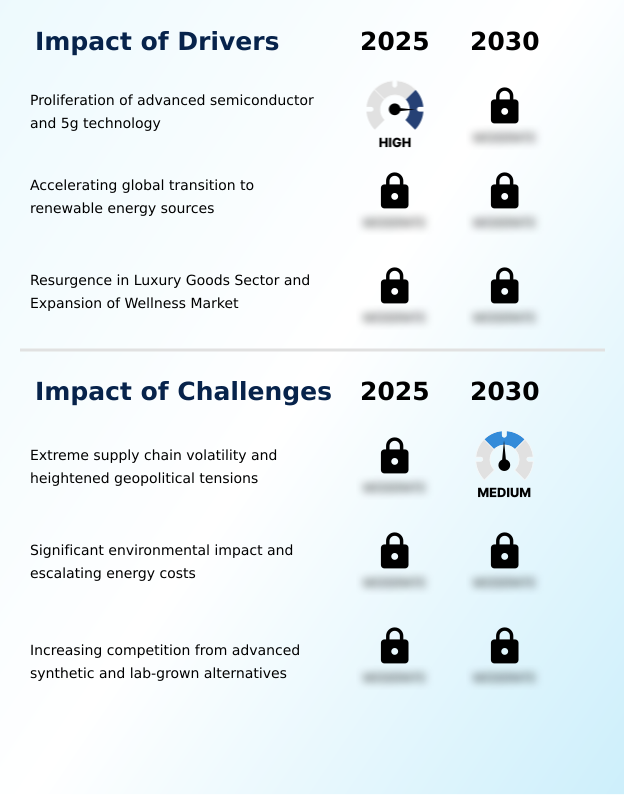
  • The proliferation of advanced semiconductor and 5G technology is a key driver for the market.

  • The global digital transformation is a primary driver for the crystal market, creating sustained demand for precision timing components.
  • The rollout of 5G infrastructure necessitates high-performance temperature-compensated crystal oscillators (TCXOs) to ensure network synchronization, with advanced versions improving timing accuracy by over 50% compared to previous generations.
  • In the automotive sector, the transition to electric vehicles (EVs) and advanced driver-assistance systems (ADAS) relies heavily on crystalline materials; the use of silicon carbide (SiC) in EV inverters can increase vehicle range by 5–10% by enhancing power conversion efficiency.
  • This demand for sophisticated components is complemented by the burgeoning wellness industry, where consumers are increasingly purchasing natural crystals, expanding the market beyond its traditional industrial base.
  • The industry is responding with innovations in both industrial-grade piezoelectric crystal resonators and consumer-focused aesthetic products.

What are the market trends shaping the Crystal Industry?

  • The proliferation of advanced synthetic crystals is a defining market trend, driven by escalating performance demands in high-frequency electronics and next-generation photonic systems.

  • The crystal market is evolving rapidly, driven by the adoption of advanced synthetic materials to meet escalating performance demands. The use of wide-bandgap semiconductors such as gallium nitride (GaN) in data center power supplies has improved energy efficiency by over 5%, a critical factor in reducing operational costs.
  • In the renewable energy sector, advancements in monocrystalline silicon growth methods have pushed solar panel conversion efficiencies beyond 23% in commercial products, accelerating the transition to sustainable power. Concurrently, a powerful consumer-facing trend sees a convergence of wellness and luxury, where the aesthetic and perceived metaphysical properties of natural crystals are fueling robust demand in home decor and fashion.
  • This dual evolution—from high-purity industrial materials like sapphire substrates to consumer-centric natural stones—creates a dynamic and diversified market landscape for frequency control devices.

What challenges does the Crystal Industry face during its growth?

  • Extreme supply chain volatility and heightened geopolitical tensions present a key challenge affecting industry growth.

  • The crystal market faces significant operational and competitive challenges that temper its growth prospects. Extreme supply chain volatility, stemming from the geographic concentration of high-purity quartz mining and processing, remains a primary concern. Recent disruptions have led to lead time increases of over 40% for certain quartz components, impacting manufacturing schedules globally.
  • Another major hurdle is the industry's high energy consumption; manufacturing methods like the Czochralski process for silicon growth can account for more than 50% of the total energy used in producing a wafer, creating both cost pressures and environmental scrutiny. Furthermore, the market is encountering intensifying competition from alternative technologies.
  • The rise of lab-grown diamonds and other synthetic crystals is altering market dynamics in the jewelry sector, while MEMS-based timing solutions present a growing challenge to traditional quartz devices in various electronic applications.

Exclusive Technavio Analysis on Customer Landscape

The crystal market forecasting report includes the adoption lifecycle of the market, covering from the innovator’s stage to the laggard’s stage. It focuses on adoption rates in different regions based on penetration. Furthermore, the crystal market report also includes key purchase criteria and drivers of price sensitivity to help companies evaluate and develop their market growth analysis strategies.

Customer Landscape of Crystal Industry

Competitive Landscape

Companies are implementing various strategies, such as strategic alliances, crystal market forecast, partnerships, mergers and acquisitions, geographical expansion, and product/service launches, to enhance their presence in the industry.

Abracon LLC - The portfolio features a broad range of frequency control products, including precision quartz crystals, advanced oscillators, and integrated timing modules designed for diverse electronic applications.

The industry research and growth report includes detailed analyses of the competitive landscape of the market and information about key companies, including:

  • Abracon LLC
  • CTS Corp.
  • Daishinku Corp.
  • ECS Inc.
  • Hongxing Technology Co. Ltd.
  • Jauch Quartz GmbH
  • Kyocera Corp.
  • Microchip Technology Inc.
  • Murata Manufacturing Co. Ltd.
  • Nihon Dempa Kogyo Ltd.
  • Rakon Ltd.
  • RALTRON
  • Renesas Electronics Corp.
  • River Eletec Corp.
  • Epson Corp.
  • SiTime Corp.
  • SIWARD Crystal Tech. Ltd.
  • TXC Corp.
  • Wurth Elektronik GmbH and Co. KG

Qualitative and quantitative analysis of companies has been conducted to help clients understand the wider business environment as well as the strengths and weaknesses of key industry players. Data is qualitatively analyzed to categorize companies as pure play, category-focused, industry-focused, and diversified; it is quantitatively analyzed to categorize companies as dominant, leading, strong, tentative, and weak.

Recent Development and News in Crystal market

  • In September 2024, SiTime Corp. announced a strategic partnership with a leading automotive Tier-1 supplier to integrate its latest generation of AEC-Q200 qualified MEMS oscillators into next-generation ADAS platforms, aiming to enhance system resilience against shock and vibration.
  • In November 2024, Kyocera Corp. launched a new series of high-stability oven-controlled crystal oscillators (OCXOs) specifically designed to meet the stringent synchronization requirements of 5G-Advanced and early-stage 6G network infrastructure.
  • In February 2025, Microchip Technology Inc. completed its acquisition of a specialized European manufacturer of high-reliability crystal filters, a move intended to strengthen its product offerings for the aerospace and defense markets.
  • In April 2025, the US Department of Commerce, under the CHIPS and Science Act, awarded a significant grant to a domestic materials science company to build a new facility for processing high-purity quartz, aiming to reduce reliance on foreign supply chains.

Dive into Technavio’s robust research methodology, blending expert interviews, extensive data synthesis, and validated models for unparalleled Crystal Market insights. See full methodology.

Market Scope
Page number 298
Base year 2025
Historic period 2020-2024
Forecast period 2026-2030
Growth momentum & CAGR Accelerate at a CAGR of 3.4%
Market growth 2026-2030 USD 740.5 million
Market structure Fragmented
YoY growth 2025-2026(%) 3.3%
Key countries China, Japan, India, South Korea, Australia, Indonesia, US, Canada, Mexico, Germany, France, UK, Italy, Spain, The Netherlands, UAE, South Africa, Israel, Saudi Arabia, Turkey, Brazil, Argentina and Colombia
Competitive landscape Leading Companies, Market Positioning of Companies, Competitive Strategies, and Industry Risks

Request Free Sample

Research Analyst Overview

  • The crystal market is fundamentally shaped by the relentless pursuit of precision and efficiency in electronic systems. Core components such as piezoelectric crystal resonators, quartz crystal oscillators, and increasingly, microelectromechanical systems (MEMS) serve as the essential timing references for industries ranging from telecommunications to automotive.
  • The ongoing shift toward wide-bandgap semiconductors, including silicon carbide (SiC) and gallium nitride (GaN), is a key trend, driven by their superior performance in high-power and high-frequency applications. For instance, the adoption of new synthetic crystals has enabled a 30% reduction in power loss in next-generation power supplies.
  • This technological pivot presents a critical boardroom-level decision regarding capital expenditure: whether to invest in scaling up production of advanced materials like SiC or to optimize existing manufacturing lines for traditional quartz-based frequency control devices such as TCXOs and OCXOs. The decision impacts long-term competitiveness in high-growth sectors.
  • The market's complexity is further heightened by the reliance on specialized materials like yttrium aluminum garnet (YAG) for lasers and scintillator crystals for medical imaging, each with unique supply chain considerations.

What are the Key Data Covered in this Crystal Market Research and Growth Report?

  • What is the expected growth of the Crystal Market between 2026 and 2030?

    • USD 740.5 million, at a CAGR of 3.4%

  • What segmentation does the market report cover?

    • The report is segmented by Frequency Range (MHz, and KHz), Application (Oscillators, Resonators, and Filters), End-user (Consumer electronics, IT and telecommunication, Automotive, Military and aerospace, and Others) and Geography (APAC, North America, Europe, Middle East and Africa, South America)

  • Which regions are analyzed in the report?

    • APAC, North America, Europe, Middle East and Africa and South America

  • What are the key growth drivers and market challenges?

    • Proliferation of advanced semiconductor and 5g technology, Extreme supply chain volatility and heightened geopolitical tensions

  • Who are the major players in the Crystal Market?

    • Abracon LLC, CTS Corp., Daishinku Corp., ECS Inc., Hongxing Technology Co. Ltd., Jauch Quartz GmbH, Kyocera Corp., Microchip Technology Inc., Murata Manufacturing Co. Ltd., Nihon Dempa Kogyo Ltd., Rakon Ltd., RALTRON, Renesas Electronics Corp., River Eletec Corp., Epson Corp., SiTime Corp., SIWARD Crystal Tech. Ltd., TXC Corp. and Wurth Elektronik GmbH and Co. KG

Market Research Insights

  • The crystal market's dynamics are shaped by a convergence of high-tech industrial requirements and shifting consumer behaviors. In the industrial sphere, the adoption of silicon carbide in electric vehicle power electronics has improved power conversion efficiency by over 8%, directly impacting vehicle range.
  • This push for performance in applications like advanced driver-assistance systems (ADAS) and 5G network synchronization fuels demand for specialized components. Concurrently, the wellness and luxury goods sectors are creating robust demand for natural crystals based on perceived metaphysical properties and aesthetic appeal. This diversification provides a counterbalance to the cyclical nature of industrial demand.
  • However, the industry grapples with significant supply chain volatility; strategic sourcing of high-purity quartz and other raw materials has enabled some manufacturers to reduce production delays by up to 15%, highlighting the operational importance of supply chain resilience amid ongoing geopolitical friction.

We can help! Our analysts can customize this crystal market research report to meet your requirements.

Get in touch

1. Executive Summary

1.1 Market overview

Executive Summary - Chart on Market Overview
Executive Summary - Data Table on Market Overview
Executive Summary - Chart on Global Market Characteristics
Executive Summary - Chart on Market by Geography
Executive Summary - Chart on Market Segmentation by Frequency Range
Executive Summary - Chart on Market Segmentation by Application
Executive Summary - Chart on Market Segmentation by End-user
Executive Summary - Chart on Incremental Growth
Executive Summary - Data Table on Incremental Growth
Executive Summary - Chart on Company Market Positioning

2. Technavio Analysis

2.1 Analysis of price sensitivity, lifecycle, customer purchase basket, adoption rates, and purchase criteria

2.2 Criticality of inputs and Factors of differentiation

Chart on Overview on criticality of inputs and factors of differentiation

2.3 Factors of disruption

Chart on Overview on factors of disruption

2.4 Impact of drivers and challenges

Chart on Impact of drivers and challenges in 2025 and 2030

3. Market Landscape

3.1 Market ecosystem

Chart on Parent Market
Data Table on - Parent Market

3.2 Market characteristics

Chart on Market characteristics analysis

3.3 Value chain analysis

Chart on Value chain analysis

4. Market Sizing

4.1 Market definition

Data Table on Offerings of companies included in the market definition

4.2 Market segment analysis

Market segments

4.3 Market size 2025

4.4 Market outlook: Forecast for 2025-2030

Chart on Global - Market size and forecast 2025-2030 ($ million)
Data Table on Global - Market size and forecast 2025-2030 ($ million)
Chart on Global Market: Year-over-year growth 2025-2030 (%)
Data Table on Global Market: Year-over-year growth 2025-2030 (%)

5. Historic Market Size

5.1 Global Crystal Market 2020 - 2024

Historic Market Size - Data Table on Global Crystal Market 2020 - 2024 ($ million)

5.2 Frequency Range segment analysis 2020 - 2024

Historic Market Size - Frequency Range Segment 2020 - 2024 ($ million)

5.3 Application segment analysis 2020 - 2024

Historic Market Size - Application Segment 2020 - 2024 ($ million)

5.4 End-user segment analysis 2020 - 2024

Historic Market Size - End-user Segment 2020 - 2024 ($ million)

5.5 Geography segment analysis 2020 - 2024

Historic Market Size - Geography Segment 2020 - 2024 ($ million)

5.6 Country segment analysis 2020 - 2024

Historic Market Size - Country Segment 2020 - 2024 ($ million)

6. Five Forces Analysis

6.1 Five forces summary

Five forces analysis - Comparison between 2025 and 2030

6.2 Bargaining power of buyers

Bargaining power of buyers - Impact of key factors 2025 and 2030

6.3 Bargaining power of suppliers

Bargaining power of suppliers - Impact of key factors in 2025 and 2030

6.4 Threat of new entrants

Threat of new entrants - Impact of key factors in 2025 and 2030

6.5 Threat of substitutes

Threat of substitutes - Impact of key factors in 2025 and 2030

6.6 Threat of rivalry

Threat of rivalry - Impact of key factors in 2025 and 2030

6.7 Market condition

Chart on Market condition - Five forces 2025 and 2030

7. Market Segmentation by Frequency Range

7.1 Market segments

Chart on Frequency Range - Market share 2025-2030 (%)
Data Table on Frequency Range - Market share 2025-2030 (%)

7.2 Comparison by Frequency Range

Chart on Comparison by Frequency Range
Data Table on Comparison by Frequency Range

7.3 MHz - Market size and forecast 2025-2030

Chart on MHz - Market size and forecast 2025-2030 ($ million)
Data Table on MHz - Market size and forecast 2025-2030 ($ million)
Chart on MHz - Year-over-year growth 2025-2030 (%)
Data Table on MHz - Year-over-year growth 2025-2030 (%)

7.4 KHz - Market size and forecast 2025-2030

Chart on KHz - Market size and forecast 2025-2030 ($ million)
Data Table on KHz - Market size and forecast 2025-2030 ($ million)
Chart on KHz - Year-over-year growth 2025-2030 (%)
Data Table on KHz - Year-over-year growth 2025-2030 (%)

7.5 Market opportunity by Frequency Range

Market opportunity by Frequency Range ($ million)
Data Table on Market opportunity by Frequency Range ($ million)

8. Market Segmentation by Application

8.1 Market segments

Chart on Application - Market share 2025-2030 (%)
Data Table on Application - Market share 2025-2030 (%)

8.2 Comparison by Application

Chart on Comparison by Application
Data Table on Comparison by Application

8.3 Oscillators - Market size and forecast 2025-2030

Chart on Oscillators - Market size and forecast 2025-2030 ($ million)
Data Table on Oscillators - Market size and forecast 2025-2030 ($ million)
Chart on Oscillators - Year-over-year growth 2025-2030 (%)
Data Table on Oscillators - Year-over-year growth 2025-2030 (%)

8.4 Resonators - Market size and forecast 2025-2030

Chart on Resonators - Market size and forecast 2025-2030 ($ million)
Data Table on Resonators - Market size and forecast 2025-2030 ($ million)
Chart on Resonators - Year-over-year growth 2025-2030 (%)
Data Table on Resonators - Year-over-year growth 2025-2030 (%)

8.5 Filters - Market size and forecast 2025-2030

Chart on Filters - Market size and forecast 2025-2030 ($ million)
Data Table on Filters - Market size and forecast 2025-2030 ($ million)
Chart on Filters - Year-over-year growth 2025-2030 (%)
Data Table on Filters - Year-over-year growth 2025-2030 (%)

8.6 Market opportunity by Application

Market opportunity by Application ($ million)
Data Table on Market opportunity by Application ($ million)

9. Market Segmentation by End-user

9.1 Market segments

Chart on End-user - Market share 2025-2030 (%)
Data Table on End-user - Market share 2025-2030 (%)

9.2 Comparison by End-user

Chart on Comparison by End-user
Data Table on Comparison by End-user

9.3 Consumer electronics - Market size and forecast 2025-2030

Chart on Consumer electronics - Market size and forecast 2025-2030 ($ million)
Data Table on Consumer electronics - Market size and forecast 2025-2030 ($ million)
Chart on Consumer electronics - Year-over-year growth 2025-2030 (%)
Data Table on Consumer electronics - Year-over-year growth 2025-2030 (%)

9.4 IT and telecommunication - Market size and forecast 2025-2030

Chart on IT and telecommunication - Market size and forecast 2025-2030 ($ million)
Data Table on IT and telecommunication - Market size and forecast 2025-2030 ($ million)
Chart on IT and telecommunication - Year-over-year growth 2025-2030 (%)
Data Table on IT and telecommunication - Year-over-year growth 2025-2030 (%)

9.5 Automotive - Market size and forecast 2025-2030

Chart on Automotive - Market size and forecast 2025-2030 ($ million)
Data Table on Automotive - Market size and forecast 2025-2030 ($ million)
Chart on Automotive - Year-over-year growth 2025-2030 (%)
Data Table on Automotive - Year-over-year growth 2025-2030 (%)

9.6 Military and aerospace - Market size and forecast 2025-2030

Chart on Military and aerospace - Market size and forecast 2025-2030 ($ million)
Data Table on Military and aerospace - Market size and forecast 2025-2030 ($ million)
Chart on Military and aerospace - Year-over-year growth 2025-2030 (%)
Data Table on Military and aerospace - Year-over-year growth 2025-2030 (%)

9.7 Others - Market size and forecast 2025-2030

Chart on Others - Market size and forecast 2025-2030 ($ million)
Data Table on Others - Market size and forecast 2025-2030 ($ million)
Chart on Others - Year-over-year growth 2025-2030 (%)
Data Table on Others - Year-over-year growth 2025-2030 (%)

9.8 Market opportunity by End-user

Market opportunity by End-user ($ million)
Data Table on Market opportunity by End-user ($ million)

10. Customer Landscape

10.1 Customer landscape overview

Analysis of price sensitivity, lifecycle, customer purchase basket, adoption rates, and purchase criteria

11. Geographic Landscape

11.1 Geographic segmentation

Chart on Market share by geography 2025-2030 (%)
Data Table on Market share by geography 2025-2030 (%)

11.2 Geographic comparison

Chart on Geographic comparison
Data Table on Geographic comparison

11.3 APAC - Market size and forecast 2025-2030

Chart on APAC - Market size and forecast 2025-2030 ($ million)
Data Table on APAC - Market size and forecast 2025-2030 ($ million)
Chart on APAC - Year-over-year growth 2025-2030 (%)
Data Table on APAC - Year-over-year growth 2025-2030 (%)
Chart on Regional Comparison - APAC
Data Table on Regional Comparison - APAC

11.3.1 China - Market size and forecast 2025-2030

Chart on China - Market size and forecast 2025-2030 ($ million)
Data Table on China - Market size and forecast 2025-2030 ($ million)
Chart on China - Year-over-year growth 2025-2030 (%)
Data Table on China - Year-over-year growth 2025-2030 (%)

11.3.2 Japan - Market size and forecast 2025-2030

Chart on Japan - Market size and forecast 2025-2030 ($ million)
Data Table on Japan - Market size and forecast 2025-2030 ($ million)
Chart on Japan - Year-over-year growth 2025-2030 (%)
Data Table on Japan - Year-over-year growth 2025-2030 (%)

11.3.3 India - Market size and forecast 2025-2030

Chart on India - Market size and forecast 2025-2030 ($ million)
Data Table on India - Market size and forecast 2025-2030 ($ million)
Chart on India - Year-over-year growth 2025-2030 (%)
Data Table on India - Year-over-year growth 2025-2030 (%)

11.3.4 South Korea - Market size and forecast 2025-2030

Chart on South Korea - Market size and forecast 2025-2030 ($ million)
Data Table on South Korea - Market size and forecast 2025-2030 ($ million)
Chart on South Korea - Year-over-year growth 2025-2030 (%)
Data Table on South Korea - Year-over-year growth 2025-2030 (%)

11.3.5 Australia - Market size and forecast 2025-2030

Chart on Australia - Market size and forecast 2025-2030 ($ million)
Data Table on Australia - Market size and forecast 2025-2030 ($ million)
Chart on Australia - Year-over-year growth 2025-2030 (%)
Data Table on Australia - Year-over-year growth 2025-2030 (%)

11.3.6 Indonesia - Market size and forecast 2025-2030

Chart on Indonesia - Market size and forecast 2025-2030 ($ million)
Data Table on Indonesia - Market size and forecast 2025-2030 ($ million)
Chart on Indonesia - Year-over-year growth 2025-2030 (%)
Data Table on Indonesia - Year-over-year growth 2025-2030 (%)

11.4 North America - Market size and forecast 2025-2030

Chart on North America - Market size and forecast 2025-2030 ($ million)
Data Table on North America - Market size and forecast 2025-2030 ($ million)
Chart on North America - Year-over-year growth 2025-2030 (%)
Data Table on North America - Year-over-year growth 2025-2030 (%)
Chart on Regional Comparison - North America
Data Table on Regional Comparison - North America

11.4.1 US - Market size and forecast 2025-2030

Chart on US - Market size and forecast 2025-2030 ($ million)
Data Table on US - Market size and forecast 2025-2030 ($ million)
Chart on US - Year-over-year growth 2025-2030 (%)
Data Table on US - Year-over-year growth 2025-2030 (%)

11.4.2 Canada - Market size and forecast 2025-2030

Chart on Canada - Market size and forecast 2025-2030 ($ million)
Data Table on Canada - Market size and forecast 2025-2030 ($ million)
Chart on Canada - Year-over-year growth 2025-2030 (%)
Data Table on Canada - Year-over-year growth 2025-2030 (%)

11.4.3 Mexico - Market size and forecast 2025-2030

Chart on Mexico - Market size and forecast 2025-2030 ($ million)
Data Table on Mexico - Market size and forecast 2025-2030 ($ million)
Chart on Mexico - Year-over-year growth 2025-2030 (%)
Data Table on Mexico - Year-over-year growth 2025-2030 (%)

11.5 Europe - Market size and forecast 2025-2030

Chart on Europe - Market size and forecast 2025-2030 ($ million)
Data Table on Europe - Market size and forecast 2025-2030 ($ million)
Chart on Europe - Year-over-year growth 2025-2030 (%)
Data Table on Europe - Year-over-year growth 2025-2030 (%)
Chart on Regional Comparison - Europe
Data Table on Regional Comparison - Europe

11.5.1 Germany - Market size and forecast 2025-2030

Chart on Germany - Market size and forecast 2025-2030 ($ million)
Data Table on Germany - Market size and forecast 2025-2030 ($ million)
Chart on Germany - Year-over-year growth 2025-2030 (%)
Data Table on Germany - Year-over-year growth 2025-2030 (%)

11.5.2 France - Market size and forecast 2025-2030

Chart on France - Market size and forecast 2025-2030 ($ million)
Data Table on France - Market size and forecast 2025-2030 ($ million)
Chart on France - Year-over-year growth 2025-2030 (%)
Data Table on France - Year-over-year growth 2025-2030 (%)

11.5.3 UK - Market size and forecast 2025-2030

Chart on UK - Market size and forecast 2025-2030 ($ million)
Data Table on UK - Market size and forecast 2025-2030 ($ million)
Chart on UK - Year-over-year growth 2025-2030 (%)
Data Table on UK - Year-over-year growth 2025-2030 (%)

11.5.4 Italy - Market size and forecast 2025-2030

Chart on Italy - Market size and forecast 2025-2030 ($ million)
Data Table on Italy - Market size and forecast 2025-2030 ($ million)
Chart on Italy - Year-over-year growth 2025-2030 (%)
Data Table on Italy - Year-over-year growth 2025-2030 (%)

11.5.5 Spain - Market size and forecast 2025-2030

Chart on Spain - Market size and forecast 2025-2030 ($ million)
Data Table on Spain - Market size and forecast 2025-2030 ($ million)
Chart on Spain - Year-over-year growth 2025-2030 (%)
Data Table on Spain - Year-over-year growth 2025-2030 (%)

11.5.6 The Netherlands - Market size and forecast 2025-2030

Chart on The Netherlands - Market size and forecast 2025-2030 ($ million)
Data Table on The Netherlands - Market size and forecast 2025-2030 ($ million)
Chart on The Netherlands - Year-over-year growth 2025-2030 (%)
Data Table on The Netherlands - Year-over-year growth 2025-2030 (%)

11.6 Middle East and Africa - Market size and forecast 2025-2030

Chart on Middle East and Africa - Market size and forecast 2025-2030 ($ million)
Data Table on Middle East and Africa - Market size and forecast 2025-2030 ($ million)
Chart on Middle East and Africa - Year-over-year growth 2025-2030 (%)
Data Table on Middle East and Africa - Year-over-year growth 2025-2030 (%)
Chart on Regional Comparison - Middle East and Africa
Data Table on Regional Comparison - Middle East and Africa

11.6.1 UAE - Market size and forecast 2025-2030

Chart on UAE - Market size and forecast 2025-2030 ($ million)
Data Table on UAE - Market size and forecast 2025-2030 ($ million)
Chart on UAE - Year-over-year growth 2025-2030 (%)
Data Table on UAE - Year-over-year growth 2025-2030 (%)

11.6.2 South Africa - Market size and forecast 2025-2030

Chart on South Africa - Market size and forecast 2025-2030 ($ million)
Data Table on South Africa - Market size and forecast 2025-2030 ($ million)
Chart on South Africa - Year-over-year growth 2025-2030 (%)
Data Table on South Africa - Year-over-year growth 2025-2030 (%)

11.6.3 Israel - Market size and forecast 2025-2030

Chart on Israel - Market size and forecast 2025-2030 ($ million)
Data Table on Israel - Market size and forecast 2025-2030 ($ million)
Chart on Israel - Year-over-year growth 2025-2030 (%)
Data Table on Israel - Year-over-year growth 2025-2030 (%)

11.6.4 Saudi Arabia - Market size and forecast 2025-2030

Chart on Saudi Arabia - Market size and forecast 2025-2030 ($ million)
Data Table on Saudi Arabia - Market size and forecast 2025-2030 ($ million)
Chart on Saudi Arabia - Year-over-year growth 2025-2030 (%)
Data Table on Saudi Arabia - Year-over-year growth 2025-2030 (%)

11.6.5 Turkey - Market size and forecast 2025-2030

Chart on Turkey - Market size and forecast 2025-2030 ($ million)
Data Table on Turkey - Market size and forecast 2025-2030 ($ million)
Chart on Turkey - Year-over-year growth 2025-2030 (%)
Data Table on Turkey - Year-over-year growth 2025-2030 (%)

11.7 South America - Market size and forecast 2025-2030

Chart on South America - Market size and forecast 2025-2030 ($ million)
Data Table on South America - Market size and forecast 2025-2030 ($ million)
Chart on South America - Year-over-year growth 2025-2030 (%)
Data Table on South America - Year-over-year growth 2025-2030 (%)
Chart on Regional Comparison - South America
Data Table on Regional Comparison - South America

11.7.1 Brazil - Market size and forecast 2025-2030

Chart on Brazil - Market size and forecast 2025-2030 ($ million)
Data Table on Brazil - Market size and forecast 2025-2030 ($ million)
Chart on Brazil - Year-over-year growth 2025-2030 (%)
Data Table on Brazil - Year-over-year growth 2025-2030 (%)

11.7.2 Argentina - Market size and forecast 2025-2030

Chart on Argentina - Market size and forecast 2025-2030 ($ million)
Data Table on Argentina - Market size and forecast 2025-2030 ($ million)
Chart on Argentina - Year-over-year growth 2025-2030 (%)
Data Table on Argentina - Year-over-year growth 2025-2030 (%)

11.7.3 Colombia - Market size and forecast 2025-2030

Chart on Colombia - Market size and forecast 2025-2030 ($ million)
Data Table on Colombia - Market size and forecast 2025-2030 ($ million)
Chart on Colombia - Year-over-year growth 2025-2030 (%)
Data Table on Colombia - Year-over-year growth 2025-2030 (%)

11.8 Market opportunity by geography

Market opportunity by geography ($ million)
Data Tables on Market opportunity by geography ($ million)

12. Drivers, Challenges, and Opportunity

12.1 Market drivers

Proliferation of advanced semiconductor and 5g technology
Accelerating global transition to renewable energy sources
Resurgence in Luxury Goods Sector and Expansion of Wellness Market

12.2 Market challenges

Extreme supply chain volatility and heightened geopolitical tensions
Significant environmental impact and escalating energy costs
Increasing competition from advanced synthetic and lab-grown alternatives

12.3 Impact of drivers and challenges

Impact of drivers and challenges in 2025 and 2030

12.4 Market opportunities

Proliferation of advanced synthetic crystals in high-frequency electronics and photonics
Ascendancy of crystalline materials in renewable energy generation and storage
Convergence of wellness, spirituality, and luxury driving natural crystal demand

13. Competitive Landscape

13.1 Overview

13.2

Overview on criticality of inputs and factors of differentiation

13.3 Landscape disruption

Overview on factors of disruption

13.4 Industry risks

Impact of key risks on business

14. Competitive Analysis

14.1 Companies profiled

Companies covered

14.2 Company ranking index

14.3 Market positioning of companies

Matrix on companies position and classification

14.4 Abracon LLC

Abracon LLC - Overview
Abracon LLC - Product / Service
Abracon LLC - Key offerings
SWOT

14.5 CTS Corp.

CTS Corp. - Overview
CTS Corp. - Product / Service
CTS Corp. - Key offerings
SWOT

14.6 Daishinku Corp.

Daishinku Corp. - Overview
Daishinku Corp. - Product / Service
Daishinku Corp. - Key offerings
SWOT

14.7 ECS Inc.

ECS Inc. - Overview
ECS Inc. - Product / Service
ECS Inc. - Key offerings
SWOT

14.8 Hongxing Technology Co. Ltd.

Hongxing Technology Co. Ltd. - Overview
Hongxing Technology Co. Ltd. - Product / Service
Hongxing Technology Co. Ltd. - Key offerings
SWOT

14.9 Kyocera Corp.

Kyocera Corp. - Overview
Kyocera Corp. - Business segments
Kyocera Corp. - Key news
Kyocera Corp. - Key offerings
Kyocera Corp. - Segment focus
SWOT

14.10 Microchip Technology Inc.

Microchip Technology Inc. - Overview
Microchip Technology Inc. - Business segments
Microchip Technology Inc. - Key news
Microchip Technology Inc. - Key offerings
Microchip Technology Inc. - Segment focus
SWOT

14.11 Murata Manufacturing Co. Ltd.

Murata Manufacturing Co. Ltd. - Overview
Murata Manufacturing Co. Ltd. - Business segments
Murata Manufacturing Co. Ltd. - Key news
Murata Manufacturing Co. Ltd. - Key offerings
Murata Manufacturing Co. Ltd. - Segment focus
SWOT

14.12 Nihon Dempa Kogyo Ltd.

Nihon Dempa Kogyo Ltd. - Overview
Nihon Dempa Kogyo Ltd. - Product / Service
Nihon Dempa Kogyo Ltd. - Key offerings
SWOT

14.13 Rakon Ltd.

Rakon Ltd. - Overview
Rakon Ltd. - Business segments
Rakon Ltd. - Key offerings
Rakon Ltd. - Segment focus
SWOT

14.14 Renesas Electronics Corp.

Renesas Electronics Corp. - Overview
Renesas Electronics Corp. - Business segments
Renesas Electronics Corp. - Key news
Renesas Electronics Corp. - Key offerings
Renesas Electronics Corp. - Segment focus
SWOT

14.15 Epson Corp.

Epson Corp. - Overview
Epson Corp. - Business segments
Epson Corp. - Key news
Epson Corp. - Key offerings
Epson Corp. - Segment focus
SWOT

14.16 SiTime Corp.

SiTime Corp. - Overview
SiTime Corp. - Product / Service
SiTime Corp. - Key offerings
SWOT

14.17 SIWARD Crystal Tech. Ltd.

SIWARD Crystal Tech. Ltd. - Overview
SIWARD Crystal Tech. Ltd. - Product / Service
SIWARD Crystal Tech. Ltd. - Key offerings
SWOT

14.18 TXC Corp.

TXC Corp. - Overview
TXC Corp. - Product / Service
TXC Corp. - Key offerings
SWOT

15. Appendix

15.1 Scope of the report

Market definition
Objectives
Notes and caveats

15.2 Inclusions and exclusions checklist

Inclusions checklist
Exclusions checklist

15.3 Currency conversion rates for US$

15.4 Research methodology

15.5 Data procurement

Information sources

15.6 Data validation

15.7 Validation techniques employed for market sizing

15.8 Data synthesis

15.9 360 degree market analysis

15.10 List of abbreviations

Research Methodology

Technavio presents a detailed picture of the market by way of study, synthesis, and summation of data from multiple sources. The analysts have presented the various facets of the market with a particular focus on identifying the key industry influencers. The data thus presented is comprehensive, reliable, and the result of extensive research, both primary and secondary.

INFORMATION SOURCES

Primary sources

  • Manufacturers and suppliers
  • Channel partners
  • Industry experts
  • Strategic decision makers

Secondary sources

  • Industry journals and periodicals
  • Government data
  • Financial reports of key industry players
  • Historical data
  • Press releases

DATA ANALYSIS

Data Synthesis

  • Collation of data
  • Estimation of key figures
  • Analysis of derived insights

Data Validation

  • Triangulation with data models
  • Reference against proprietary databases
  • Corroboration with industry experts

REPORT WRITING

Qualitative

  • Market drivers
  • Market challenges
  • Market trends
  • Five forces analysis

Quantitative

  • Market size and forecast
  • Market segmentation
  • Geographical insights
  • Competitive landscape

Interested in this report?

Get your sample now to see our research methodology and insights!

Download Now

Frequently Asked Questions

Crystal market growth will increase by USD 740.5 million during 2026-2030 .

The Crystal market is expected to grow at a CAGR of 3.4% during 2026-2030 .

Crystal market is segmented by Frequency range (MHz, KHz) Application (Oscillators, Resonators, Filters) End-user (Consumer electronics, IT and telecommunication, Automotive, Military and aerospace, Others)

Abracon LLC, CTS Corp., Daishinku Corp., ECS Inc., Hongxing Technology Co. Ltd., Jauch Quartz GmbH, Kyocera Corp., Microchip Technology Inc., Murata Manufacturing Co. Ltd., Nihon Dempa Kogyo Ltd., Rakon Ltd., RALTRON, Renesas Electronics Corp., River Eletec Corp., Epson Corp., SiTime Corp., SIWARD Crystal Tech. Ltd., TXC Corp., Wurth Elektronik GmbH and Co. KG are a few of the key vendors in the Crystal market.

APAC will register the highest growth rate of 46.8% among the other regions. Therefore, the Crystal market in APAC is expected to garner significant business opportunities for the vendors during the forecast period.

China, Japan, India, South Korea, Australia, Indonesia, US, Canada, Mexico, Germany, France, UK, Italy, Spain, The Netherlands, UAE, South Africa, Israel, Saudi Arabia, Turkey, Brazil, Argentina, Colombia

  • Proliferation of advanced semiconductor and 5g technology is the driving factor this market.

The Crystal market vendors should focus on grabbing business opportunities from the Frequency range segment as it accounted for the largest market share in the base year.