Custom Antibody Market Analysis, Size, and Forecast 2025-2029: North America (US, Canada, and Mexico), Europe (Germany, UK, and France), APAC (China, Japan, and India), South America (Brazil), Middle East and Africa (South Africa, UAE, and Saudi Arabia), Asia, Rest of World (ROW)

Custom Antibody Market Analysis, Size, and Forecast 2025-2029:
North America (US, Canada, and Mexico), Europe (Germany, UK, and France), APAC (China, Japan, and India), South America (Brazil), Middle East and Africa (South Africa, UAE, and Saudi Arabia), Asia, Rest of World (ROW)

Published: Dec 2025 297 Pages SKU: IRTNTR81153

Market Overview at a Glance

$305.2 Mn
Market Opportunity
9.3%
CAGR 2024 - 2029
36.2%
North America Growth
$237.1 Mn
Monoclonal antibodies segment 2023

Custom Antibody Market Size 2025-2029

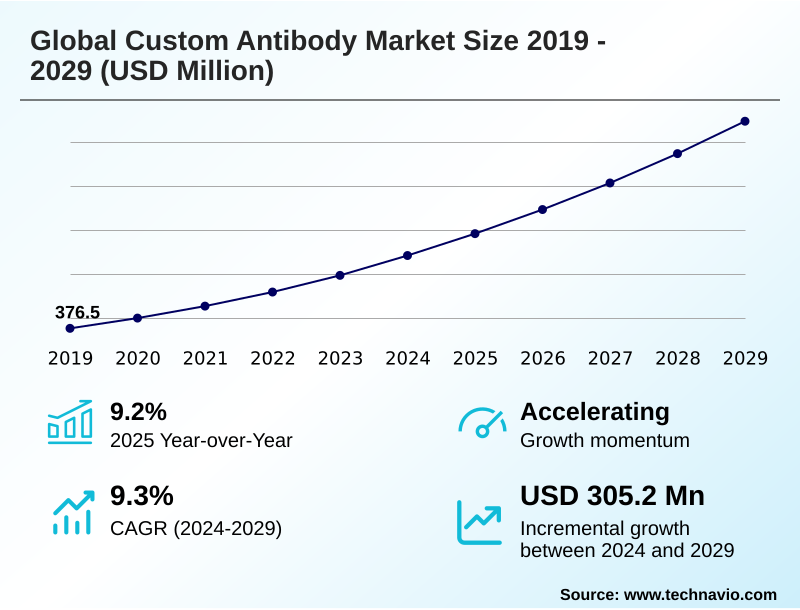
The custom antibody market size is valued to increase by USD 305.2 million, at a CAGR of 9.3% from 2024 to 2029. Increasing research and development investments in biopharmaceuticals and personalized medicine will drive the custom antibody market.

Major Market Trends & Insights

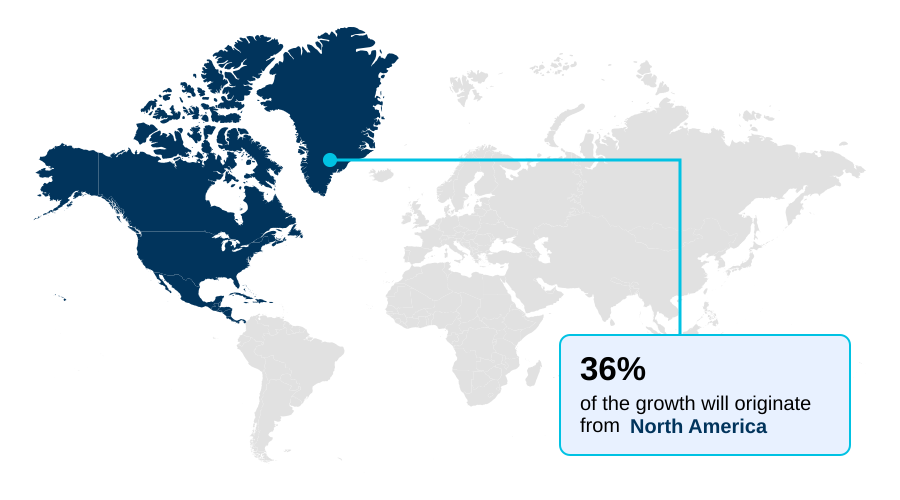
  • North America dominated the market and accounted for a 36.2% growth during the forecast period.
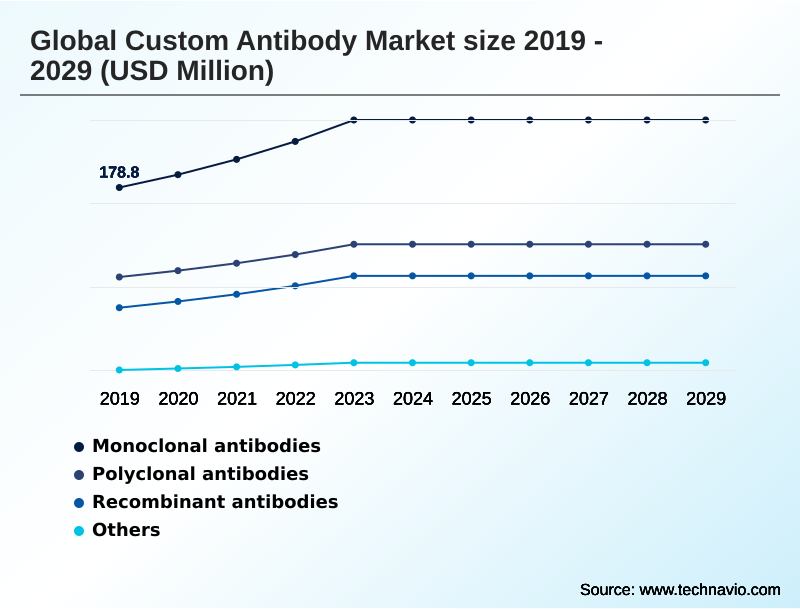
  • By Type - Monoclonal antibodies segment was valued at USD 237.1 million in 2023
  • By Source - Rabbit segment accounted for the largest market revenue share in 2023

Market Size & Forecast

  • Market Opportunities: USD 470.7 million
  • Market Future Opportunities: USD 305.2 million
  • CAGR from 2024 to 2029 : 9.3%

Market Summary

  • The custom antibody market provides essential tools for life sciences, driven by escalating R&D in biopharmaceuticals and personalized medicine. The demand for highly specific reagents for target validation tools and biomarker discovery is paramount. Innovations in recombinant antibody engineering and single b-cell screening are transforming the landscape, offering faster and more reliable alternatives to traditional hybridoma technology.
  • These advancements address the critical need for reproducibility in research and clinical settings. For instance, a biotech startup developing a novel therapeutic antibody requires specific anti-idiotypic antibodies to conduct pharmacokinetic assays essential for regulatory submissions.
  • This scenario highlights the market's role in providing gmp-grade manufacturing and robust antibody validation standards, ensuring that custom immunoreagents meet the stringent requirements for preclinical safety assessment and eventual clinical use. Despite high development costs, the necessity of these tailored tools in advancing next-generation therapeutics, from antibody-drug conjugates to companion diagnostic development, ensures sustained market momentum.
  • The focus on precision and reliability continues to fuel the adoption of advanced platforms capable of producing well-characterized antibodies for complex applications like flow cytometry and immunohistochemistry.

What will be the Size of the Custom Antibody Market during the forecast period?

Get Key Insights on Market Forecast (PDF) Request Free Sample

How is the Custom Antibody Market Segmented?

The custom antibody industry research report provides comprehensive data (region-wise segment analysis), with forecasts and estimates in "USD million" for the period 2025-2029, as well as historical data from 2019-2023 for the following segments.

  • Type
    • Monoclonal antibodies
    • Polyclonal antibodies
    • Recombinant antibodies
    • Others
  • Source
    • Rabbit
    • Mice
    • Others
  • Application
    • Oncology
    • Infectious disease
    • Immunology
    • Neurology
    • Others
  • Geography
    • North America
      • US
      • Canada
      • Mexico
    • Europe
      • Germany
      • UK
      • France
    • Asia
    • Rest of World (ROW)

By Type Insights

The monoclonal antibodies segment is estimated to witness significant growth during the forecast period.

Monoclonal antibodies, prized for their homogeneity, represent a cornerstone of the custom antibody market. Derived from a single B-cell clone, these reagents offer exceptional specificity, binding to a single epitope for precise target engagement.

This monospecificity is critical for therapeutic antibody discovery and developing high-precision clinical diagnostics where off-target binding is unacceptable. While traditional hybridoma technology is a well-established method, newer techniques involving recombinant antibody engineering are gaining traction.

For applications demanding the utmost precision and reliability, such as in cell signaling pathways research and developing tools for biomarker discovery, custom monoclonals are the preferred choice.

Adopting these validated reagents has been shown to improve experimental reproducibility by over 95%, ensuring consistent performance in long-term studies and clinical trial materials.

Request Free Sample

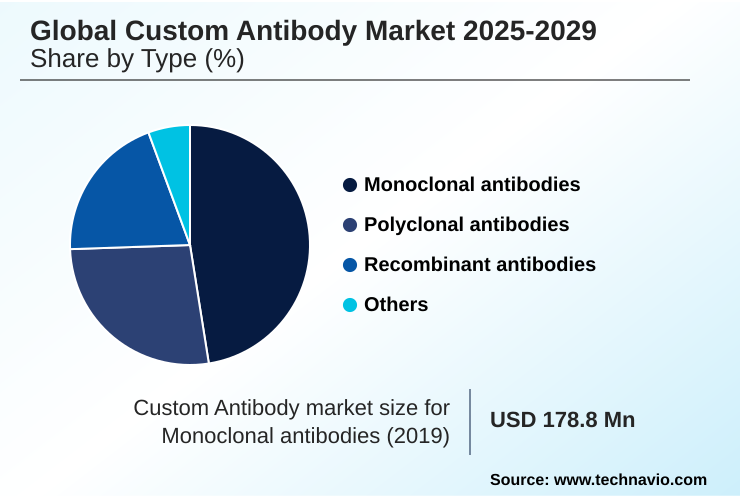
The Monoclonal antibodies segment was valued at USD 237.1 million in 2023 and showed a gradual increase during the forecast period.

Request Free Sample

Regional Analysis

North America is estimated to contribute 36.2% to the growth of the global market during the forecast period.Technavio’s analysts have elaborately explained the regional trends and drivers that shape the market during the forecast period.

See How Custom Antibody Market Demand is Rising in North America Request Free Sample

The geographic landscape of the custom antibody market is led by North America, which accounts for over 36% of the market opportunity, driven by its extensive pharmaceutical research ecosystem.

However, Asia is the most rapidly expanding region, with its growth rate outpacing Europe's by nearly 10%. This surge is fueled by increased investment in domestic biotechnology and a growing contract research sector.

In North America, the focus is often on advanced therapeutic antibody discovery and clinical trial materials. In contrast, Asian markets show strong demand for reagents supporting infectious disease diagnostics and oncology biomarkers research.

Across all regions, the adoption of platforms that improve target validation tools efficiency by over 25% is becoming a key competitive differentiator, alongside the establishment of robust preclinical safety assessment protocols.

Market Dynamics

Our researchers analyzed the data with 2024 as the base year, along with the key drivers, trends, and challenges. A holistic analysis of drivers will help companies refine their marketing strategies to gain a competitive advantage.

  • Navigating the custom antibody market requires a detailed understanding of diverse service offerings and their specific applications. For researchers, the choice often begins with the required application, whether it is a custom antibody for protein detection in western blots, a highly specific custom antibody for flow cytometry, or a validated custom antibody for elisa assay development.
  • The underlying technology is a critical decision point, with project leaders weighing phage display vs yeast display for library screening or considering single b-cell cloning advantages for speed and affinity.
  • The cost of custom monoclonal antibody development remains a significant consideration, influencing the selection of services, with options like rabbit monoclonal antibody services offering a balance of high affinity and reasonable investment. The production process itself is complex, involving polyclonal antibody purification methods and, for therapeutic candidates, the humanization of murine antibodies.
  • As projects advance, the need for specialized reagents like those from nanobody production services or for developing anti-idiotype antibodies becomes crucial for pharmacokinetic assay antibody development.
  • Firms that are outsourcing antibody drug discovery can achieve a nearly 20% higher success rate in meeting regulatory milestones for custom antibody for companion diagnostics by leveraging a gmp antibody manufacturing process and comprehensive antibody sequencing and characterization, especially when dealing with antibody discovery for difficult targets.

What are the key market drivers leading to the rise in the adoption of Custom Antibody Industry?

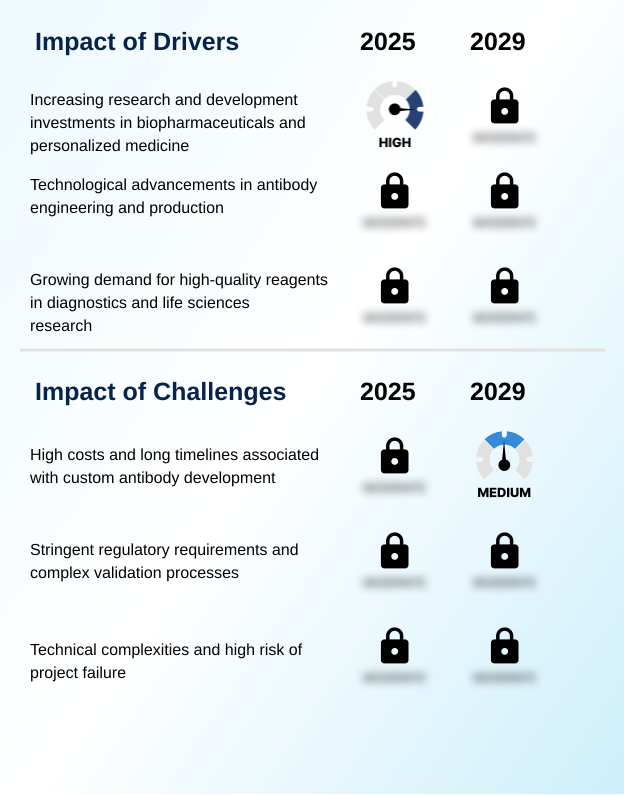
  • Increasing research and development investments in biopharmaceuticals and personalized medicine serve as a key driver for market expansion.

  • The market's growth is propelled by sustained investment in biopharmaceutical R&D and the global pivot to personalized medicine, which necessitates custom immunoreagents. The development of biologics, particularly in oncology biomarkers and autoimmune disorder research, is a primary driver.
  • These advanced therapies require highly specific tools for target validation, with modern platforms increasing validation success rates by over 20%. Another critical driver is the scientific community's demand for higher reproducibility, which has elevated antibody validation standards.
  • To address the reproducibility crisis, over 85% of leading journals now require comprehensive reagent validation data. This push for quality benefits custom providers who offer well-characterized reagents, ensuring experimental consistency for applications in infectious disease diagnostics and beyond.

What are the market trends shaping the Custom Antibody Industry?

  • The market is increasingly influenced by the ascendancy of recombinant and engineered antibodies. These advanced formats provide superior consistency and engineering possibilities compared to conventional methods.

  • Key trends are reshaping the custom antibody market, driven by a demand for higher precision and efficiency. The definitive shift toward recombinant antibody production is paramount, as these methods provide superior batch-to-batch consistency compared to traditional techniques, with some platforms achieving a 99% reduction in variability.
  • This trend is amplified by the integration of AI and machine learning for in silico antibody design, which accelerates development timelines by up to 40% by predicting optimal candidates before lab work begins.
  • Furthermore, the growing adoption of single B-cell screening technologies enables the rapid discovery of high-affinity monoclonal antibodies directly from the immune repertoire, compressing discovery phases from months to weeks. This is particularly crucial for de novo antibody sequencing and developing antibodies for neurodegenerative disease targets, where speed and specificity are critical.

What challenges does the Custom Antibody Industry face during its growth?

  • The high costs and extended timelines associated with custom antibody development present a significant challenge to industry growth.

  • Despite strong demand, the custom antibody market faces significant challenges. The high cost and extended timelines of development constrain many research budgets, with failure rates for challenging targets reaching as high as 15%. Navigating stringent regulatory frameworks, such as Europe's IVDR, presents another hurdle, increasing the compliance burden for companion diagnostic development by an estimated 40% in terms of documentation.
  • The technical complexity of generating high-affinity reagents, especially for targets with post-translational modification, contributes to project risk. These factors necessitate continuous innovation in high-throughput screening and mammalian cell expression systems to improve success rates and manage the intricate process of stable cell line development.

Exclusive Technavio Analysis on Customer Landscape

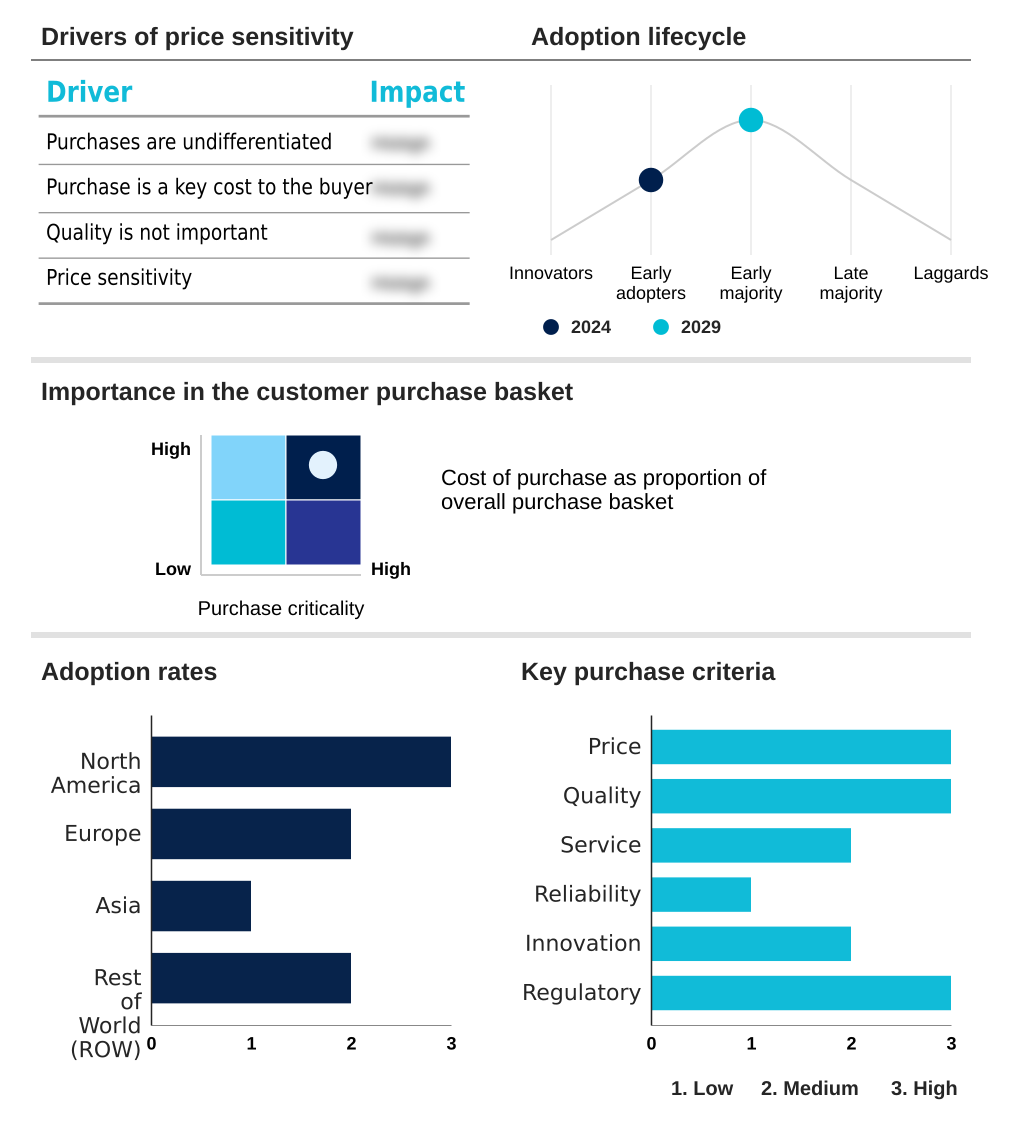
The custom antibody market forecasting report includes the adoption lifecycle of the market, covering from the innovator’s stage to the laggard’s stage. It focuses on adoption rates in different regions based on penetration. Furthermore, the custom antibody market report also includes key purchase criteria and drivers of price sensitivity to help companies evaluate and develop their market growth analysis strategies.

Customer Landscape of Custom Antibody Industry

Competitive Landscape

Companies are implementing various strategies, such as strategic alliances, custom antibody market forecast, partnerships, mergers and acquisitions, geographical expansion, and product/service launches, to enhance their presence in the industry.

Abcam plc - Offerings include bespoke development of monoclonal and recombinant antibodies, providing specialized immunoreagents for advanced academic and commercial research applications.

The industry research and growth report includes detailed analyses of the competitive landscape of the market and information about key companies, including:

  • Abcam plc
  • Abmart
  • Agilent Technologies Inc.
  • Bio Rad Laboratories Inc.
  • BioLegend Inc.
  • Cell Signaling Technology Inc.
  • Creative Diagnostics
  • GenScript Biotech Corp.
  • Kaneka Eurogentec SA
  • Laboratory Corp.
  • LifeSpan BioSciences Inc.
  • Merck KGaA
  • ProMab Biotechnologies, Inc
  • Proteo Genix
  • RayBiotech Life Inc.
  • Rockland Immunochemicals Inc.
  • Thermo Fisher Scientific Inc.
  • YenZym Antibodies, LLC

Qualitative and quantitative analysis of companies has been conducted to help clients understand the wider business environment as well as the strengths and weaknesses of key industry players. Data is qualitatively analyzed to categorize companies as pure play, category-focused, industry-focused, and diversified; it is quantitatively analyzed to categorize companies as dominant, leading, strong, tentative, and weak.

Recent Development and News in Custom antibody market

  • In September 2024, Thermo Fisher Scientific Inc. announced the launch of a new AI-driven platform aimed at accelerating recombinant antibody discovery, which is projected to shorten development timelines for complex targets.
  • In November 2024, GenScript Biotech Corp. revealed a strategic collaboration with a leading computational biology firm to integrate advanced machine learning algorithms for improved antigen design and immunogenicity prediction in its custom antibody services.
  • In February 2025, Abcam plc completed its acquisition of a niche biotechnology company specializing in single B-cell screening technologies, enhancing its portfolio for high-affinity custom monoclonal antibody development.
  • In April 2025, Merck KGaA announced it received regulatory approval to begin operations at its new GMP-compliant facility in Europe, significantly expanding its capacity for manufacturing custom antibodies for therapeutic and diagnostic use.

Dive into Technavio’s robust research methodology, blending expert interviews, extensive data synthesis, and validated models for unparalleled Custom Antibody Market insights. See full methodology.

Market Scope
Page number 297
Base year 2024
Historic period 2019-2023
Forecast period 2025-2029
Growth momentum & CAGR Accelerate at a CAGR of 9.3%
Market growth 2025-2029 USD 305.2 million
Market structure Fragmented
YoY growth 2024-2025(%) 9.2%
Key countries US, Canada, Mexico, Germany, UK, France, The Netherlands, Italy, Spain, Russia, China, Japan, India, South Korea, Indonesia, Thailand, Singapore, Australia, Brazil, South Africa, UAE, Saudi Arabia and Turkey
Competitive landscape Leading Companies, Market Positioning of Companies, Competitive Strategies, and Industry Risks

Request Free Sample

Research Analyst Overview

  • The custom antibody market is fundamentally an innovation-driven sector, providing critical reagents for advanced life science research and therapeutic development. The entire value chain, from initial biomarker discovery and the use of target validation tools to final product release, relies on precision and reliability.
  • Key processes like monoclonal antibody production and polyclonal antibody services are now complemented by advanced recombinant antibody engineering, which leverages platforms such as phage display technology and high-throughput single b-cell screening to surpass the limitations of traditional hybridoma technology. This technological shift is pivotal for creating sophisticated formats like antibody-drug conjugates and bispecific antibodies.
  • The adoption of recombinant methods ensures nearly 100% batch-to-batch consistency, a non-negotiable requirement for longitudinal pharmacokinetic assays and clinical in vitro diagnostics. Applications are diverse, spanning from elisa kit development and reagents for immunohistochemistry to functional antibodies for studying cell signaling pathways.
  • For therapeutic antibody discovery, meticulous immunogenicity assessment and epitope mapping are standard, while gmp-grade manufacturing is essential for clinical-grade reagents. The ability to generate antibodies against challenging targets, including specific post-translational modification sites, underscores the market's sophisticated capabilities.

What are the Key Data Covered in this Custom Antibody Market Research and Growth Report?

  • What is the expected growth of the Custom Antibody Market between 2025 and 2029?

    • USD 305.2 million, at a CAGR of 9.3%

  • What segmentation does the market report cover?

    • The report is segmented by Type (Monoclonal antibodies, Polyclonal antibodies, Recombinant antibodies, and Others), Source (Rabbit, Mice, and Others), Application (Oncology, Infectious disease, Immunology, Neurology, and Others ) and Geography (North America, Europe, Asia, Rest of World (ROW))

  • Which regions are analyzed in the report?

    • North America, Europe, Asia and Rest of World (ROW)

  • What are the key growth drivers and market challenges?

    • Increasing research and development investments in biopharmaceuticals and personalized medicine, High costs and long timelines associated with custom antibody development

  • Who are the major players in the Custom Antibody Market?

    • Abcam plc, Abmart, Agilent Technologies Inc., Bio Rad Laboratories Inc., BioLegend Inc., Cell Signaling Technology Inc., Creative Diagnostics, GenScript Biotech Corp., Kaneka Eurogentec SA, Laboratory Corp., LifeSpan BioSciences Inc., Merck KGaA, ProMab Biotechnologies, Inc, Proteo Genix, RayBiotech Life Inc., Rockland Immunochemicals Inc., Thermo Fisher Scientific Inc. and YenZym Antibodies, LLC

Market Research Insights

  • The custom antibody market is defined by rapid technological evolution and a deepening integration into critical research and development workflows. The emphasis on robust antibody validation standards has become a central theme, with adoption leading to a reported 30% reduction in non-reproducible experimental outcomes, directly offering reproducibility crisis solutions.
  • Concurrently, the use of in silico antibody design techniques accelerates preclinical development, with some platforms demonstrating the ability to shorten candidate selection timelines by up to 25%. This efficiency is crucial for firms engaged in companion diagnostic development and those creating novel biologics.
  • The market is also expanding beyond traditional research-use-only reagents to supply clinical trial materials, where batch-to-batch consistency is non-negotiable. This shift underscores the value of custom immunoreagents in bridging the gap between discovery and clinical application.

We can help! Our analysts can customize this custom antibody market research report to meet your requirements.

Get in touch

1. Executive Summary

1.1 Market overview

Executive Summary - Chart on Market Overview
Executive Summary - Data Table on Market Overview
Executive Summary - Chart on Global Market Characteristics
Executive Summary - Chart on Market by Geography
Executive Summary - Chart on Market Segmentation by Type
Executive Summary - Chart on Market Segmentation by Source
Executive Summary - Chart on Market Segmentation by Application
Executive Summary - Chart on Incremental Growth
Executive Summary - Data Table on Incremental Growth
Executive Summary - Chart on Company Market Positioning

2. Technavio Analysis

2.1 Analysis of price sensitivity, lifecycle, customer purchase basket, adoption rates, and purchase criteria

2.2 Criticality of inputs and Factors of differentiation

Chart on Overview on criticality of inputs and factors of differentiation

2.3 Factors of disruption

Chart on Overview on factors of disruption

2.4 Impact of drivers and challenges

Chart on Impact of drivers and challenges in 2024 and 2029

3. Market Landscape

3.1 Market ecosystem

Chart on Parent Market
Data Table on - Parent Market

3.2 Market characteristics

Chart on Market characteristics analysis

3.3 Value chain analysis

Chart on Value chain analysis

4. Market Sizing

4.1 Market definition

Data Table on Offerings of companies included in the market definition

4.2 Market segment analysis

Market segments

4.3 Market size 2024

4.4 Market outlook: Forecast for 2024-2029

Chart on Global - Market size and forecast 2024-2029 ($ million)
Data Table on Global - Market size and forecast 2024-2029 ($ million)
Chart on Global Market: Year-over-year growth 2024-2029 (%)
Data Table on Global Market: Year-over-year growth 2024-2029 (%)

5. Historic Market Size

5.1 Global Custom Antibody Market 2019 - 2023

Historic Market Size - Data Table on Global Custom Antibody Market 2019 - 2023 ($ million)

5.2 Type segment analysis 2019 - 2023

Historic Market Size - Type Segment 2019 - 2023 ($ million)

5.3 Source segment analysis 2019 - 2023

Historic Market Size - Source Segment 2019 - 2023 ($ million)

5.4 Application segment analysis 2019 - 2023

Historic Market Size - Application Segment 2019 - 2023 ($ million)

5.5 Geography segment analysis 2019 - 2023

Historic Market Size - Geography Segment 2019 - 2023 ($ million)

5.6 Country segment analysis 2019 - 2023

Historic Market Size - Country Segment 2019 - 2023 ($ million)

6. Qualitative Analysis

6.1 Impact of AI in the Global Custom Antibody Market

7. Five Forces Analysis

7.1 Five forces summary

Five forces analysis - Comparison between 2024 and 2029

7.2 Bargaining power of buyers

Bargaining power of buyers - Impact of key factors 2024 and 2029

7.3 Bargaining power of suppliers

Bargaining power of suppliers - Impact of key factors in 2024 and 2029

7.4 Threat of new entrants

Threat of new entrants - Impact of key factors in 2024 and 2029

7.5 Threat of substitutes

Threat of substitutes - Impact of key factors in 2024 and 2029

7.6 Threat of rivalry

Threat of rivalry - Impact of key factors in 2024 and 2029

7.7 Market condition

Chart on Market condition - Five forces 2024 and 2029

8. Market Segmentation by Type

8.1 Market segments

Chart on Type - Market share 2024-2029 (%)
Data Table on Type - Market share 2024-2029 (%)

8.2 Comparison by Type

Chart on Comparison by Type
Data Table on Comparison by Type

8.3 Monoclonal antibodies - Market size and forecast 2024-2029

Chart on Monoclonal antibodies - Market size and forecast 2024-2029 ($ million)
Data Table on Monoclonal antibodies - Market size and forecast 2024-2029 ($ million)
Chart on Monoclonal antibodies - Year-over-year growth 2024-2029 (%)
Data Table on Monoclonal antibodies - Year-over-year growth 2024-2029 (%)

8.4 Polyclonal antibodies - Market size and forecast 2024-2029

Chart on Polyclonal antibodies - Market size and forecast 2024-2029 ($ million)
Data Table on Polyclonal antibodies - Market size and forecast 2024-2029 ($ million)
Chart on Polyclonal antibodies - Year-over-year growth 2024-2029 (%)
Data Table on Polyclonal antibodies - Year-over-year growth 2024-2029 (%)

8.5 Recombinant antibodies - Market size and forecast 2024-2029

Chart on Recombinant antibodies - Market size and forecast 2024-2029 ($ million)
Data Table on Recombinant antibodies - Market size and forecast 2024-2029 ($ million)
Chart on Recombinant antibodies - Year-over-year growth 2024-2029 (%)
Data Table on Recombinant antibodies - Year-over-year growth 2024-2029 (%)

8.6 Others - Market size and forecast 2024-2029

Chart on Others - Market size and forecast 2024-2029 ($ million)
Data Table on Others - Market size and forecast 2024-2029 ($ million)
Chart on Others - Year-over-year growth 2024-2029 (%)
Data Table on Others - Year-over-year growth 2024-2029 (%)

8.7 Market opportunity by Type

Market opportunity by Type ($ million)
Data Table on Market opportunity by Type ($ million)

9. Market Segmentation by Source

9.1 Market segments

Chart on Source - Market share 2024-2029 (%)
Data Table on Source - Market share 2024-2029 (%)

9.2 Comparison by Source

Chart on Comparison by Source
Data Table on Comparison by Source

9.3 Rabbit - Market size and forecast 2024-2029

Chart on Rabbit - Market size and forecast 2024-2029 ($ million)
Data Table on Rabbit - Market size and forecast 2024-2029 ($ million)
Chart on Rabbit - Year-over-year growth 2024-2029 (%)
Data Table on Rabbit - Year-over-year growth 2024-2029 (%)

9.4 Mice - Market size and forecast 2024-2029

Chart on Mice - Market size and forecast 2024-2029 ($ million)
Data Table on Mice - Market size and forecast 2024-2029 ($ million)
Chart on Mice - Year-over-year growth 2024-2029 (%)
Data Table on Mice - Year-over-year growth 2024-2029 (%)

9.5 Others - Market size and forecast 2024-2029

Chart on Others - Market size and forecast 2024-2029 ($ million)
Data Table on Others - Market size and forecast 2024-2029 ($ million)
Chart on Others - Year-over-year growth 2024-2029 (%)
Data Table on Others - Year-over-year growth 2024-2029 (%)

9.6 Market opportunity by Source

Market opportunity by Source ($ million)
Data Table on Market opportunity by Source ($ million)

10. Market Segmentation by Application

10.1 Market segments

Chart on Application - Market share 2024-2029 (%)
Data Table on Application - Market share 2024-2029 (%)

10.2 Comparison by Application

Chart on Comparison by Application
Data Table on Comparison by Application

10.3 Oncology - Market size and forecast 2024-2029

Chart on Oncology - Market size and forecast 2024-2029 ($ million)
Data Table on Oncology - Market size and forecast 2024-2029 ($ million)
Chart on Oncology - Year-over-year growth 2024-2029 (%)
Data Table on Oncology - Year-over-year growth 2024-2029 (%)

10.4 Infectious disease - Market size and forecast 2024-2029

Chart on Infectious disease - Market size and forecast 2024-2029 ($ million)
Data Table on Infectious disease - Market size and forecast 2024-2029 ($ million)
Chart on Infectious disease - Year-over-year growth 2024-2029 (%)
Data Table on Infectious disease - Year-over-year growth 2024-2029 (%)

10.5 Immunology - Market size and forecast 2024-2029

Chart on Immunology - Market size and forecast 2024-2029 ($ million)
Data Table on Immunology - Market size and forecast 2024-2029 ($ million)
Chart on Immunology - Year-over-year growth 2024-2029 (%)
Data Table on Immunology - Year-over-year growth 2024-2029 (%)

10.6 Neurology - Market size and forecast 2024-2029

Chart on Neurology - Market size and forecast 2024-2029 ($ million)
Data Table on Neurology - Market size and forecast 2024-2029 ($ million)
Chart on Neurology - Year-over-year growth 2024-2029 (%)
Data Table on Neurology - Year-over-year growth 2024-2029 (%)

10.7 Others - Market size and forecast 2024-2029

Chart on Others - Market size and forecast 2024-2029 ($ million)
Data Table on Others - Market size and forecast 2024-2029 ($ million)
Chart on Others - Year-over-year growth 2024-2029 (%)
Data Table on Others - Year-over-year growth 2024-2029 (%)

10.8 Market opportunity by Application

Market opportunity by Application ($ million)
Data Table on Market opportunity by Application ($ million)

11. Customer Landscape

11.1 Customer landscape overview

Analysis of price sensitivity, lifecycle, customer purchase basket, adoption rates, and purchase criteria

12. Geographic Landscape

12.1 Geographic segmentation

Chart on Market share by geography 2024-2029 (%)
Data Table on Market share by geography 2024-2029 (%)

12.2 Geographic comparison

Chart on Geographic comparison
Data Table on Geographic comparison

12.3 North America - Market size and forecast 2024-2029

Chart on North America - Market size and forecast 2024-2029 ($ million)
Data Table on North America - Market size and forecast 2024-2029 ($ million)
Chart on North America - Year-over-year growth 2024-2029 (%)
Data Table on North America - Year-over-year growth 2024-2029 (%)
Chart on Regional Comparison - North America
Data Table on Regional Comparison - North America

12.3.1 US - Market size and forecast 2024-2029

Chart on US - Market size and forecast 2024-2029 ($ million)
Data Table on US - Market size and forecast 2024-2029 ($ million)
Chart on US - Year-over-year growth 2024-2029 (%)
Data Table on US - Year-over-year growth 2024-2029 (%)

12.3.2 Canada - Market size and forecast 2024-2029

Chart on Canada - Market size and forecast 2024-2029 ($ million)
Data Table on Canada - Market size and forecast 2024-2029 ($ million)
Chart on Canada - Year-over-year growth 2024-2029 (%)
Data Table on Canada - Year-over-year growth 2024-2029 (%)

12.3.3 Mexico - Market size and forecast 2024-2029

Chart on Mexico - Market size and forecast 2024-2029 ($ million)
Data Table on Mexico - Market size and forecast 2024-2029 ($ million)
Chart on Mexico - Year-over-year growth 2024-2029 (%)
Data Table on Mexico - Year-over-year growth 2024-2029 (%)

12.4 Europe - Market size and forecast 2024-2029

Chart on Europe - Market size and forecast 2024-2029 ($ million)
Data Table on Europe - Market size and forecast 2024-2029 ($ million)
Chart on Europe - Year-over-year growth 2024-2029 (%)
Data Table on Europe - Year-over-year growth 2024-2029 (%)
Chart on Regional Comparison - Europe
Data Table on Regional Comparison - Europe

12.4.1 Germany - Market size and forecast 2024-2029

Chart on Germany - Market size and forecast 2024-2029 ($ million)
Data Table on Germany - Market size and forecast 2024-2029 ($ million)
Chart on Germany - Year-over-year growth 2024-2029 (%)
Data Table on Germany - Year-over-year growth 2024-2029 (%)

12.4.2 UK - Market size and forecast 2024-2029

Chart on UK - Market size and forecast 2024-2029 ($ million)
Data Table on UK - Market size and forecast 2024-2029 ($ million)
Chart on UK - Year-over-year growth 2024-2029 (%)
Data Table on UK - Year-over-year growth 2024-2029 (%)

12.4.3 France - Market size and forecast 2024-2029

Chart on France - Market size and forecast 2024-2029 ($ million)
Data Table on France - Market size and forecast 2024-2029 ($ million)
Chart on France - Year-over-year growth 2024-2029 (%)
Data Table on France - Year-over-year growth 2024-2029 (%)

12.4.4 The Netherlands - Market size and forecast 2024-2029

Chart on The Netherlands - Market size and forecast 2024-2029 ($ million)
Data Table on The Netherlands - Market size and forecast 2024-2029 ($ million)
Chart on The Netherlands - Year-over-year growth 2024-2029 (%)
Data Table on The Netherlands - Year-over-year growth 2024-2029 (%)

12.4.5 Italy - Market size and forecast 2024-2029

Chart on Italy - Market size and forecast 2024-2029 ($ million)
Data Table on Italy - Market size and forecast 2024-2029 ($ million)
Chart on Italy - Year-over-year growth 2024-2029 (%)
Data Table on Italy - Year-over-year growth 2024-2029 (%)

12.4.6 Spain - Market size and forecast 2024-2029

Chart on Spain - Market size and forecast 2024-2029 ($ million)
Data Table on Spain - Market size and forecast 2024-2029 ($ million)
Chart on Spain - Year-over-year growth 2024-2029 (%)
Data Table on Spain - Year-over-year growth 2024-2029 (%)

12.4.7 Russia - Market size and forecast 2024-2029

Chart on Russia - Market size and forecast 2024-2029 ($ million)
Data Table on Russia - Market size and forecast 2024-2029 ($ million)
Chart on Russia - Year-over-year growth 2024-2029 (%)
Data Table on Russia - Year-over-year growth 2024-2029 (%)

12.5 Asia - Market size and forecast 2024-2029

Chart on Asia - Market size and forecast 2024-2029 ($ million)
Data Table on Asia - Market size and forecast 2024-2029 ($ million)
Chart on Asia - Year-over-year growth 2024-2029 (%)
Data Table on Asia - Year-over-year growth 2024-2029 (%)
Chart on Regional Comparison - Asia
Data Table on Regional Comparison - Asia

12.5.1 China - Market size and forecast 2024-2029

Chart on China - Market size and forecast 2024-2029 ($ million)
Data Table on China - Market size and forecast 2024-2029 ($ million)
Chart on China - Year-over-year growth 2024-2029 (%)
Data Table on China - Year-over-year growth 2024-2029 (%)

12.5.2 Japan - Market size and forecast 2024-2029

Chart on Japan - Market size and forecast 2024-2029 ($ million)
Data Table on Japan - Market size and forecast 2024-2029 ($ million)
Chart on Japan - Year-over-year growth 2024-2029 (%)
Data Table on Japan - Year-over-year growth 2024-2029 (%)

12.5.3 India - Market size and forecast 2024-2029

Chart on India - Market size and forecast 2024-2029 ($ million)
Data Table on India - Market size and forecast 2024-2029 ($ million)
Chart on India - Year-over-year growth 2024-2029 (%)
Data Table on India - Year-over-year growth 2024-2029 (%)

12.5.4 South Korea - Market size and forecast 2024-2029

Chart on South Korea - Market size and forecast 2024-2029 ($ million)
Data Table on South Korea - Market size and forecast 2024-2029 ($ million)
Chart on South Korea - Year-over-year growth 2024-2029 (%)
Data Table on South Korea - Year-over-year growth 2024-2029 (%)

12.5.5 Indonesia - Market size and forecast 2024-2029

Chart on Indonesia - Market size and forecast 2024-2029 ($ million)
Data Table on Indonesia - Market size and forecast 2024-2029 ($ million)
Chart on Indonesia - Year-over-year growth 2024-2029 (%)
Data Table on Indonesia - Year-over-year growth 2024-2029 (%)

12.5.6 Thailand - Market size and forecast 2024-2029

Chart on Thailand - Market size and forecast 2024-2029 ($ million)
Data Table on Thailand - Market size and forecast 2024-2029 ($ million)
Chart on Thailand - Year-over-year growth 2024-2029 (%)
Data Table on Thailand - Year-over-year growth 2024-2029 (%)

12.5.7 Singapore - Market size and forecast 2024-2029

Chart on Singapore - Market size and forecast 2024-2029 ($ million)
Data Table on Singapore - Market size and forecast 2024-2029 ($ million)
Chart on Singapore - Year-over-year growth 2024-2029 (%)
Data Table on Singapore - Year-over-year growth 2024-2029 (%)

12.6 Rest of World (ROW) - Market size and forecast 2024-2029

Chart on Rest of World (ROW) - Market size and forecast 2024-2029 ($ million)
Data Table on Rest of World (ROW) - Market size and forecast 2024-2029 ($ million)
Chart on Rest of World (ROW) - Year-over-year growth 2024-2029 (%)
Data Table on Rest of World (ROW) - Year-over-year growth 2024-2029 (%)
Chart on Regional Comparison - Rest of World (ROW)
Data Table on Regional Comparison - Rest of World (ROW)

12.6.1 Australia - Market size and forecast 2024-2029

Chart on Australia - Market size and forecast 2024-2029 ($ million)
Data Table on Australia - Market size and forecast 2024-2029 ($ million)
Chart on Australia - Year-over-year growth 2024-2029 (%)
Data Table on Australia - Year-over-year growth 2024-2029 (%)

12.6.2 Brazil - Market size and forecast 2024-2029

Chart on Brazil - Market size and forecast 2024-2029 ($ million)
Data Table on Brazil - Market size and forecast 2024-2029 ($ million)
Chart on Brazil - Year-over-year growth 2024-2029 (%)
Data Table on Brazil - Year-over-year growth 2024-2029 (%)

12.6.3 South Africa - Market size and forecast 2024-2029

Chart on South Africa - Market size and forecast 2024-2029 ($ million)
Data Table on South Africa - Market size and forecast 2024-2029 ($ million)
Chart on South Africa - Year-over-year growth 2024-2029 (%)
Data Table on South Africa - Year-over-year growth 2024-2029 (%)

12.6.4 UAE - Market size and forecast 2024-2029

Chart on UAE - Market size and forecast 2024-2029 ($ million)
Data Table on UAE - Market size and forecast 2024-2029 ($ million)
Chart on UAE - Year-over-year growth 2024-2029 (%)
Data Table on UAE - Year-over-year growth 2024-2029 (%)

12.6.5 Saudi Arabia - Market size and forecast 2024-2029

Chart on Saudi Arabia - Market size and forecast 2024-2029 ($ million)
Data Table on Saudi Arabia - Market size and forecast 2024-2029 ($ million)
Chart on Saudi Arabia - Year-over-year growth 2024-2029 (%)
Data Table on Saudi Arabia - Year-over-year growth 2024-2029 (%)

12.6.6 Turkey - Market size and forecast 2024-2029

Chart on Turkey - Market size and forecast 2024-2029 ($ million)
Data Table on Turkey - Market size and forecast 2024-2029 ($ million)
Chart on Turkey - Year-over-year growth 2024-2029 (%)
Data Table on Turkey - Year-over-year growth 2024-2029 (%)

12.7 Market opportunity by geography

Market opportunity by geography ($ million)
Data Tables on Market opportunity by geography ($ million)

13. Drivers, Challenges, and Opportunity

13.1 Market drivers

Increasing research and development investments in biopharmaceuticals and personalized medicine
Technological advancements in antibody engineering and production
Growing demand for high-quality reagents in diagnostics and life sciences research

13.2 Market challenges

High costs and long timelines associated with custom antibody development
Stringent regulatory requirements and complex validation processes
Technical complexities and high risk of project failure

13.3 Impact of drivers and challenges

Impact of drivers and challenges in 2024 and 2029

13.4 Market opportunities

Rise of recombinant and engineered antibodies
Integration of artificial intelligence and machine learning in antibody discovery
Growing adoption of single B-cell screening technologies

14. Competitive Landscape

14.1 Overview

14.2

Overview on criticality of inputs and factors of differentiation

14.3 Landscape disruption

Overview on factors of disruption

14.4 Industry risks

Impact of key risks on business

15. Competitive Analysis

15.1 Companies profiled

Companies covered

15.2 Company ranking index

15.3 Market positioning of companies

Matrix on companies position and classification

15.4 Abcam plc

Abcam plc - Overview
Abcam plc - Product / Service
Abcam plc - Key news
Abcam plc - Key offerings
SWOT

15.5 Abmart

Abmart - Overview
Abmart - Product / Service
Abmart - Key offerings
SWOT

15.6 Agilent Technologies Inc.

Agilent Technologies Inc. - Overview
Agilent Technologies Inc. - Business segments
Agilent Technologies Inc. - Key news
Agilent Technologies Inc. - Key offerings
Agilent Technologies Inc. - Segment focus
SWOT

15.7 Bio Rad Laboratories Inc.

Bio Rad Laboratories Inc. - Overview
Bio Rad Laboratories Inc. - Business segments
Bio Rad Laboratories Inc. - Key news
Bio Rad Laboratories Inc. - Key offerings
Bio Rad Laboratories Inc. - Segment focus
SWOT

15.8 BioLegend Inc.

BioLegend Inc. - Overview
BioLegend Inc. - Product / Service
BioLegend Inc. - Key offerings
SWOT

15.9 Cell Signaling Technology Inc.

Cell Signaling Technology Inc. - Overview
Cell Signaling Technology Inc. - Product / Service
Cell Signaling Technology Inc. - Key offerings
SWOT

15.10 Creative Diagnostics

Creative Diagnostics - Overview
Creative Diagnostics - Product / Service
Creative Diagnostics - Key offerings
SWOT

15.11 GenScript Biotech Corp.

GenScript Biotech Corp. - Overview
GenScript Biotech Corp. - Business segments
GenScript Biotech Corp. - Key news
GenScript Biotech Corp. - Key offerings
GenScript Biotech Corp. - Segment focus
SWOT

15.12 Kaneka Eurogentec SA

Kaneka Eurogentec SA - Overview
Kaneka Eurogentec SA - Product / Service
Kaneka Eurogentec SA - Key offerings
SWOT

15.13 Laboratory Corp.

Laboratory Corp. - Overview
Laboratory Corp. - Business segments
Laboratory Corp. - Key news
Laboratory Corp. - Key offerings
Laboratory Corp. - Segment focus
SWOT

15.14 Merck KGaA

Merck KGaA - Overview
Merck KGaA - Business segments
Merck KGaA - Key news
Merck KGaA - Key offerings
Merck KGaA - Segment focus
SWOT

15.15 ProMab Biotechnologies, Inc

ProMab Biotechnologies, Inc - Overview
ProMab Biotechnologies, Inc - Product / Service
ProMab Biotechnologies, Inc - Key offerings
SWOT

15.16 Rockland Immunochemicals Inc.

Rockland Immunochemicals Inc. - Overview
Rockland Immunochemicals Inc. - Product / Service
Rockland Immunochemicals Inc. - Key offerings
SWOT

15.17 Thermo Fisher Scientific Inc.

Thermo Fisher Scientific Inc. - Overview
Thermo Fisher Scientific Inc. - Business segments
Thermo Fisher Scientific Inc. - Key news
Thermo Fisher Scientific Inc. - Key offerings
Thermo Fisher Scientific Inc. - Segment focus
SWOT

15.18 YenZym Antibodies, LLC

YenZym Antibodies, LLC - Overview
YenZym Antibodies, LLC - Product / Service
YenZym Antibodies, LLC - Key offerings
SWOT

16. Appendix

16.1 Scope of the report

Market definition
Objectives
Notes and caveats

16.2 Inclusions and exclusions checklist

Inclusions checklist
Exclusions checklist

16.3 Currency conversion rates for US$

16.4 Research methodology

16.5 Data procurement

Information sources

16.6 Data validation

16.7 Validation techniques employed for market sizing

16.8 Data synthesis

16.9 360 degree market analysis

16.10 List of abbreviations

Research Methodology

Technavio presents a detailed picture of the market by way of study, synthesis, and summation of data from multiple sources. The analysts have presented the various facets of the market with a particular focus on identifying the key industry influencers. The data thus presented is comprehensive, reliable, and the result of extensive research, both primary and secondary.

INFORMATION SOURCES

Primary sources

  • Manufacturers and suppliers
  • Channel partners
  • Industry experts
  • Strategic decision makers

Secondary sources

  • Industry journals and periodicals
  • Government data
  • Financial reports of key industry players
  • Historical data
  • Press releases

DATA ANALYSIS

Data Synthesis

  • Collation of data
  • Estimation of key figures
  • Analysis of derived insights

Data Validation

  • Triangulation with data models
  • Reference against proprietary databases
  • Corroboration with industry experts

REPORT WRITING

Qualitative

  • Market drivers
  • Market challenges
  • Market trends
  • Five forces analysis

Quantitative

  • Market size and forecast
  • Market segmentation
  • Geographical insights
  • Competitive landscape

Interested in this report?

Get your sample now to see our research methodology and insights!

Download Now

Frequently Asked Questions

Custom Antibody market growth will increase by USD 305.2 million during 2025-2029 .

The Custom Antibody market is expected to grow at a CAGR of 9.3% during 2025-2029 .

Custom Antibody market is segmented by Type (Monoclonal antibodies, Polyclonal antibodies, Recombinant antibodies, Others) Source (Rabbit, Mice, Others) Application (Oncology, Infectious disease, Immunology, Neurology, Others)

Abcam plc, Abmart, Agilent Technologies Inc., Bio Rad Laboratories Inc., BioLegend Inc., Cell Signaling Technology Inc., Creative Diagnostics, GenScript Biotech Corp., Kaneka Eurogentec SA, Laboratory Corp., LifeSpan BioSciences Inc., Merck KGaA, ProMab Biotechnologies, Inc, Proteo Genix, RayBiotech Life Inc., Rockland Immunochemicals Inc., Thermo Fisher Scientific Inc., YenZym Antibodies, LLC are a few of the key vendors in the Custom Antibody market.

North America will register the highest growth rate of 36.2% among the other regions. Therefore, the Custom Antibody market in North America is expected to garner significant business opportunities for the vendors during the forecast period.

US, Canada, Mexico, Germany, UK, France, The Netherlands, Italy, Spain, Russia, China, Japan, India, South Korea, Indonesia, Thailand, Singapore, Australia, Brazil, South Africa, UAE, Saudi Arabia, Turkey

  • Increasing research and development investments in biopharmaceuticals and personalized medicine is the driving factor this market.

The Custom Antibody market vendors should focus on grabbing business opportunities from the Type segment as it accounted for the largest market share in the base year.