Data Center Precision Air Conditioning Market Size 2026-2030
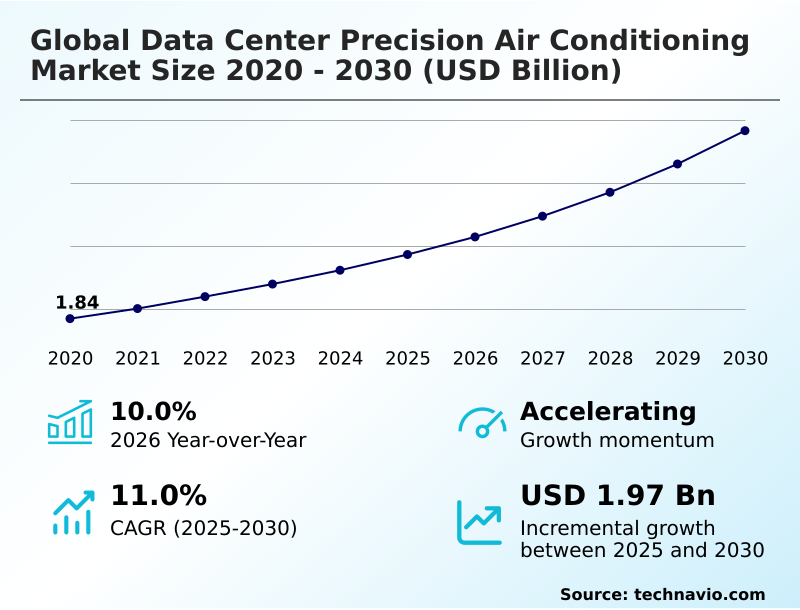
The data center precision air conditioning market size is valued to increase by USD 1.97 billion, at a CAGR of 11% from 2025 to 2030. Growing construction of data centers will drive the data center precision air conditioning market.
Major Market Trends & Insights
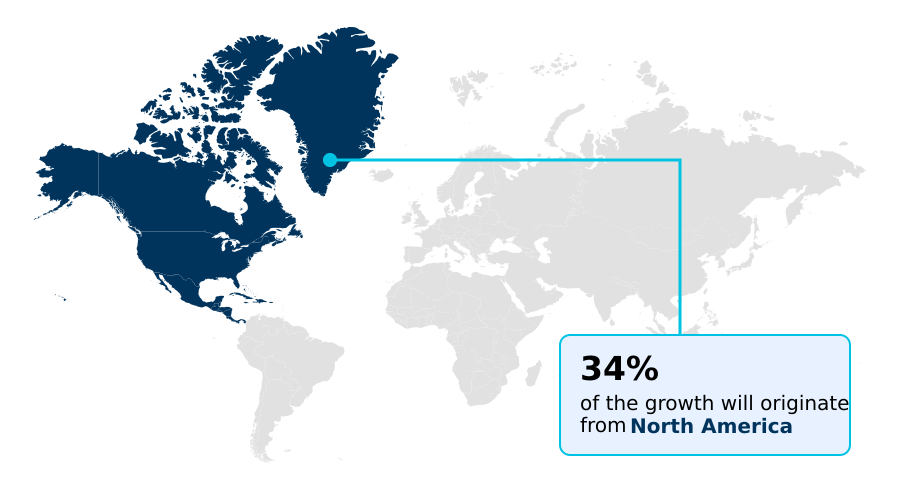
- North America dominated the market and accounted for a 34.5% growth during the forecast period.
- By Deployment - In-row cooling segment was valued at USD 1.34 billion in 2024
- By Product - CRAC units segment accounted for the largest market revenue share in 2024
Market Size & Forecast
- Market Opportunities: USD 2.99 billion
- Market Future Opportunities: USD 1.97 billion
- CAGR from 2025 to 2030 : 11%
Market Summary
- The Data Center Precision Air Conditioning Market is undergoing a structural transformation driven by the proliferation of high-density computing cooling and the escalating thermal demands of AI workloads. Effective thermal management systems are no longer optional but a fundamental requirement for ensuring data center uptime and cooling in mission-critical facility cooling environments.
- The industry is responding with next-generation cooling architectures, moving beyond traditional air-based methods to embrace more efficient options like direct-to-chip and immersion cooling systems. This shift is critical for managing the intense heat generated by modern processors while improving power usage effectiveness.
- A key trend is the move toward sustainable data center cooling, with operators adopting technologies that minimize energy and water consumption. For instance, a financial services firm planning a new facility must align its cooling strategy with data center design best practices, balancing the need for precision humidity control for its IT hardware with corporate sustainability goals.
- The expansion of hyperscale data center cooling and decentralized edge computing cooling further diversifies demand, creating a complex market where high initial costs and the need for specialized engineering expertise present significant adoption challenges for smaller operators.
What will be the Size of the Data Center Precision Air Conditioning Market during the forecast period?
Get Key Insights on Market Forecast (PDF) Get Free Sample
How is the Data Center Precision Air Conditioning Market Segmented?
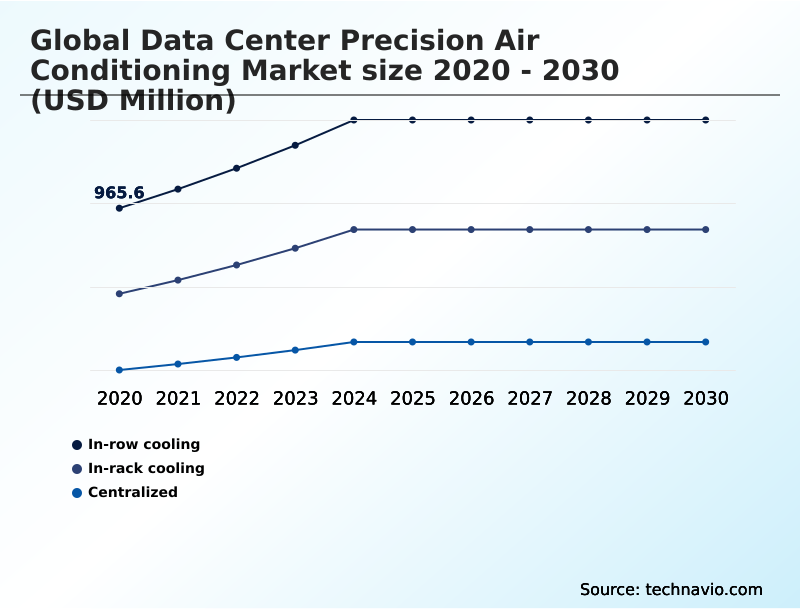
The data center precision air conditioning industry research report provides comprehensive data (region-wise segment analysis), with forecasts and estimates in "USD million" for the period 2026-2030, as well as historical data from 2020-2024 for the following segments.
- Deployment
- In-row cooling
- In-rack cooling
- Centralized
- Product
- CRAC units
- CRAH units
- Application
- Data centers
- Server rooms
- Telecommunication facilities
- Geography
- North America
- US
- Canada
- Mexico
- APAC
- China
- Japan
- India
- Europe
- Germany
- UK
- France
- Middle East and Africa
- Saudi Arabia
- UAE
- South Africa
- South America
- Brazil
- Argentina
- Rest of World (ROW)
- North America
By Deployment Insights
The in-row cooling segment is estimated to witness significant growth during the forecast period.
The in-row cooling systems segment is expanding as facilities shift from traditional room-level thermal management. This approach uses close-coupled cooling technology, placing units within server rows to improve data center thermal control and airflow management optimization.
This proximity is essential as cooling for AI workloads drives rack power density beyond historical norms, making it a critical aspect of high-efficiency data center hvac.
The strategy significantly reduces the distance for cold air, minimizing the mixing of hot and cold air streams. Its adoption in cooling for colocation facilities has shown a 25% reduction in managing thermal hotspots.
By enabling real-time adjustments, this modular data center cooling method ensures effective thermal overload prevention and supports reducing data center energy consumption through efficient, targeted cooling.
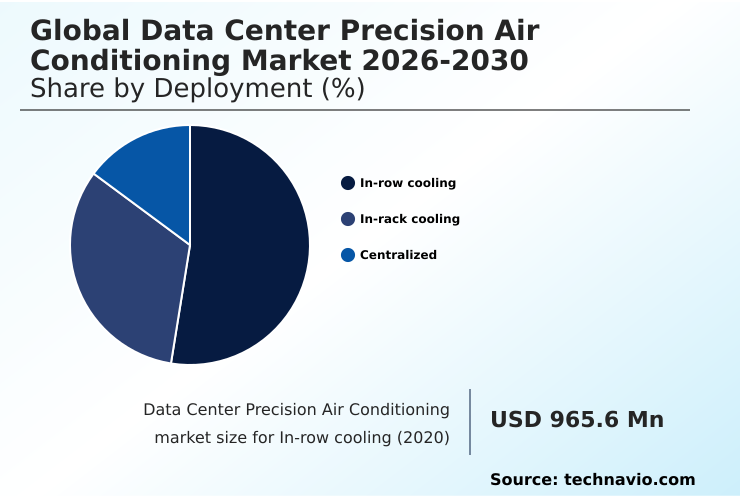
The In-row cooling segment was valued at USD 1.34 billion in 2024 and showed a gradual increase during the forecast period.
Regional Analysis
North America is estimated to contribute 34.5% to the growth of the global market during the forecast period.Technavio’s analysts have elaborately explained the regional trends and drivers that shape the market during the forecast period.
See How Data Center Precision Air Conditioning Market Demand is Rising in North America Get Free Sample
The geographic landscape is defined by regional climatic conditions and regulatory pressures influencing data center cooling infrastructure.
In North America, the focus is on reducing data center energy consumption through economizer-based cooling, while European markets are driven by stringent data center cooling regulations promoting low global warming potential refrigerants and waste heat reuse.
For instance, facilities in cooler climates have demonstrated up to 40% energy savings by maximizing free cooling. In contrast, hotter regions in the Middle East and APAC rely on high-capacity chilled water systems and innovative adiabatic pre-cooling.
The global rollout of cooling for 5G networks is also creating demand for specialized direct expansion refrigeration units in decentralized locations.
In high-performance computing clusters, the adoption of in-rack cooling solutions has improved thermal stability by over 20%, ensuring reliable operation for critical applications.
Market Dynamics
Our researchers analyzed the data with 2025 as the base year, along with the key drivers, trends, and challenges. A holistic analysis of drivers will help companies refine their marketing strategies to gain a competitive advantage.
- Strategic operational planning in the data center industry now requires a deep understanding of advanced cooling methodologies. A key debate revolves around in-row vs in-rack cooling efficiency, as operators evaluate the best approach for upgrading cooling for higher rack density.
- The cost of direct-to-chip liquid cooling and the ROI of immersion cooling systems are critical financial considerations, especially when designing hybrid cooling for AI data centers. Many are exploring power usage effectiveness improvement techniques and how to calculate data center cooling needs to optimize their infrastructure.
- For facilities looking to enhance sustainability, understanding the benefits of cold aisle containment and the impact of GWP refrigerants on cooling is essential. The move toward green data centers involves assessing different cooling strategies for green data centers, including the potential energy savings with variable speed compressors and how to reduce PUE with free cooling.
- For distributed infrastructure, cooling solutions for edge micro-sites and precision air conditioning for telecom shelters are paramount for ensuring uptime. This extends to thermal management for 5G infrastructure, where modular cooling for rapid deployment offers significant advantages. Operators must also address the challenges of centralized cooling systems and understand rear door heat exchanger benefits to make informed decisions.
- Proactive operational management includes using data center cooling predictive maintenance tools to prevent thermal overload in servers. An organization that implemented such tools for operational planning saw a 30% greater accuracy in predicting component failure compared to reactive maintenance schedules, directly impacting service level agreements and asset longevity.
What are the key market drivers leading to the rise in the adoption of Data Center Precision Air Conditioning Industry?
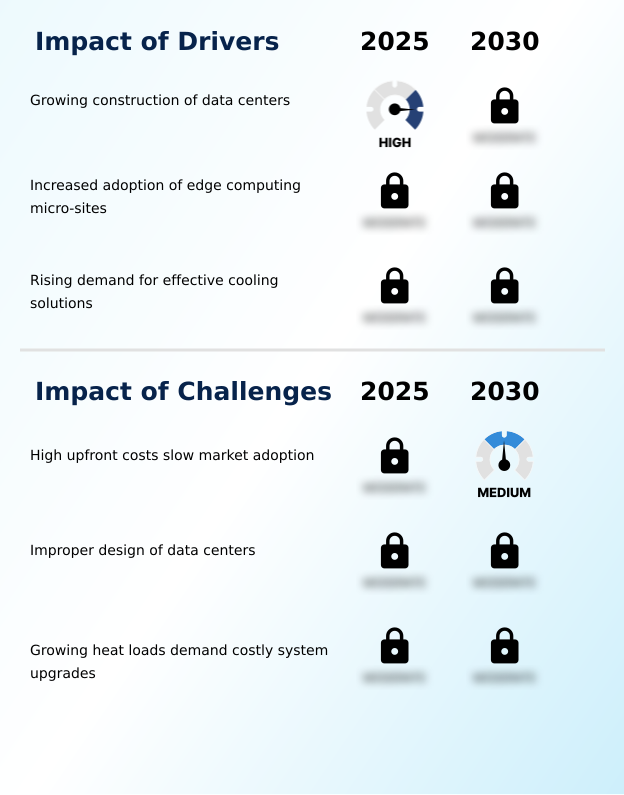
- The growing construction of data centers worldwide is a key driver for the market, fueling demand for advanced thermal management solutions.
- The demand for effective cooling solutions is primarily driven by the global construction of new facilities for hyperscale data center cooling and the expansion of edge computing cooling infrastructure.
- The rise of high-density computing cooling requirements, often exceeding 30kW per rack, makes advanced thermal management essential for data center uptime and cooling.
- This has accelerated the adoption of modular data center cooling and in-row cooling systems, which offer targeted airflow and improved efficiency, with some deployments reducing data center energy consumption by over 25%.
- Green data center construction is another major driver, pushing for solutions that support mission-critical facility cooling with minimal environmental impact. The rollout of cooling for 5G networks also fuels demand for compact, reliable systems.
- Proper implementation ensures thermal overload prevention, a factor that can improve equipment lifespan by 10%.
What are the market trends shaping the Data Center Precision Air Conditioning Industry?
- The growing adoption of liquid and hybrid cooling solutions is an emerging trend. This shift addresses the escalating thermal loads from high-density server configurations.
- A key trend is the shift toward next-generation cooling architectures, particularly hybrid cooling arrangements that combine traditional air-based methods with direct-to-chip liquid cooling. This approach is critical for cooling for AI workloads, where thermal loads are increasingly intense. The adoption of AI-driven thermal optimization is enhancing data center thermal control, with some operators reporting a 15% improvement in energy efficiency.
- Sustainable data center cooling is no longer a niche concern, as facilities implement energy-efficient cooling solutions to improve power usage effectiveness. For example, modern evaporative cooling solutions can reduce water usage by up to 20% compared to older systems. Effective cooling capacity planning is now essential for ensuring cooling system redundancy and accommodating future growth without major infrastructure overhauls.
What challenges does the Data Center Precision Air Conditioning Industry face during its growth?
- The high upfront investment required for specialized components and installation remains a significant challenge, slowing market adoption for some operators.
- High upfront costs and the complexity of modern systems present significant challenges. Many legacy facilities with a centralized cooling architecture rely on older computer room air conditioner units that are ill-equipped for modern heat loads, leading to issues with managing thermal hotspots.
- Undertaking data center cooling retrofits to install high-efficiency data center hvac solutions like rear door heat exchangers and coolant distribution units can be disruptive, with project timelines extending over six months. Improper facility layout, which deviates from data center design best practices, can undermine the effectiveness of even the most advanced systems, reducing potential efficiency gains by up to 20%.
- This necessitates careful airflow management optimization for effective thermal throttling prevention, a critical concern for cooling for colocation facilities that must guarantee performance to clients.
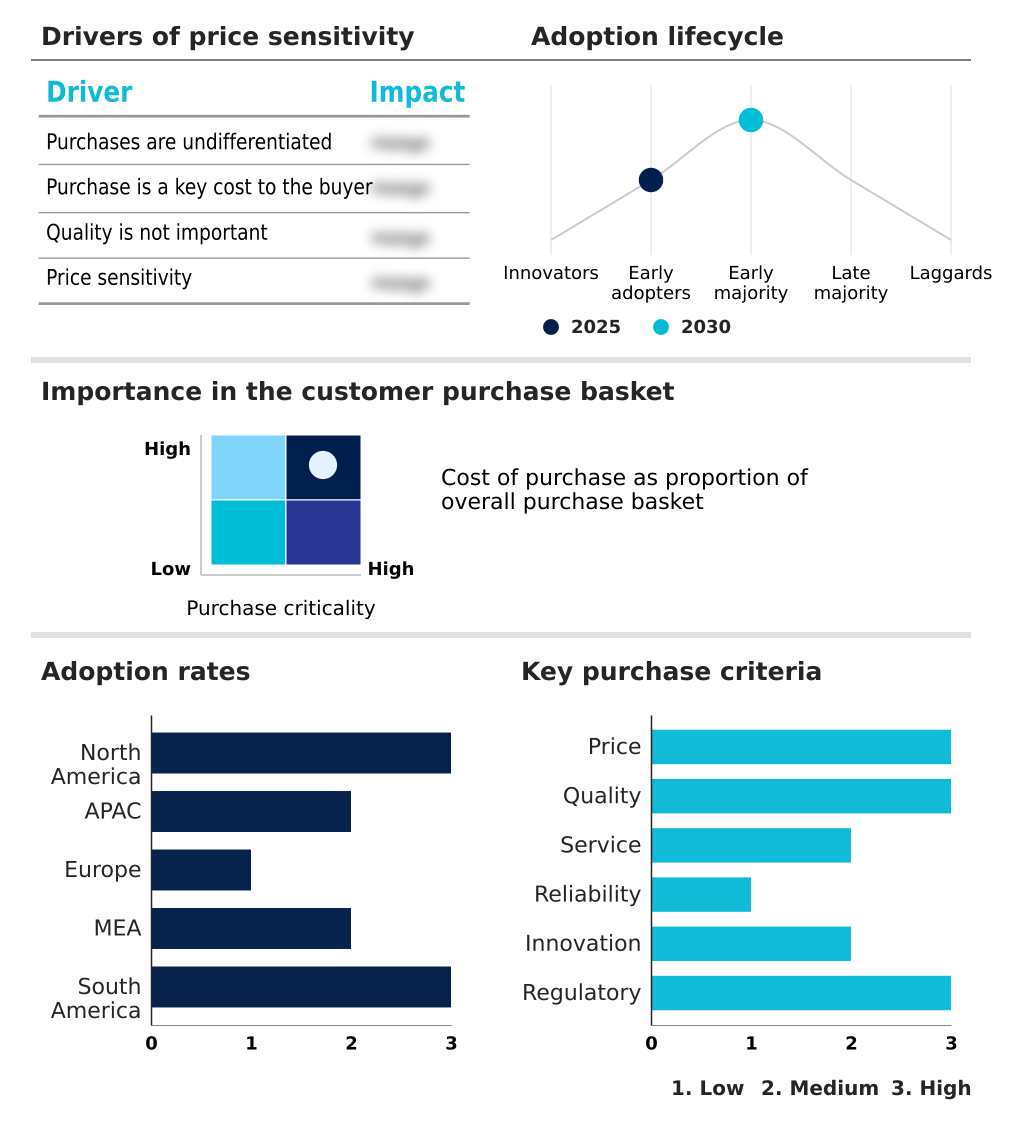
Exclusive Technavio Analysis on Customer Landscape
The data center precision air conditioning market forecasting report includes the adoption lifecycle of the market, covering from the innovator’s stage to the laggard’s stage. It focuses on adoption rates in different regions based on penetration. Furthermore, the data center precision air conditioning market report also includes key purchase criteria and drivers of price sensitivity to help companies evaluate and develop their market growth analysis strategies.
Customer Landscape of Data Center Precision Air Conditioning Industry
Competitive Landscape
Companies are implementing various strategies, such as strategic alliances, data center precision air conditioning market forecast, partnerships, mergers and acquisitions, geographical expansion, and product/service launches, to enhance their presence in the industry.
AAON Inc. - Specializing in custom air handlers and precision rooftop units, the firm provides engineered HVAC systems for mission-critical environmental control in high-performance computing facilities and data centers.
The industry research and growth report includes detailed analyses of the competitive landscape of the market and information about key companies, including:
- AAON Inc.
- Aermec S.p.A.
- Airedale Air Conditioning Ltd.
- CONTEG spol sro
- CSPM SDN BHD
- Daikin Industries Ltd.
- Delta Electronics Inc.
- Eaton Corp. Plc
- Emicon AC S.p.A.
- HiRef SpA
- Huawei Technologies Co. Ltd.
- Kaltra GmbH
- Kstar Group
- Lennox International Inc.
- Midea Group Co. Ltd.
- Mitsubishi Electric Corp.
- Rittal GmbH and Co. KG
- Schneider Electric SE
- STULZ GmbH
- Vertiv Holdings Co.
Qualitative and quantitative analysis of companies has been conducted to help clients understand the wider business environment as well as the strengths and weaknesses of key industry players. Data is qualitatively analyzed to categorize companies as pure play, category-focused, industry-focused, and diversified; it is quantitatively analyzed to categorize companies as dominant, leading, strong, tentative, and weak.
Recent Development and News in Data center precision air conditioning market
- In September 2024, Schneider Electric SE unveiled a comprehensive liquid cooling portfolio featuring coolant distribution units designed for exascale computing following its acquisition of a controlling interest in Motivair Corporation.
- In November 2024, Daikin Industries Ltd. launched its Pro-C computer room air handler range, featuring optimized chilled water heat exchangers and advanced controls to enhance reliability in hyperscale data centers.
- In March 2025, Ecolab introduced its 3D TRASAR technology for cooling water management, enabling real-time monitoring of fluid health and temperature to prevent unplanned downtime in critical infrastructure.
- In May 2025, Reliance Industries announced the Jamnagar Data Center project, incorporating modular cooling infrastructure to support localized data processing requirements, marking a significant domestic investment.
Dive into Technavio’s robust research methodology, blending expert interviews, extensive data synthesis, and validated models for unparalleled Data Center Precision Air Conditioning Market insights. See full methodology.
| Market Scope | |
|---|---|
| Page number | 298 |
| Base year | 2025 |
| Historic period | 2020-2024 |
| Forecast period | 2026-2030 |
| Growth momentum & CAGR | Accelerate at a CAGR of 11% |
| Market growth 2026-2030 | USD 1968.7 million |
| Market structure | Fragmented |
| YoY growth 2025-2026(%) | 10.0% |
| Key countries | US, Canada, Mexico, China, Japan, India, South Korea, Australia, Indonesia, Germany, UK, France, Italy, Spain, The Netherlands, Saudi Arabia, UAE, South Africa, Israel, Turkey, Brazil, Argentina and Chile |
| Competitive landscape | Leading Companies, Market Positioning of Companies, Competitive Strategies, and Industry Risks |
Research Analyst Overview
- The evolution of data center thermal management systems is rapid, moving beyond the standard computer room air conditioner (CRAC) and computer room air handler (CRAH) in a centralized cooling architecture. The need for high-density computing cooling is pushing adoption of in-row cooling systems and in-rack cooling solutions, which employ close-coupled cooling technology to manage intense rack power density.
- For boardroom budgeting, the shift to liquid cooling is a critical decision, with options like direct-to-chip liquid cooling, full immersion cooling systems, and supplementary rear door heat exchangers, often managed by coolant distribution units (CDUs). Such hybrid cooling arrangements have demonstrated a reduction in cooling energy costs by over 25%.
- Improving power usage effectiveness (PUE) remains a core goal, achieved through disciplined airflow management optimization using hot aisle containment and cold aisle containment, alongside variable speed compressors and electronically commutated fans. Sustainability is addressed with free cooling technologies, economizer-based cooling, and innovations like adiabatic pre-cooling and waste heat recovery.
- Modern systems ensure precision humidity control and thermal overload prevention via environmental monitoring sensors and cooling system redundancy. This applies to modular data center cooling for edge computing cooling and large-scale hyperscale data center cooling, emphasizing low global warming potential (GWP) refrigerants, efficient refrigerant distribution manifold designs, and AI-driven thermal optimization with evaporative cooling solutions.
What are the Key Data Covered in this Data Center Precision Air Conditioning Market Research and Growth Report?
-
What is the expected growth of the Data Center Precision Air Conditioning Market between 2026 and 2030?
-
USD 1.97 billion, at a CAGR of 11%
-
-
What segmentation does the market report cover?
-
The report is segmented by Deployment (In-row cooling, In-rack cooling, and Centralized), Product (CRAC units, and CRAH units), Application (Data centers, Server rooms, and Telecommunication facilities) and Geography (North America, APAC, Europe, Middle East and Africa, South America)
-
-
Which regions are analyzed in the report?
-
North America, APAC, Europe, Middle East and Africa and South America
-
-
What are the key growth drivers and market challenges?
-
Growing construction of data centers, High upfront costs slow market adoption
-
-
Who are the major players in the Data Center Precision Air Conditioning Market?
-
AAON Inc., Aermec S.p.A., Airedale Air Conditioning Ltd., CONTEG spol sro, CSPM SDN BHD, Daikin Industries Ltd., Delta Electronics Inc., Eaton Corp. Plc, Emicon AC S.p.A., HiRef SpA, Huawei Technologies Co. Ltd., Kaltra GmbH, Kstar Group, Lennox International Inc., Midea Group Co. Ltd., Mitsubishi Electric Corp., Rittal GmbH and Co. KG, Schneider Electric SE, STULZ GmbH and Vertiv Holdings Co.
-
Market Research Insights
- Market dynamics are increasingly shaped by the need for specialized thermal solutions across diverse applications. The rise of green data center construction is driving operators to adopt energy-efficient technologies, with some facilities achieving a 15% reduction in energy consumption through advanced system integration.
- For example, cooling for containerized data centers requires compact, high-performance units that ensure operational continuity in remote locations. Similarly, telecom facility thermal management focuses on reliability, where new systems have reduced equipment failure rates by up to 20%.
- Many organizations are undertaking data center cooling retrofits to upgrade legacy infrastructure, which often involves complex cooling capacity planning to accommodate future growth. These projects can improve overall system efficiency by more than 30% compared to older, less precise cooling methods, highlighting a clear return on investment for modernizing critical infrastructure.
We can help! Our analysts can customize this data center precision air conditioning market research report to meet your requirements.
 RIA -
RIA - 
