Data Mesh Enablement Services Market Analysis, Size, and Forecast 2026-2030: North America (US, Canada, and Mexico), Europe (Germany, UK, and France), APAC (China, India, and Japan), Middle East and Africa (Saudi Arabia, UAE, and South Africa), South America (Brazil, Argentina, and Colombia), and Rest of World (ROW)

Data Mesh Enablement Services Market Analysis, Size, and Forecast 2026-2030:
North America (US, Canada, and Mexico), Europe (Germany, UK, and France), APAC (China, India, and Japan), Middle East and Africa (Saudi Arabia, UAE, and South Africa), South America (Brazil, Argentina, and Colombia), and Rest of World (ROW)

Published: May 2026 301 Pages SKU: IRTNTR81284

Market Overview at a Glance

$1.60 B
Market Opportunity
17.6%
CAGR 2025 - 2030
42.1%
North America Growth
$689.6 Mn
Cloud based segment 2024

Data Mesh Enablement Services Market Size and Growth Forecast 2026-2030

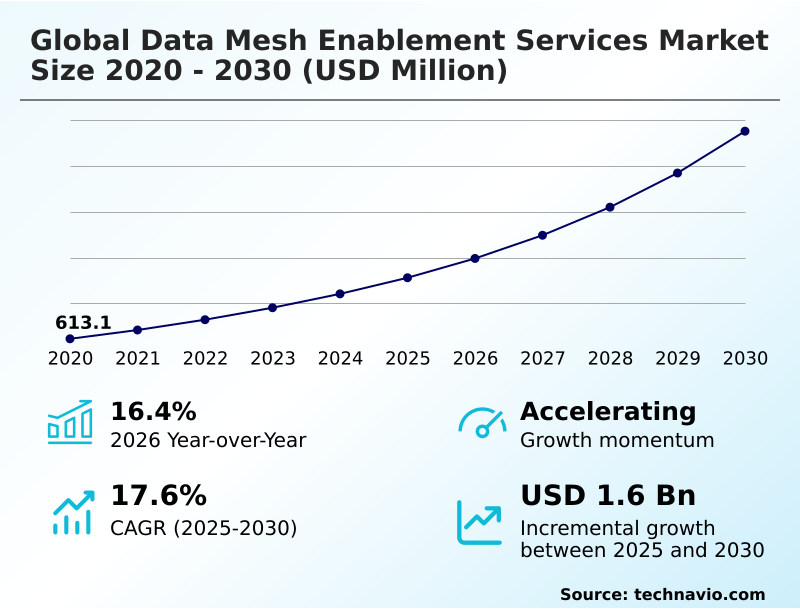
The Data Mesh Enablement Services Market size was valued at USD 1.28 billion in 2025 growing at a CAGR of 17.6% during the forecast period 2026-2030.

North America accounts for 42.1% of incremental growth during the forecast period. The Cloud based segment by Deployment was valued at USD 689.6 million in 2024, while the Large enterprises segment holds the largest revenue share by Business Segment.

The market is projected to grow by USD 2.26 billion from 2020 to 2030, with USD 1.60 billion of the growth expected during the forecast period of 2025 to 2030.

Get Key Insights on Market Forecast (PDF) Request Free Sample

Data Mesh Enablement Services Market Overview

The data mesh enablement services market is expanding as organizations abandon monolithic data lakes for decentralized data architectures that foster agility. This sociotechnical shift, emphasizing domain-oriented data ownership and treating data as a product, is essential for competing in a digital-first economy. The market's 16.4% year-over-year growth is fueled by the need to derive value from complex information landscapes. For instance, a multinational manufacturing firm implementing a data mesh framework for its Industrial IoT network can empower individual plant domains to manage sensor data as distinct data products. This approach of applying federated computational governance allows for localized predictive maintenance models, improving equipment uptime, while still enabling centralized analytics for global supply chain optimization. This move to a self-serve data infrastructure, governed by clear data contracts, is becoming a strategic imperative, with North America contributing over 42% of the market's incremental growth, indicating strong adoption in mature digital economies.

Drivers, Trends, and Challenges in the Data Mesh Enablement Services Market

The strategic decision to adopt a decentralized data architecture involves a complex analysis of the cost of data mesh vs data warehouse, factoring in both technology and organizational transformation. For large enterprises, the primary question is how to build a self-serve data platform that empowers business domains without creating anarchy.

The answer often lies in establishing clear data contracts, which are foundational to treating data as a product. In practice, a global financial services firm might leverage these principles for scaling data mesh for large enterprises by creating a data product marketplace for its risk, compliance, and trading domains.

This structure, which typically takes months to establish, can reduce the time for new regulatory report generation from weeks to days, a significant improvement over legacy systems.

A key part of this transformation is implementing federated governance in data mesh, which uses automated policy-as-code to enforce rules like GDPR's right to be forgotten across all data products, regardless of their location.

The role of data contracts in data mesh is to formally define the schema, quality metrics, and service-level objectives for each data product, ensuring trust and interoperability across the decentralized network and reducing downstream integration failures by over 50% in some implementations.

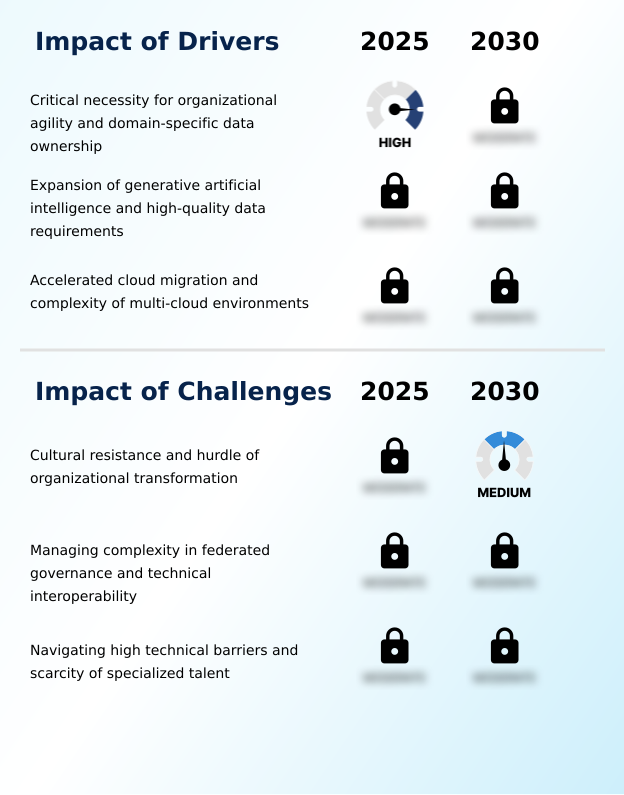
Primary Growth Driver: The critical necessity for organizational agility and domain-specific data ownership is a primary driver for the data mesh enablement services market.

The primary driver for market expansion, reflected in its 17.6% CAGR, is the organizational imperative to dismantle data silos and accelerate decision-making. Traditional data lakes have become bottlenecks, unable to support the agility required for modern digital business.

The rise of decentralized analytics and the need for a coherent data mesh architecture stem from this core challenge. Organizations are pursuing domain-driven design to place data ownership with the teams who understand its context, improving data quality and relevance.

Furthermore, the complexity of modern IT environments, characterized by a mix of on-premises, hybrid, and multi-cloud systems, makes data virtualization and a cohesive data mesh strategy essential for creating a unified view of enterprise information without costly data movement.

Emerging Market Trend: The synthesis of data mesh architecture with generative AI is a defining market trend. This convergence underscores the critical need for high-quality, domain-specific data to fuel advanced model training and deployment.

Market trends are defined by the synthesis of data mesh architecture with generative AI and the push toward automated federated governance. The demand for high-quality, reliable datasets for data mesh for AI applications is compelling organizations to adopt domain-driven design, ensuring information is curated by experts.

This move necessitates robust interoperability standards and comprehensive data catalogs so that AI models can seamlessly consume decentralized data products. Concurrently, the complexity of managing a distributed ecosystem is driving innovation in policy as code. This allows governance rules to be embedded directly into the self-serve data infrastructure, automating compliance checks and enforcing data contracts programmatically.

This ensures that as the data mesh scales, data lineage and security are maintained without creating manual bottlenecks, transforming data governance from a reactive function to a proactive, automated capability.

Key Industry Challenge: Cultural resistance to change and the inherent hurdles of large-scale organizational transformation present a key challenge to market growth.

The most significant market challenge is not technical but cultural. The transition to a data mesh organizational structure requires a profound shift in mindset, from centralized control to distributed responsibility. This often meets resistance, as it necessitates creating new roles, such as the data product owner role, and requires business domains to take on accountability for data quality.

A data mesh readiness assessment frequently reveals a critical skills gap; indeed, over 60% of enterprises cite the inability to hire qualified data architects as a primary reason for delaying transformation.

Moreover, implementing true federated computational governance is complex, demanding a delicate balance between domain autonomy and central oversight, which many organizations struggle to achieve without expert data mesh consulting and a clear data mesh strategy.

Explore Full Market Dynamics Analysis Request Free Sample

Data Mesh Enablement Services Market Segmentation

The data mesh enablement services industry research report provides comprehensive data including region-wise segment analysis, with forecasts and analysis for the period 2026-2030, as well as historical data from 2020-2024 for the following segments.

Market Segment by Deployment
  • Cloud based
  • On premises
Market Segment by Business segment
  • Large enterprises
  • Small and medium enterprises
Market Segment by End-user
  • BFSI
  • Healthcare
  • IT and telecom
  • Retail and e-commerce
  • Others
Market Segment by Geography
North America
US, Canada, Mexico
Europe
Germany, UK, France, Italy, Spain, The Netherlands
APAC
China, India, Japan, South Korea, Australia, Indonesia
Middle East and Africa
Saudi Arabia, UAE, South Africa, Israel, Turkey
South America
Brazil, Argentina, Colombia

Deployment Segment Analysis

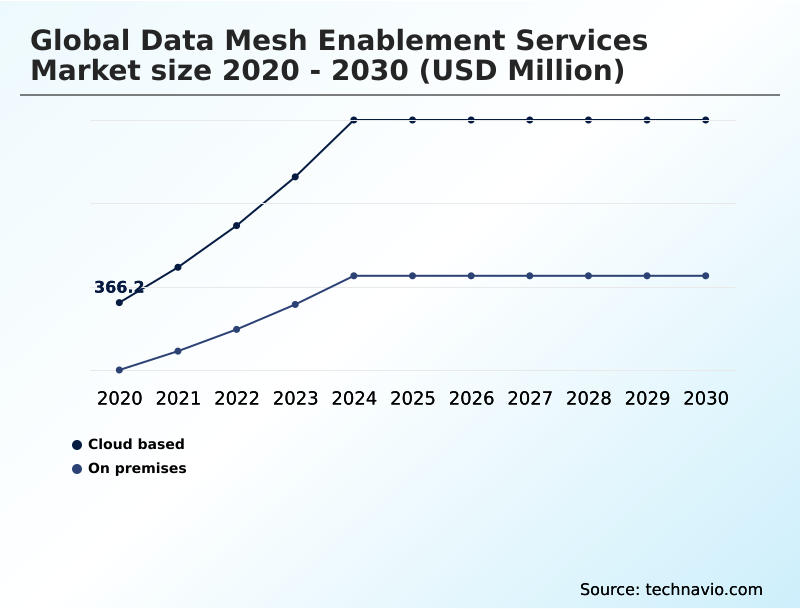
The cloud based segment is estimated to witness significant growth during the forecast period.

The cloud-based segment is pivotal for the data mesh enablement services market, leveraging cloud-native data architecture to deliver the scalability and elasticity essential for managing vast, distributed information assets.

This deployment model facilitates the rapid provisioning of a self-serve data infrastructure, empowering domain teams to build, deploy, and share data products without traditional IT bottlenecks.

Enablement services for cloud environments focus on automating federated computational governance, ensuring that security policies and metadata standards are applied consistently across all data products.

With organizations increasingly adopting multi-cloud data management strategies, the ability to maintain interoperability standards for hybrid cloud data is critical.

The segment's dominance reflects the enterprise shift toward flexible, consumption-based models that support a robust decentralized data architecture and drive operational agility.

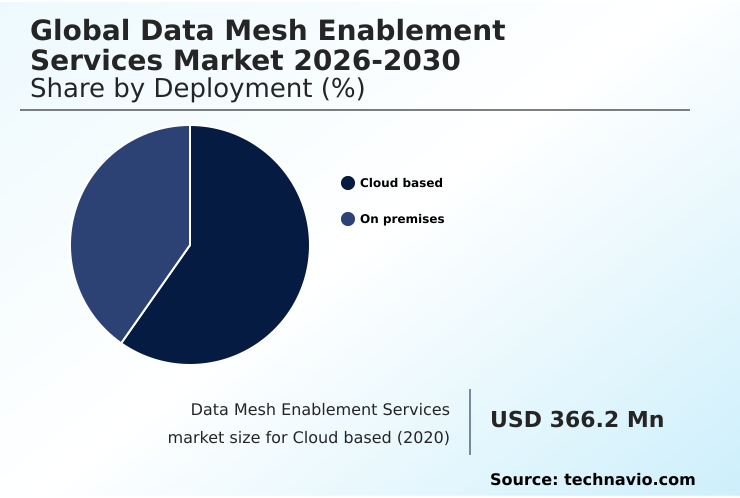
The Cloud based segment was valued at USD 689.6 million in 2024 and showed a gradual increase during the forecast period.

Data Mesh Enablement Services Market by Region: North America Leads with 42.1% Growth Share

North America is estimated to contribute 42.1% to the growth of the global market during the forecast period.

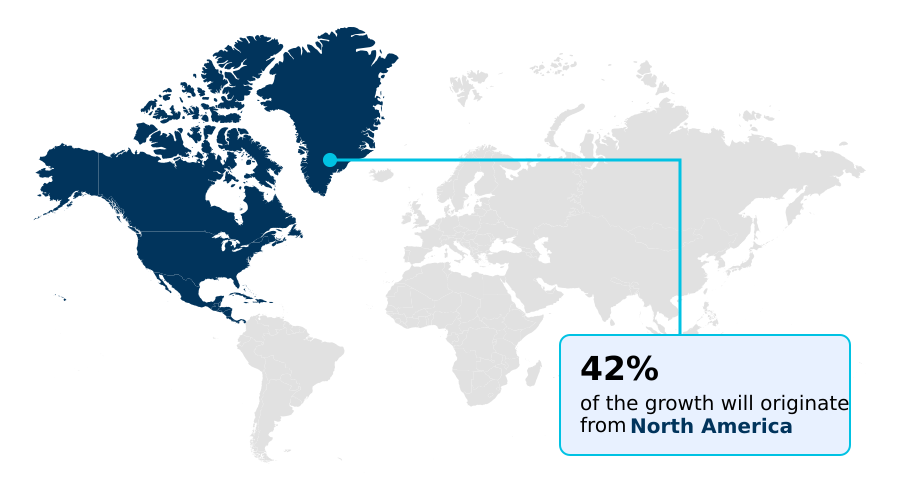
The geographic landscape of the market is led by North America, which accounts for over 42% of the market's incremental growth, driven by early adoption of cloud-native technologies and a mature data mesh consulting ecosystem.

In contrast, the APAC region is projected to be the fastest-growing market, with a CAGR of 18.5%, fueled by massive digital transformation in countries like India and China.

European adoption is heavily influenced by regulatory pressures, with a focus on implementing federated computational governance to comply with GDPR and ensure data sovereignty. This has spurred demand for data mesh implementation that supports complex multi-cloud data management across borders.

The need for localized expertise to navigate regional data residency laws and business cultures underscores the global demand for specialized professional services that can adapt the core principles of data mesh architecture to diverse operating environments.

Customer Landscape Analysis for the Data Mesh Enablement Services Market

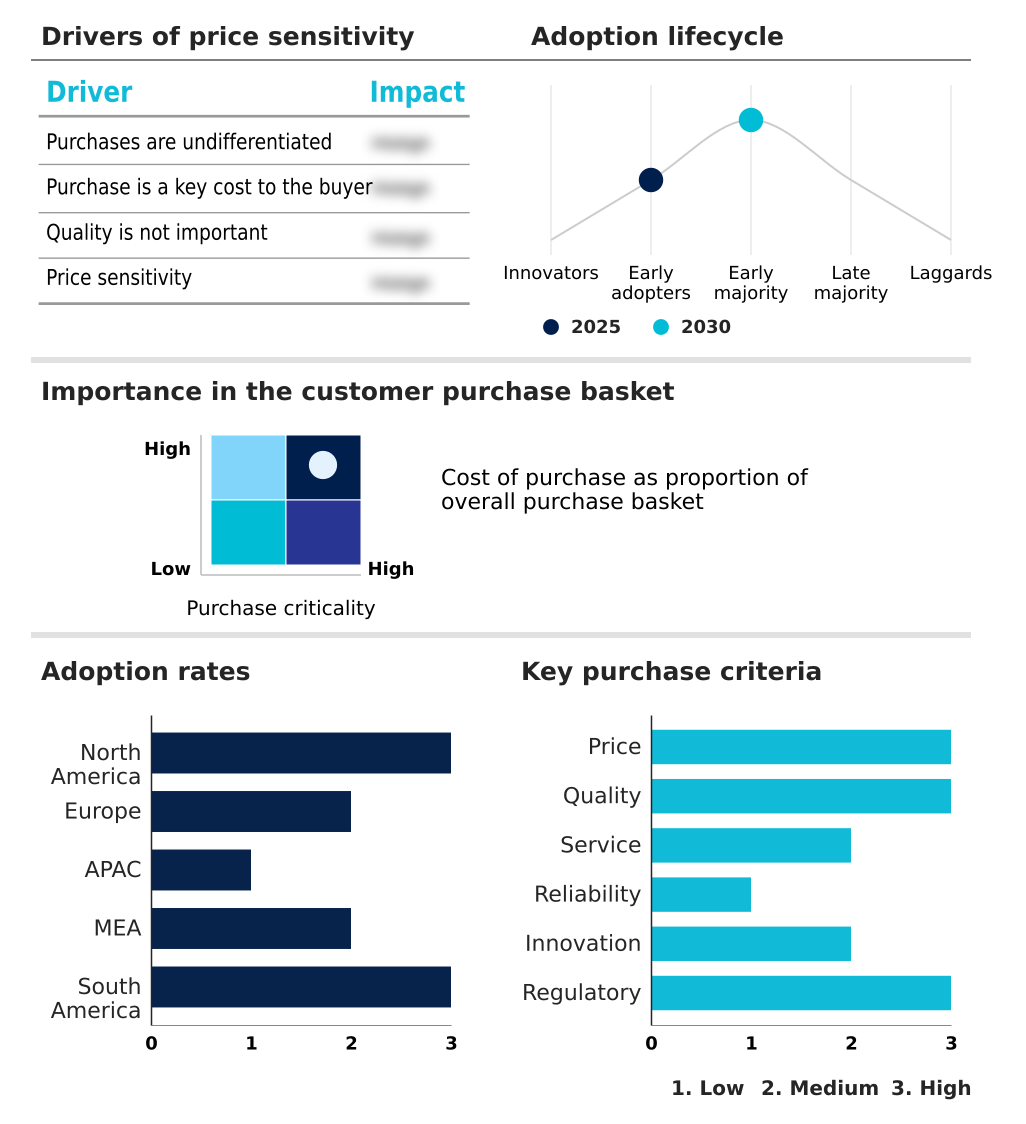
The data mesh enablement services market forecasting report includes the adoption lifecycle of the market, covering from the innovator’s stage to the laggard’s stage. It focuses on adoption rates in different regions based on penetration. Furthermore, the data mesh enablement services market report also includes key purchase criteria and drivers of price sensitivity to help companies evaluate and develop their market growth analysis strategies.

Competitive Landscape of the Data Mesh Enablement Services Market

Companies are implementing various strategies, such as strategic alliances, partnerships, mergers and acquisitions, geographical expansion, and product/service launches, to enhance their presence in the data mesh enablement services market industry.

Accenture Plc - Specialized services transition organizations to decentralized, domain-oriented data architectures, integrating governance and self-serve platforms to unlock the value of data as a product.

The industry research and growth report includes detailed analyses of the competitive landscape of the market and information about key companies, including:

  • Accenture Plc
  • Bain and Co. Inc.
  • Boston Consulting Group Inc.
  • Capgemini SE
  • Cognizant Technology Solution
  • Deloitte Touche Tohmatsu Ltd.
  • DXC Technology Co.
  • Ernst and Young Global Ltd.
  • Genpact Ltd.
  • HCL Technologies Ltd.
  • IBM Corp.
  • Infosys Ltd.
  • KPMG International Ltd.
  • Kyndryl Inc.
  • LTIMindtree Ltd.
  • NTT DATA Corp.
  • PricewaterhouseCoopers LLP
  • Publicis Sapient
  • Slalom Consulting LLC
  • Tata Consultancy Services
  • Thoughtworks Holding Inc

Qualitative and quantitative analysis of companies has been conducted to help clients understand the wider business environment as well as the strengths and weaknesses of key industry players. Data is qualitatively analyzed to categorize companies as pure play, category-focused, industry-focused, and diversified; it is quantitatively analyzed to categorize companies as dominant, leading, strong, tentative, and weak.

Recent Developments in the Data Mesh Enablement Services Market

  • In May 2025, Google Cloud launched the Data Product Hub, a specialized interface designed to help large organizations catalog and share domain-managed data products specifically for use in generative AI applications.
  • In April 2025, Nextdata OS was launched by the original founder of the data mesh concept to provide a platform that packages data products into software-like containers for improved portability and consistency across diverse hybrid computing environments.
  • In March 2025, a global consortium of retail organizations convened at the Digital Transformation Summit to address the primary causes of project stagnation in decentralized data initiatives, concluding that a lack of clear incentivization for domain teams remained the single largest barrier.
  • In February 2025, a major global investment bank headquartered in New York announced the full-scale deployment of a domain-oriented data architecture across its global wealth management division to accelerate the delivery of personalized investment insights.

Research Analyst Overview: Data Mesh Enablement Services Market

The data mesh enablement services market is evolving from a niche architectural concept to a mainstream strategy for enterprise data management. This shift is driven by the mandate to treat data as a product, a principle that requires a fundamental rethinking of data ownership and governance.

For boardroom decision-makers, this translates into a direct impact on departmental budgets and cross-functional operating models, as investment shifts from a central IT function to domain-specific teams responsible for the entire data product lifecycle.

A key trend involves leveraging a semantic data model to ensure that decentralized data products are not only discoverable via a data catalog but are also understandable and interoperable across the business. This is crucial for enabling real-time data processing and analytics.

The market's 17.6% CAGR reflects the urgency for solutions that can handle the complexity of hybrid cloud data and multi-cloud data management while maintaining strict data sovereignty and enforcing data quality metrics in accordance with standards like ISO 8000.

Dive into Technavio’s robust research methodology, blending expert interviews, extensive data synthesis, and validated models for unparalleled Data Mesh Enablement Services Market insights. See full methodology.

Request Free Sample

Market Scope
Page number 301
Base year 2025
Historic period 2020-2024
Forecast period 2026-2030
Growth momentum & CAGR Accelerate at a CAGR of 17.6%
Market growth 2026-2030 USD 1598.7 million
Market structure Fragmented
YoY growth 2025-2026(%) 16.4%
Key countries US, Canada, Mexico, Germany, UK, France, Italy, Spain, The Netherlands, China, India, Japan, South Korea, Australia, Indonesia, Saudi Arabia, UAE, South Africa, Israel, Turkey, Brazil, Argentina and Colombia
Competitive landscape Leading Companies, Market Positioning of Companies, Competitive Strategies, and Industry Risks

Data Mesh Enablement Services Market: Key Questions Answered in This Report

  • What is the expected growth of the Data Mesh Enablement Services Market between 2026 and 2030?

    • The Data Mesh Enablement Services Market is expected to grow by USD 1.60 billion during 2026-2030, registering a CAGR of 17.6%. Year-over-year growth in 2026 is estimated at 16.4%%. This acceleration is shaped by critical necessity for organizational agility and domain-specific data ownership, which is intensifying demand across multiple end-use verticals covered in the report.

  • What segmentation does the market report cover?

    • The report is segmented by Deployment (Cloud based, and On premises), Business Segment (Large enterprises, and Small and medium enterprises), End-user (BFSI, Healthcare, IT and telecom, Retail and e-commerce, and Others) and Geography (North America, Europe, APAC, Middle East and Africa, South America). Among these, the Cloud based segment is estimated to witness significant growth during the forecast period, driven by rising adoption across key application areas. Each segment includes detailed qualitative and quantitative analysis, along with historical data from 2020-2024 and forecasts through 2030 with year-over-year growth rates.

  • Which regions are analyzed in the report?

    • The report covers North America, Europe, APAC, Middle East and Africa and South America. North America is estimated to contribute 42.1% to market growth during the forecast period. Country-level analysis includes US, Canada, Mexico, Germany, UK, France, Italy, Spain, The Netherlands, China, India, Japan, South Korea, Australia, Indonesia, Saudi Arabia, UAE, South Africa, Israel, Turkey, Brazil, Argentina and Colombia, with dedicated market size tables and year-over-year growth for each.

  • What are the key growth drivers and market challenges?

    • The primary driver is critical necessity for organizational agility and domain-specific data ownership, which is accelerating investment and industry demand. The main challenge is cultural resistance and hurdle of organizational transformation, creating operational barriers for key market participants. The report quantifies the impact of each driver and challenge across 2026 and 2030 with comparative analysis.

  • Who are the major players in the Data Mesh Enablement Services Market?

    • Key vendors include Accenture Plc, Bain and Co. Inc., Boston Consulting Group Inc., Capgemini SE, Cognizant Technology Solution, Deloitte Touche Tohmatsu Ltd., DXC Technology Co., Ernst and Young Global Ltd., Genpact Ltd., HCL Technologies Ltd., IBM Corp., Infosys Ltd., KPMG International Ltd., Kyndryl Inc., LTIMindtree Ltd., NTT DATA Corp., PricewaterhouseCoopers LLP, Publicis Sapient, Slalom Consulting LLC, Tata Consultancy Services and Thoughtworks Holding Inc. The report provides qualitative and quantitative analysis categorizing companies as dominant, leading, strong, tentative, and weak based on their market positioning. Company profiles include business segment analysis, SWOT assessment, key offerings, and recent strategic developments.

Data Mesh Enablement Services Market Research Insights

Market dynamics are increasingly shaped by the enterprise need for a cohesive data mesh strategy that balances domain autonomy with centralized control. Large enterprises, representing the majority of the market, are pursuing data democratization to unlock innovation, while small and medium enterprises adopt leaner data mesh frameworks to compete.

A primary focus is on robust data mesh governance, ensuring compliance with regulations like the General Data Protection Regulation (GDPR) without stifling the agility gained from decentralized analytics. Successful data mesh use cases demonstrate that treating information as a high-quality, reliable asset is fundamental.

This requires a shift in enterprise data management philosophy, moving beyond technology to address the data mesh organizational structure and cultivate new roles like the data product owner role, turning architectural theory into operational reality.

We can help! Our analysts can customize this data mesh enablement services market research report to meet your requirements.

Get in touch

1. Executive Summary

1.1 Market overview

Executive Summary - Chart on Market Overview
Executive Summary - Data Table on Market Overview
Executive Summary - Chart on Global Market Characteristics
Executive Summary - Chart on Market by Geography
Executive Summary - Chart on Market Segmentation by Deployment
Executive Summary - Chart on Market Segmentation by Business Segment
Executive Summary - Chart on Market Segmentation by End-user
Executive Summary - Chart on Incremental Growth
Executive Summary - Data Table on Incremental Growth
Executive Summary - Chart on Company Market Positioning

2. Technavio Analysis

2.1 Analysis of price sensitivity, lifecycle, customer purchase basket, adoption rates, and purchase criteria

2.2 Criticality of inputs and Factors of differentiation

Chart on Overview on criticality of inputs and factors of differentiation

2.3 Factors of disruption

Chart on Overview on factors of disruption

2.4 Impact of drivers and challenges

Chart on Impact of drivers and challenges in 2025 and 2030

3. Market Landscape

3.1 Market ecosystem

Chart on Parent Market
Data Table on - Parent Market

3.2 Market characteristics

Chart on Market characteristics analysis

3.3 Value chain analysis

Chart on Value chain analysis

4. Market Sizing

4.1 Market definition

Data Table on Offerings of companies included in the market definition

4.2 Market segment analysis

Market segments

4.3 Market size 2025

4.4 Market outlook: Forecast for 2025-2030

Chart on Global - Market size and forecast 2025-2030 ($ million)
Data Table on Global - Market size and forecast 2025-2030 ($ million)
Chart on Global Market: Year-over-year growth 2025-2030 (%)
Data Table on Global Market: Year-over-year growth 2025-2030 (%)

5. Historic Market Size

5.1 Global Data Mesh Enablement Services Market 2020 - 2024

Historic Market Size - Data Table on Global Data Mesh Enablement Services Market 2020 - 2024 ($ million)

5.2 Deployment segment analysis 2020 - 2024

Historic Market Size - Deployment Segment 2020 - 2024 ($ million)

5.3 Business segment analysis 2020 - 2024

Historic Market Size - Business Segment 2020 - 2024 ($ million)

5.4 End-user segment analysis 2020 - 2024

Historic Market Size - End-user Segment 2020 - 2024 ($ million)

5.5 Geography segment analysis 2020 - 2024

Historic Market Size - Geography Segment 2020 - 2024 ($ million)

5.6 Country segment analysis 2020 - 2024

Historic Market Size - Country Segment 2020 - 2024 ($ million)

6. Qualitative Analysis

6.1 The AI impact on Global Data Mesh Enablement Services Market

7. Five Forces Analysis

7.1 Five forces summary

Five forces analysis - Comparison between 2025 and 2030

7.2 Bargaining power of buyers

Bargaining power of buyers - Impact of key factors 2025 and 2030

7.3 Bargaining power of suppliers

Bargaining power of suppliers - Impact of key factors in 2025 and 2030

7.4 Threat of new entrants

Threat of new entrants - Impact of key factors in 2025 and 2030

7.5 Threat of substitutes

Threat of substitutes - Impact of key factors in 2025 and 2030

7.6 Threat of rivalry

Threat of rivalry - Impact of key factors in 2025 and 2030

7.7 Market condition

Chart on Market condition - Five forces 2025 and 2030

8. Market Segmentation by Deployment

8.1 Market segments

Chart on Deployment - Market share 2025-2030 (%)
Data Table on Deployment - Market share 2025-2030 (%)

8.2 Comparison by Deployment

Chart on Comparison by Deployment
Data Table on Comparison by Deployment

8.3 Cloud based - Market size and forecast 2025-2030

Chart on Cloud based - Market size and forecast 2025-2030 ($ million)
Data Table on Cloud based - Market size and forecast 2025-2030 ($ million)
Chart on Cloud based - Year-over-year growth 2025-2030 (%)
Data Table on Cloud based - Year-over-year growth 2025-2030 (%)

8.4 On premises - Market size and forecast 2025-2030

Chart on On premises - Market size and forecast 2025-2030 ($ million)
Data Table on On premises - Market size and forecast 2025-2030 ($ million)
Chart on On premises - Year-over-year growth 2025-2030 (%)
Data Table on On premises - Year-over-year growth 2025-2030 (%)

8.5 Market opportunity by Deployment

Market opportunity by Deployment ($ million)
Data Table on Market opportunity by Deployment ($ million)

9. Market Segmentation by Business Segment

9.1 Market segments

Chart on Market Segmentation by Business Segment - Market share 2025-2030 (%)
Data Table on Market Segmentation by Business Segment - Market share 2025-2030 (%)

9.2 Comparison by Market Segmentation by Business Segment

Chart on Comparison by Market Segmentation by Business Segment
Data Table on Comparison by Market Segmentation by Business Segment

9.3 Large enterprises - Market size and forecast 2025-2030

Chart on Large enterprises - Market size and forecast 2025-2030 ($ million)
Data Table on Large enterprises - Market size and forecast 2025-2030 ($ million)
Chart on Large enterprises - Year-over-year growth 2025-2030 (%)
Data Table on Large enterprises - Year-over-year growth 2025-2030 (%)

9.4 Small and medium enterprises - Market size and forecast 2025-2030

Chart on Small and medium enterprises - Market size and forecast 2025-2030 ($ million)
Data Table on Small and medium enterprises - Market size and forecast 2025-2030 ($ million)
Chart on Small and medium enterprises - Year-over-year growth 2025-2030 (%)
Data Table on Small and medium enterprises - Year-over-year growth 2025-2030 (%)

9.5 Market opportunity by Market Segmentation by Business Segment

Market opportunity by Market Segmentation by Business Segment ($ million)
Data Table on Market opportunity by Market Segmentation by Business Segment ($ million)

10. Market Segmentation by End-user

10.1 Market segments

Chart on End-user - Market share 2025-2030 (%)
Data Table on End-user - Market share 2025-2030 (%)

10.2 Comparison by End-user

Chart on Comparison by End-user
Data Table on Comparison by End-user

10.3 BFSI - Market size and forecast 2025-2030

Chart on BFSI - Market size and forecast 2025-2030 ($ million)
Data Table on BFSI - Market size and forecast 2025-2030 ($ million)
Chart on BFSI - Year-over-year growth 2025-2030 (%)
Data Table on BFSI - Year-over-year growth 2025-2030 (%)

10.4 Healthcare - Market size and forecast 2025-2030

Chart on Healthcare - Market size and forecast 2025-2030 ($ million)
Data Table on Healthcare - Market size and forecast 2025-2030 ($ million)
Chart on Healthcare - Year-over-year growth 2025-2030 (%)
Data Table on Healthcare - Year-over-year growth 2025-2030 (%)

10.5 IT and telecom - Market size and forecast 2025-2030

Chart on IT and telecom - Market size and forecast 2025-2030 ($ million)
Data Table on IT and telecom - Market size and forecast 2025-2030 ($ million)
Chart on IT and telecom - Year-over-year growth 2025-2030 (%)
Data Table on IT and telecom - Year-over-year growth 2025-2030 (%)

10.6 Retail and e-commerce - Market size and forecast 2025-2030

Chart on Retail and e-commerce - Market size and forecast 2025-2030 ($ million)
Data Table on Retail and e-commerce - Market size and forecast 2025-2030 ($ million)
Chart on Retail and e-commerce - Year-over-year growth 2025-2030 (%)
Data Table on Retail and e-commerce - Year-over-year growth 2025-2030 (%)

10.7 Others - Market size and forecast 2025-2030

Chart on Others - Market size and forecast 2025-2030 ($ million)
Data Table on Others - Market size and forecast 2025-2030 ($ million)
Chart on Others - Year-over-year growth 2025-2030 (%)
Data Table on Others - Year-over-year growth 2025-2030 (%)

10.8 Market opportunity by End-user

Market opportunity by End-user ($ million)
Data Table on Market opportunity by End-user ($ million)

11. Customer Landscape

11.1 Customer landscape overview

Analysis of price sensitivity, lifecycle, customer purchase basket, adoption rates, and purchase criteria

12. Geographic Landscape

12.1 Geographic segmentation

Chart on Market share by geography 2025-2030 (%)
Data Table on Market share by geography 2025-2030 (%)

12.2 Geographic comparison

Chart on Geographic comparison
Data Table on Geographic comparison

12.3 North America - Market size and forecast 2025-2030

Chart on North America - Market size and forecast 2025-2030 ($ million)
Data Table on North America - Market size and forecast 2025-2030 ($ million)
Chart on North America - Year-over-year growth 2025-2030 (%)
Data Table on North America - Year-over-year growth 2025-2030 (%)
Chart on Regional Comparison - North America
Data Table on Regional Comparison - North America

12.3.1 US - Market size and forecast 2025-2030

Chart on US - Market size and forecast 2025-2030 ($ million)
Data Table on US - Market size and forecast 2025-2030 ($ million)
Chart on US - Year-over-year growth 2025-2030 (%)
Data Table on US - Year-over-year growth 2025-2030 (%)

12.3.2 Canada - Market size and forecast 2025-2030

Chart on Canada - Market size and forecast 2025-2030 ($ million)
Data Table on Canada - Market size and forecast 2025-2030 ($ million)
Chart on Canada - Year-over-year growth 2025-2030 (%)
Data Table on Canada - Year-over-year growth 2025-2030 (%)

12.3.3 Mexico - Market size and forecast 2025-2030

Chart on Mexico - Market size and forecast 2025-2030 ($ million)
Data Table on Mexico - Market size and forecast 2025-2030 ($ million)
Chart on Mexico - Year-over-year growth 2025-2030 (%)
Data Table on Mexico - Year-over-year growth 2025-2030 (%)

12.4 Europe - Market size and forecast 2025-2030

Chart on Europe - Market size and forecast 2025-2030 ($ million)
Data Table on Europe - Market size and forecast 2025-2030 ($ million)
Chart on Europe - Year-over-year growth 2025-2030 (%)
Data Table on Europe - Year-over-year growth 2025-2030 (%)
Chart on Regional Comparison - Europe
Data Table on Regional Comparison - Europe

12.4.1 Germany - Market size and forecast 2025-2030

Chart on Germany - Market size and forecast 2025-2030 ($ million)
Data Table on Germany - Market size and forecast 2025-2030 ($ million)
Chart on Germany - Year-over-year growth 2025-2030 (%)
Data Table on Germany - Year-over-year growth 2025-2030 (%)

12.4.2 UK - Market size and forecast 2025-2030

Chart on UK - Market size and forecast 2025-2030 ($ million)
Data Table on UK - Market size and forecast 2025-2030 ($ million)
Chart on UK - Year-over-year growth 2025-2030 (%)
Data Table on UK - Year-over-year growth 2025-2030 (%)

12.4.3 France - Market size and forecast 2025-2030

Chart on France - Market size and forecast 2025-2030 ($ million)
Data Table on France - Market size and forecast 2025-2030 ($ million)
Chart on France - Year-over-year growth 2025-2030 (%)
Data Table on France - Year-over-year growth 2025-2030 (%)

12.4.4 Italy - Market size and forecast 2025-2030

Chart on Italy - Market size and forecast 2025-2030 ($ million)
Data Table on Italy - Market size and forecast 2025-2030 ($ million)
Chart on Italy - Year-over-year growth 2025-2030 (%)
Data Table on Italy - Year-over-year growth 2025-2030 (%)

12.4.5 Spain - Market size and forecast 2025-2030

Chart on Spain - Market size and forecast 2025-2030 ($ million)
Data Table on Spain - Market size and forecast 2025-2030 ($ million)
Chart on Spain - Year-over-year growth 2025-2030 (%)
Data Table on Spain - Year-over-year growth 2025-2030 (%)

12.4.6 The Netherlands - Market size and forecast 2025-2030

Chart on The Netherlands - Market size and forecast 2025-2030 ($ million)
Data Table on The Netherlands - Market size and forecast 2025-2030 ($ million)
Chart on The Netherlands - Year-over-year growth 2025-2030 (%)
Data Table on The Netherlands - Year-over-year growth 2025-2030 (%)

12.5 APAC - Market size and forecast 2025-2030

Chart on APAC - Market size and forecast 2025-2030 ($ million)
Data Table on APAC - Market size and forecast 2025-2030 ($ million)
Chart on APAC - Year-over-year growth 2025-2030 (%)
Data Table on APAC - Year-over-year growth 2025-2030 (%)
Chart on Regional Comparison - APAC
Data Table on Regional Comparison - APAC

12.5.1 China - Market size and forecast 2025-2030

Chart on China - Market size and forecast 2025-2030 ($ million)
Data Table on China - Market size and forecast 2025-2030 ($ million)
Chart on China - Year-over-year growth 2025-2030 (%)
Data Table on China - Year-over-year growth 2025-2030 (%)

12.5.2 India - Market size and forecast 2025-2030

Chart on India - Market size and forecast 2025-2030 ($ million)
Data Table on India - Market size and forecast 2025-2030 ($ million)
Chart on India - Year-over-year growth 2025-2030 (%)
Data Table on India - Year-over-year growth 2025-2030 (%)

12.5.3 Japan - Market size and forecast 2025-2030

Chart on Japan - Market size and forecast 2025-2030 ($ million)
Data Table on Japan - Market size and forecast 2025-2030 ($ million)
Chart on Japan - Year-over-year growth 2025-2030 (%)
Data Table on Japan - Year-over-year growth 2025-2030 (%)

12.5.4 South Korea - Market size and forecast 2025-2030

Chart on South Korea - Market size and forecast 2025-2030 ($ million)
Data Table on South Korea - Market size and forecast 2025-2030 ($ million)
Chart on South Korea - Year-over-year growth 2025-2030 (%)
Data Table on South Korea - Year-over-year growth 2025-2030 (%)

12.5.5 Australia - Market size and forecast 2025-2030

Chart on Australia - Market size and forecast 2025-2030 ($ million)
Data Table on Australia - Market size and forecast 2025-2030 ($ million)
Chart on Australia - Year-over-year growth 2025-2030 (%)
Data Table on Australia - Year-over-year growth 2025-2030 (%)

12.5.6 Indonesia - Market size and forecast 2025-2030

Chart on Indonesia - Market size and forecast 2025-2030 ($ million)
Data Table on Indonesia - Market size and forecast 2025-2030 ($ million)
Chart on Indonesia - Year-over-year growth 2025-2030 (%)
Data Table on Indonesia - Year-over-year growth 2025-2030 (%)

12.6 Middle East and Africa - Market size and forecast 2025-2030

Chart on Middle East and Africa - Market size and forecast 2025-2030 ($ million)
Data Table on Middle East and Africa - Market size and forecast 2025-2030 ($ million)
Chart on Middle East and Africa - Year-over-year growth 2025-2030 (%)
Data Table on Middle East and Africa - Year-over-year growth 2025-2030 (%)
Chart on Regional Comparison - Middle East and Africa
Data Table on Regional Comparison - Middle East and Africa

12.6.1 Saudi Arabia - Market size and forecast 2025-2030

Chart on Saudi Arabia - Market size and forecast 2025-2030 ($ million)
Data Table on Saudi Arabia - Market size and forecast 2025-2030 ($ million)
Chart on Saudi Arabia - Year-over-year growth 2025-2030 (%)
Data Table on Saudi Arabia - Year-over-year growth 2025-2030 (%)

12.6.2 UAE - Market size and forecast 2025-2030

Chart on UAE - Market size and forecast 2025-2030 ($ million)
Data Table on UAE - Market size and forecast 2025-2030 ($ million)
Chart on UAE - Year-over-year growth 2025-2030 (%)
Data Table on UAE - Year-over-year growth 2025-2030 (%)

12.6.3 South Africa - Market size and forecast 2025-2030

Chart on South Africa - Market size and forecast 2025-2030 ($ million)
Data Table on South Africa - Market size and forecast 2025-2030 ($ million)
Chart on South Africa - Year-over-year growth 2025-2030 (%)
Data Table on South Africa - Year-over-year growth 2025-2030 (%)

12.6.4 Israel - Market size and forecast 2025-2030

Chart on Israel - Market size and forecast 2025-2030 ($ million)
Data Table on Israel - Market size and forecast 2025-2030 ($ million)
Chart on Israel - Year-over-year growth 2025-2030 (%)
Data Table on Israel - Year-over-year growth 2025-2030 (%)

12.6.5 Turkey - Market size and forecast 2025-2030

Chart on Turkey - Market size and forecast 2025-2030 ($ million)
Data Table on Turkey - Market size and forecast 2025-2030 ($ million)
Chart on Turkey - Year-over-year growth 2025-2030 (%)
Data Table on Turkey - Year-over-year growth 2025-2030 (%)

12.7 South America - Market size and forecast 2025-2030

Chart on South America - Market size and forecast 2025-2030 ($ million)
Data Table on South America - Market size and forecast 2025-2030 ($ million)
Chart on South America - Year-over-year growth 2025-2030 (%)
Data Table on South America - Year-over-year growth 2025-2030 (%)
Chart on Regional Comparison - South America
Data Table on Regional Comparison - South America

12.7.1 Brazil - Market size and forecast 2025-2030

Chart on Brazil - Market size and forecast 2025-2030 ($ million)
Data Table on Brazil - Market size and forecast 2025-2030 ($ million)
Chart on Brazil - Year-over-year growth 2025-2030 (%)
Data Table on Brazil - Year-over-year growth 2025-2030 (%)

12.7.2 Argentina - Market size and forecast 2025-2030

Chart on Argentina - Market size and forecast 2025-2030 ($ million)
Data Table on Argentina - Market size and forecast 2025-2030 ($ million)
Chart on Argentina - Year-over-year growth 2025-2030 (%)
Data Table on Argentina - Year-over-year growth 2025-2030 (%)

12.7.3 Colombia - Market size and forecast 2025-2030

Chart on Colombia - Market size and forecast 2025-2030 ($ million)
Data Table on Colombia - Market size and forecast 2025-2030 ($ million)
Chart on Colombia - Year-over-year growth 2025-2030 (%)
Data Table on Colombia - Year-over-year growth 2025-2030 (%)

12.8 Market opportunity by geography

Market opportunity by geography ($ million)
Data Tables on Market opportunity by geography ($ million)

13. Drivers, Challenges, and Opportunity

13.1 Market drivers

Critical necessity for organizational agility and domain-specific data ownership
Expansion of generative artificial intelligence and high-quality data requirements
Accelerated cloud migration and complexity of multi-cloud environments

13.2 Market challenges

Cultural resistance and hurdle of organizational transformation
Managing complexity in federated governance and technical interoperability
Navigating high technical barriers and scarcity of specialized talent

13.3 Impact of drivers and challenges

Impact of drivers and challenges in 2025 and 2030

13.4 Market opportunities

Synthesis of data mesh architecture with generative artificial intelligence
Evolution of automated federated computational governance.
Standardizing data-as-a-product through contract-driven architectures

14. Competitive Landscape

14.1 Overview

14.2

Overview on criticality of inputs and factors of differentiation

14.3 Landscape disruption

Overview on factors of disruption

14.4 Industry risks

Impact of key risks on business

15. Competitive Analysis

15.1 Companies profiled

Companies covered

15.2 Company ranking index

15.3 Market positioning of companies

Matrix on companies position and classification

15.4 Accenture Plc

Accenture Plc - Overview
Accenture Plc - Business segments
Accenture Plc - Key news
Accenture Plc - Key offerings
Accenture Plc - Segment focus
SWOT

15.5 Bain and Co. Inc.

Bain and Co. Inc. - Overview
Bain and Co. Inc. - Product / Service
Bain and Co. Inc. - Key offerings
SWOT

15.6 Boston Consulting Group Inc.

Boston Consulting Group Inc. - Overview
Boston Consulting Group Inc. - Product / Service
Boston Consulting Group Inc. - Key offerings
SWOT

15.7 Capgemini SE

Capgemini SE - Overview
Capgemini SE - Business segments
Capgemini SE - Key news
Capgemini SE - Key offerings
Capgemini SE - Segment focus
SWOT

15.8 Cognizant Technology Solution

Cognizant Technology Solution - Overview
Cognizant Technology Solution - Business segments
Cognizant Technology Solution - Key news
Cognizant Technology Solution - Key offerings
Cognizant Technology Solution - Segment focus
SWOT

15.9 Deloitte Touche Tohmatsu Ltd.

Deloitte Touche Tohmatsu Ltd. - Overview
Deloitte Touche Tohmatsu Ltd. - Business segments
Deloitte Touche Tohmatsu Ltd. - Key offerings
Deloitte Touche Tohmatsu Ltd. - Segment focus
SWOT

15.10 DXC Technology Co.

DXC Technology Co. - Overview
DXC Technology Co. - Business segments
DXC Technology Co. - Key news
DXC Technology Co. - Key offerings
DXC Technology Co. - Segment focus
SWOT

15.11 Ernst and Young Global Ltd.

Ernst and Young Global Ltd. - Overview
Ernst and Young Global Ltd. - Product / Service
Ernst and Young Global Ltd. - Key offerings
SWOT

15.12 Genpact Ltd.

Genpact Ltd. - Overview
Genpact Ltd. - Business segments
Genpact Ltd. - Key offerings
Genpact Ltd. - Segment focus
SWOT

15.13 HCL Technologies Ltd.

HCL Technologies Ltd. - Overview
HCL Technologies Ltd. - Business segments
HCL Technologies Ltd. - Key offerings
HCL Technologies Ltd. - Segment focus
SWOT

15.14 IBM Corp.

IBM Corp. - Overview
IBM Corp. - Business segments
IBM Corp. - Key news
IBM Corp. - Key offerings
IBM Corp. - Segment focus
SWOT

15.15 Infosys Ltd.

Infosys Ltd. - Overview
Infosys Ltd. - Business segments
Infosys Ltd. - Key news
Infosys Ltd. - Key offerings
Infosys Ltd. - Segment focus
SWOT

15.16 KPMG International Ltd.

KPMG International Ltd. - Overview
KPMG International Ltd. - Product / Service
KPMG International Ltd. - Key offerings
SWOT

15.17 Kyndryl Inc.

Kyndryl Inc. - Overview
Kyndryl Inc. - Business segments
Kyndryl Inc. - Key offerings
Kyndryl Inc. - Segment focus
SWOT

15.18 LTIMindtree Ltd.

LTIMindtree Ltd. - Overview
LTIMindtree Ltd. - Product / Service
LTIMindtree Ltd. - Key offerings
SWOT

16. Appendix

16.1 Scope of the report

Market definition
Objectives
Notes and caveats

16.2 Inclusions and exclusions checklist

Inclusions checklist
Exclusions checklist

16.3 Currency conversion rates for US$

16.4 Research methodology

16.5 Data procurement

Information sources

16.6 Data validation

16.7 Validation techniques employed for market sizing

16.8 Data synthesis

16.9 360 degree market analysis

16.10 List of abbreviations

Research Methodology

Technavio presents a detailed picture of the market by way of study, synthesis, and summation of data from multiple sources. The analysts have presented the various facets of the market with a particular focus on identifying the key industry influencers. The data thus presented is comprehensive, reliable, and the result of extensive research, both primary and secondary.

INFORMATION SOURCES

Primary sources

  • Manufacturers and suppliers
  • Channel partners
  • Industry experts
  • Strategic decision makers

Secondary sources

  • Industry journals and periodicals
  • Government data
  • Financial reports of key industry players
  • Historical data
  • Press releases

DATA ANALYSIS

Data Synthesis

  • Collation of data
  • Estimation of key figures
  • Analysis of derived insights

Data Validation

  • Triangulation with data models
  • Reference against proprietary databases
  • Corroboration with industry experts

REPORT WRITING

Qualitative

  • Market drivers
  • Market challenges
  • Market trends
  • Five forces analysis

Quantitative

  • Market size and forecast
  • Market segmentation
  • Geographical insights
  • Competitive landscape

Interested in this report?

Get your sample now to see our research methodology and insights!

Download Now

Frequently Asked Questions

Data Mesh Enablement Services market growth will increase by USD 1598.7 million during 2026-2030.

The Data Mesh Enablement Services market is expected to grow at a CAGR of 17.6% during 2026-2030.

Data Mesh Enablement Services market is segmented by Deployment (Cloud based, On premises) Business segment (Large enterprises, Small and medium enterprises) End-user (BFSI, Healthcare, IT and telecom, Retail and e-commerce, Others)

Accenture Plc, Bain and Co. Inc., Boston Consulting Group Inc., Capgemini SE, Cognizant Technology Solution, Deloitte Touche Tohmatsu Ltd., DXC Technology Co., Ernst and Young Global Ltd., Genpact Ltd., HCL Technologies Ltd., IBM Corp., Infosys Ltd., KPMG International Ltd., Kyndryl Inc., LTIMindtree Ltd., NTT DATA Corp., PricewaterhouseCoopers LLP, Publicis Sapient, Slalom Consulting LLC, Tata Consultancy Services, Thoughtworks Holding Inc are a few of the key vendors in the Data Mesh Enablement Services market.

North America will register the highest growth rate of 42.1% among the other regions. Therefore, the Data Mesh Enablement Services market in North America is expected to garner significant business opportunities for the vendors during the forecast period.

US, Canada, Mexico, Germany, UK, France, Italy, Spain, The Netherlands, China, India, Japan, South Korea, Australia, Indonesia, Saudi Arabia, UAE, South Africa, Israel, Turkey, Brazil, Argentina, Colombia

  • Critical necessity for organizational agility and domain-specific data ownership is the driving factor this market.

The Data Mesh Enablement Services market vendors should focus on grabbing business opportunities from the Deployment segment as it accounted for the largest market share in the base year.
RIA - Research AI Assistant
Ask RIA