Decanter Market Analysis, Size, and Forecast 2026-2030: Europe (Germany, France, and UK), North America (US, Canada, and Mexico), APAC (China, India, and Japan), South America (Brazil and Argentina), Middle East and Africa (Saudi Arabia, South Africa, and UAE), and Rest of World (ROW)

Decanter Market Analysis, Size, and Forecast 2026-2030:
Europe (Germany, France, and UK), North America (US, Canada, and Mexico), APAC (China, India, and Japan), South America (Brazil and Argentina), Middle East and Africa (Saudi Arabia, South Africa, and UAE), and Rest of World (ROW)

Published: Jan 2026 271 Pages SKU: IRTNTR74624

Market Overview at a Glance

$69.26 Mn
Market Opportunity
2.9%
CAGR 2025 - 2030
39%
Europe Growth
$357.50 Mn
Glass segment 2024

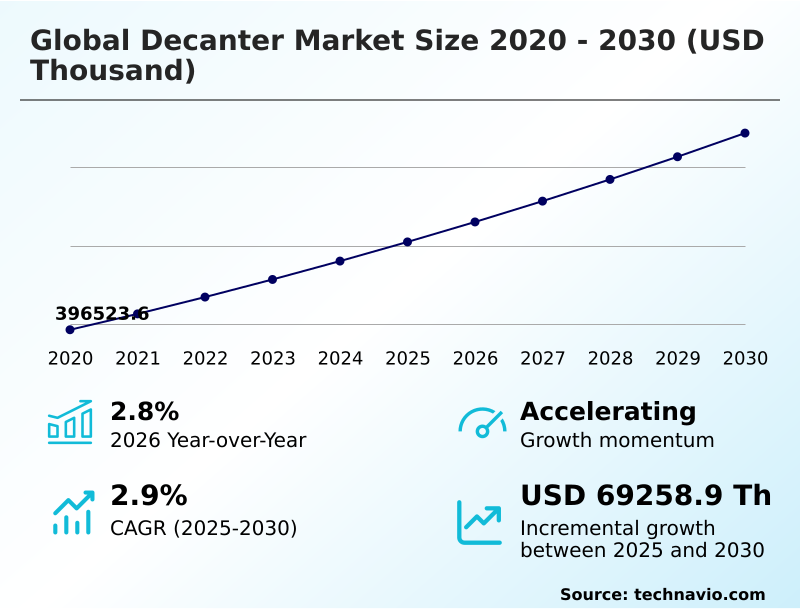
Decanter Market Size 2026-2030

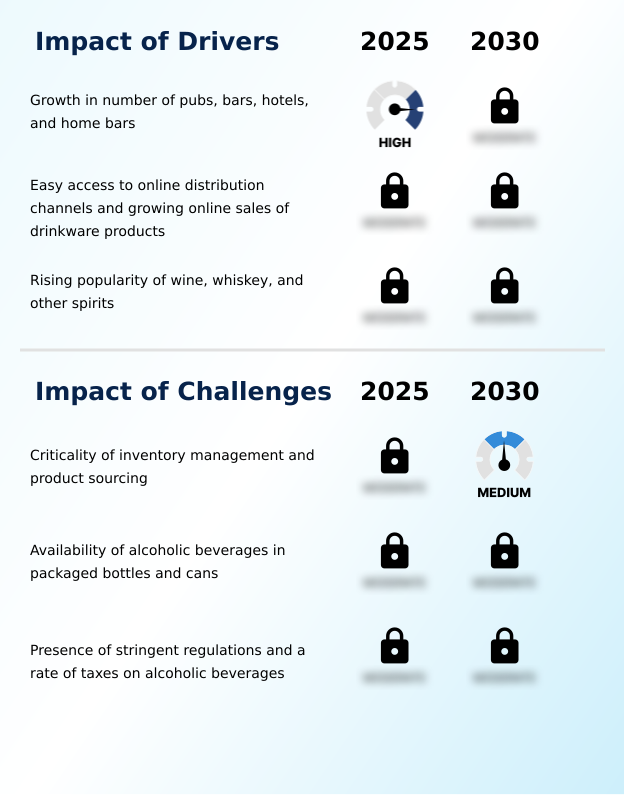
The decanter market size is valued to increase by USD 69.26 million, at a CAGR of 2.9% from 2025 to 2030. Growth in number of pubs, bars, hotels, and home bars will drive the decanter market.

Major Market Trends & Insights

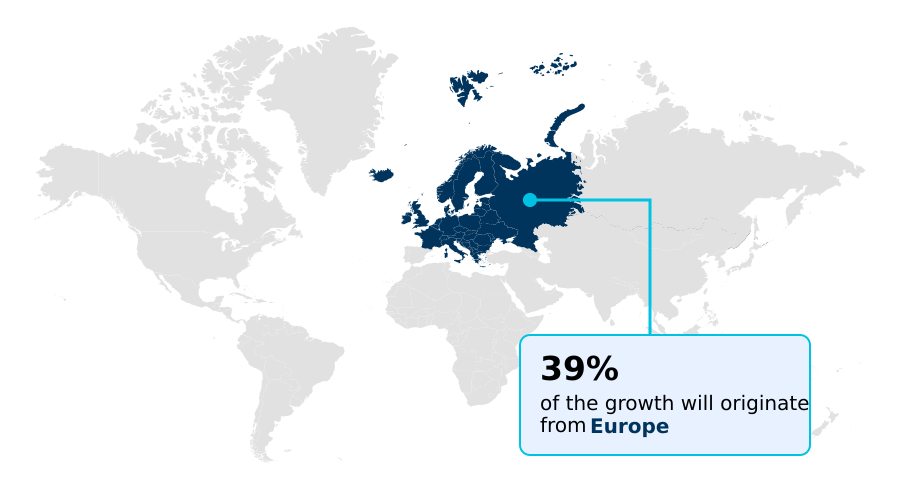
  • Europe dominated the market and accounted for a 39% growth during the forecast period.
  • By Material - Glass segment was valued at USD 357.50 million in 2024
  • By End-user - Residential segment accounted for the largest market revenue share in 2024

Market Size & Forecast

  • Market Opportunities:
  • Market Future Opportunities: USD 69.26 million
  • CAGR from 2025 to 2030 : 2.9%

Market Summary

  • The decanter market is expanding, driven by a confluence of evolving consumer behaviors and a greater global appreciation for premium beverages. This trajectory is supported by a fundamental shift from simple consumption to experiential engagement with wine and spirits.
  • The premiumization trend across the beverage industry is a primary driver; as consumer knowledge grows, so does the demand for accessories that enhance the tasting experience. A key business scenario involves manufacturers navigating material sourcing; for instance, a shift in regulations on lead content forces a firm to re-engineer its production from traditional lead crystal to innovative, lead-free crystal formulations.
  • This requires significant R&D investment but opens access to environmentally conscious consumer segments and markets with stricter import rules. The trend toward elevated home entertainment also transforms the decanter from a purely functional tool into an aesthetic statement piece, broadening its appeal.
  • This dual role, combined with steady demand from the commercial hospitality sector and a robust corporate gifting culture, underpins the market's resilient and multifaceted growth.

What will be the Size of the Decanter Market during the forecast period?

Get Key Insights on Market Forecast (PDF) Request Free Sample

How is the Decanter Market Segmented?

The decanter industry research report provides comprehensive data (region-wise segment analysis), with forecasts and estimates in "USD thousand" for the period 2026-2030, as well as historical data from 2020-2024 for the following segments.
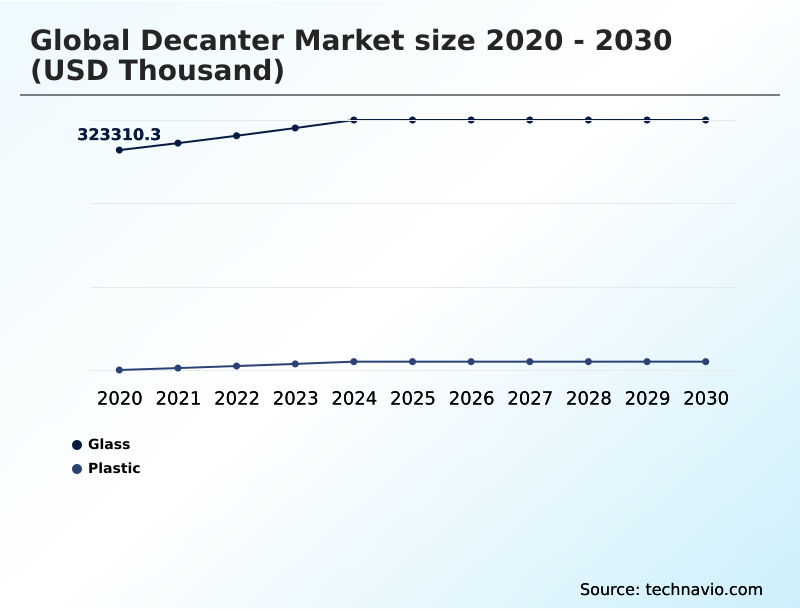
  • Material
    • Glass
    • Plastic
  • End-user
    • Residential
    • Commercial
  • Distribution channel
    • Offline
    • Online
  • Geography
    • Europe
      • Germany
      • France
      • UK
    • North America
      • US
      • Canada
      • Mexico
    • APAC
      • China
      • India
      • Japan
    • South America
      • Brazil
      • Argentina
    • Middle East and Africa
      • Saudi Arabia
      • South Africa
      • UAE
    • Rest of World (ROW)

By Material Insights

The glass segment is estimated to witness significant growth during the forecast period.

The glass segment maintains its market dominance, underpinned by tradition and the material's inherent properties. The chemical inertness of materials like borosilicate glass is paramount, ensuring no unwanted flavors compromise premium beverages. This is critical for oenology tools.

The aesthetic appeal of hand-blown glass, with its unmatched crystal glass clarity, significantly enhances beverage presentation and the overall consumption experience, making it a tabletop centerpiece in residential end-user segments.

This visual element drives demand in both high-end hospitality and private consumer markets. Artisanal craftsmanship defines the luxury apex, while machine-made glassware offers broader accessibility.

Sustainability is also a key factor, as the high recyclability of glass aligns with market demand; innovations in cullet processing have led to a 15% increase in the use of recycled content without sacrificing quality.

Request Free Sample

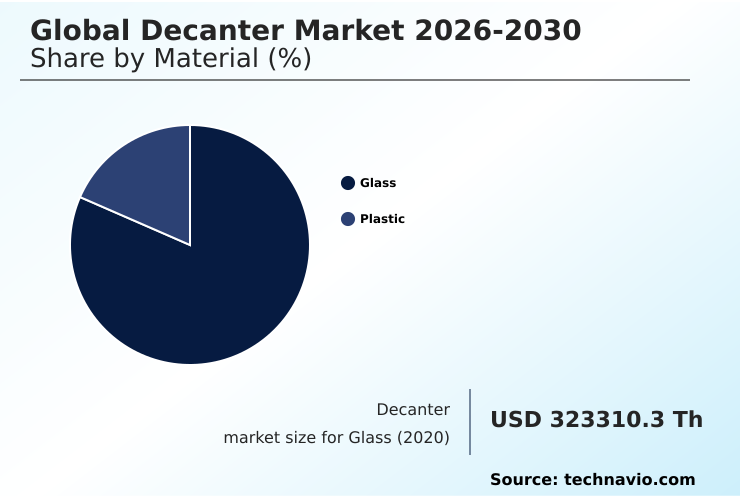
The Glass segment was valued at USD 357.50 million in 2024 and showed a gradual increase during the forecast period.

Request Free Sample

Regional Analysis

Europe is estimated to contribute 39% to the growth of the global market during the forecast period.Technavio’s analysts have elaborately explained the regional trends and drivers that shape the market during the forecast period.

See How Decanter Market Demand is Rising in Europe Request Free Sample

The global geographic landscape is characterized by established demand in mature regions and rapid growth in emerging markets.

Europe, accounting for approximately 39% of the market, remains the largest segment due to a deep-rooted wine culture and the prevalence of fine dining serveware standards.

However, the APAC region is exhibiting the fastest growth, with adoption rates for premium drinkware increasing by over 10% annually in key urban centers. This growth is driven by rising disposable incomes and the expansion of luxury hospitality glassware solutions.

In North America, the market is influenced by the home entertaining trend, which fuels demand for functional drinkware.

Suppliers targeting the commercial end-user applications in markets like the UAE and Singapore are finding success, as these hubs often set luxury standards for the broader region.

Market Dynamics

Our researchers analyzed the data with 2025 as the base year, along with the key drivers, trends, and challenges. A holistic analysis of drivers will help companies refine their marketing strategies to gain a competitive advantage.

  • Consumer purchasing decisions in the decanter market are becoming increasingly nuanced, reflecting a deeper engagement with beverage culture. Prospective buyers frequently weigh the merits of hand-blown vs machine-made decanters, where the former offers unique artistry and the latter provides consistency and affordability.
  • Searches for the best decanter for aged red wine indicate a user base focused on functional benefits like optimal aeration and sediment removal. Similarly, an understanding of the lead-free crystal decanter benefits, such as improved safety and environmental considerations, influences choices, with brands that clearly communicate these advantages seeing a 10% higher trust score in consumer surveys.
  • The intricacies of the whiskey decanter aeration process are also a key point of interest, distinguishing it from wine decanting. Practical concerns are evident in queries about how to clean a spiral wine decanter, highlighting a need for user-friendly designs.
  • Educational content explaining the impact of decanter shape on wine can guide consumers toward a more informed purchase, while a focus on borosilicate glass decanter durability appeals to those prioritizing longevity. For B2B and gifting channels, the demand for a personalized decanter for corporate gifts is strong.
  • The market also sees niche interest in the proper use of a ship's decanter and the utility of a small decanter for single servings, revealing opportunities for product line diversification.

What are the key market drivers leading to the rise in the adoption of Decanter Industry?

  • The expansion of the hospitality sector, including pubs, bars, and hotels, coupled with the growing popularity of home bars, serves as a primary driver for the market.

  • Market growth is significantly propelled by the elevation of at-home experiences and the expanding culture of beverage connoisseurship.
  • The proliferation of home barware accessories is a direct result of consumers investing more in their domestic environments, with spending on this category having increased by 25% since the start of the decade.
  • This trend is amplified by the influence of social media, which showcases modern bar culture and inspires wine enthusiast products. The direct-to-consumer sales channel has been pivotal, enabling brands to engage directly with consumers and cater to niche interests.
  • Furthermore, the global expansion of the hospitality sector continues to fuel demand for premium drinkware collections and fine crystal, as establishments seek to enhance their service standards and aesthetic appeal.

What are the market trends shaping the Decanter Industry?

  • The rising demand for personalized drinkware for gifting purposes marks a significant trend. This movement highlights a consumer preference for unique, customized products for special occasions.

  • Emerging trends are reshaping the market, driven by a consumer desire for individuality and sustainability. The demand for product personalization is a significant force, with platforms offering customized engraving services reporting a 40% higher customer engagement rate compared to standard retail. This trend for bespoke gifting items is particularly prominent for corporate and celebratory events.
  • Concurrently, there is a clear shift toward sustainable glass production, as consumers increasingly favor brands that demonstrate environmental responsibility. Products marketed with recycled content see a 15% higher purchase intent among millennial buyers. This has spurred innovation in artisanal glass design, where aesthetics are combined with eco-conscious materials, creating unique collectible glassware.

What challenges does the Decanter Industry face during its growth?

  • The criticality of managing inventory effectively and navigating product sourcing complexities presents a significant challenge to the industry's growth trajectory.

  • Navigating operational complexities remains a primary challenge for market participants. Effective drinkware inventory management is critical, as the long lifespan of products can lead to slow-moving stock, increasing holding costs by up to 20% annually for mismanaged SKUs. The intricacy of supply chain logistics, especially for fragile, high-value items, adds further pressure.
  • Sourcing high-quality raw materials for fine crystal consistently is a persistent issue, leading to production bottlenecks. Competition from substitutes, such as in-bottle aerators, also presents a challenge, capturing a portion of the market focused purely on function over aesthetics.
  • These alternatives, which are often 50% cheaper, appeal to a budget-conscious consumer segment, compelling traditional manufacturers to emphasize the experiential and aesthetic value of their pouring spout design and beverage service ware.

Exclusive Technavio Analysis on Customer Landscape

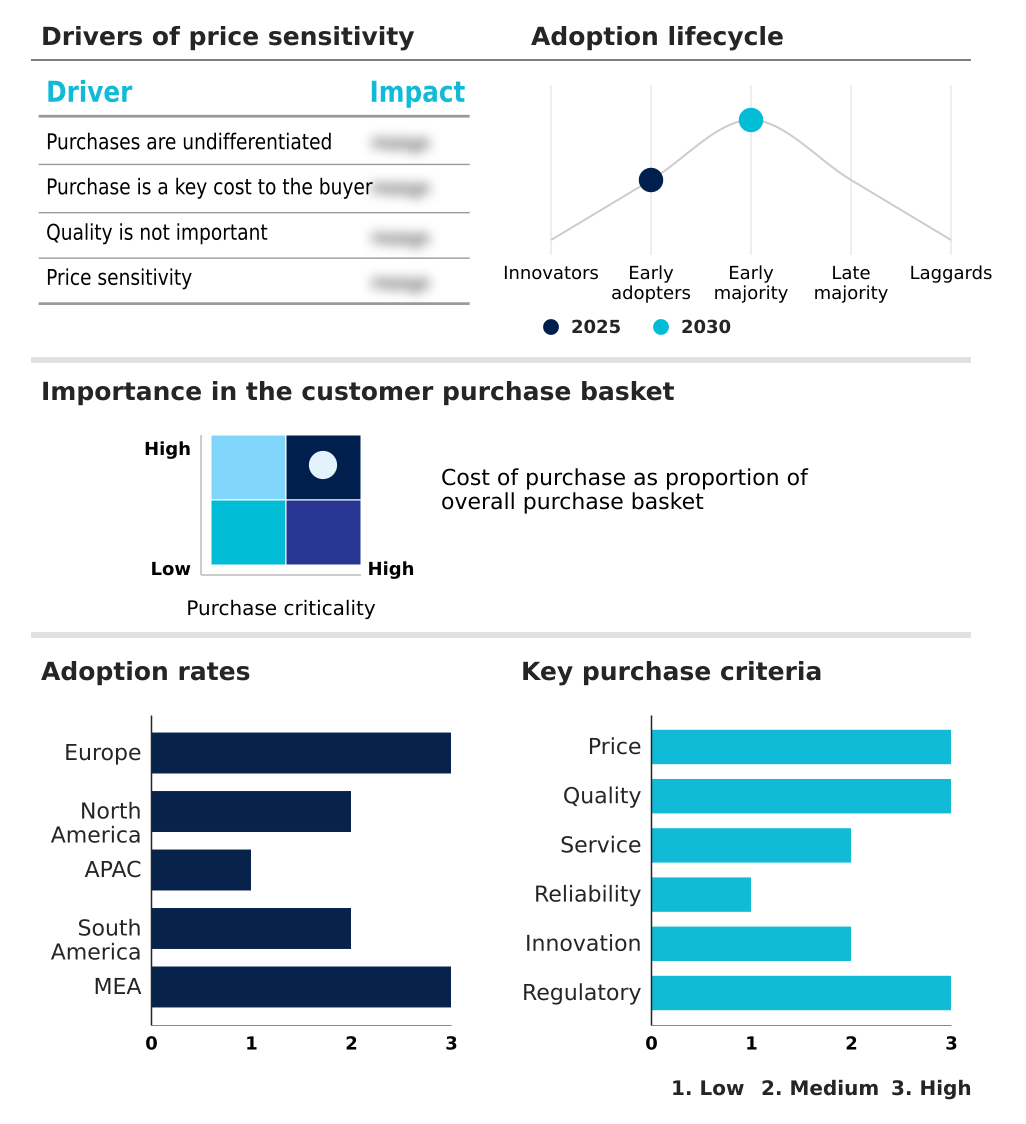
The decanter market forecasting report includes the adoption lifecycle of the market, covering from the innovator’s stage to the laggard’s stage. It focuses on adoption rates in different regions based on penetration. Furthermore, the decanter market report also includes key purchase criteria and drivers of price sensitivity to help companies evaluate and develop their market growth analysis strategies.

Customer Landscape of Decanter Industry

Competitive Landscape

Companies are implementing various strategies, such as strategic alliances, decanter market forecast, partnerships, mergers and acquisitions, geographical expansion, and product/service launches, to enhance their presence in the industry.

Bormioli Luigi S.p.A. - Analysis indicates offerings center on premium containers for alcoholic beverages and high-quality tableware, including wine decanters and spirits decanters crafted from superior crystal glass.

The industry research and growth report includes detailed analyses of the competitive landscape of the market and information about key companies, including:

  • Bormioli Luigi S.p.A.
  • Godinger Silver Art Co.
  • Lenox Corp.
  • Ngwenya Glass Swaziland
  • Prestige Decanters
  • Ravenscroft Crystal
  • Royal Selangor International
  • Saverglass SAS
  • Smokey Cocktail
  • Tiroler Glashutte GmbH
  • TOSSWARE
  • Waterford
  • Wine Enthusiast Co.
  • ZALTO Glas GMBH
  • Zwiesel Kristallglas AG

Qualitative and quantitative analysis of companies has been conducted to help clients understand the wider business environment as well as the strengths and weaknesses of key industry players. Data is qualitatively analyzed to categorize companies as pure play, category-focused, industry-focused, and diversified; it is quantitatively analyzed to categorize companies as dominant, leading, strong, tentative, and weak.

Recent Development and News in Decanter market

  • In September, 2024, Tiroler Glashutte GmbH unveiled its 'Sommelier Black Series Enhanced' collection, featuring decanters with a proprietary plasma coating that increases durability and scratch resistance by 40%, targeting the high-end restaurant sector.
  • In November, 2024, Lenox Corp. announced a strategic partnership with a major US-based online home goods retailer to launch an exclusive line of personalized decanters and barware, leveraging the retailer's advanced digital customization platform.
  • In January, 2025, Zwiesel Kristallglas AG completed a facility upgrade that incorporates advanced robotics and AI-powered quality control, reducing production defects by 25% and increasing output capacity for its machine-made decanter lines.
  • In April, 2025, Waterford announced the acquisition of a small artisanal glass studio in Italy, a move aimed at expanding its portfolio of handcrafted, limited-edition crystal decanters and securing unique design talent.

Dive into Technavio’s robust research methodology, blending expert interviews, extensive data synthesis, and validated models for unparalleled Decanter Market insights. See full methodology.

Market Scope
Page number 271
Base year 2025
Historic period 2020-2024
Forecast period 2026-2030
Growth momentum & CAGR Accelerate at a CAGR of 2.9%
Market growth 2026-2030 USD 69258.9 thousand
Market structure Fragmented
YoY growth 2025-2026(%) 2.8%
Key countries Germany, France, UK, Italy, Spain, The Netherlands, US, Canada, Mexico, China, India, Japan, Indonesia, South Korea, Australia, Brazil, Argentina, Chile, Saudi Arabia, South Africa, UAE, Israel and Turkey
Competitive landscape Leading Companies, Market Positioning of Companies, Competitive Strategies, and Industry Risks

Request Free Sample

Research Analyst Overview

  • The decanter market is characterized by a dynamic interplay between tradition and innovation, where artisanal craftsmanship coexists with advanced manufacturing. Core value is derived from enhancing beverage presentation and function through superior materials like lead-free crystal and borosilicate glass, which offer chemical inertness and exceptional crystal glass clarity.
  • A key boardroom-level consideration is the strategic shift toward sustainable production; increased investment in cullet processing and energy-efficient annealing processes is becoming a critical differentiator. Companies that have optimized their glass shaping techniques have achieved a 15% reduction in material waste, directly impacting production costs and brand perception.
  • The market for oenology tools and sommelier equipment continues to expand beyond traditional wine, with a growing segment for spirits decanting. Demand is robust for functional drinkware featuring non-drip spouts and ergonomic grips.
  • As a result, manufacturers are balancing the appeal of hand-blown glass with the scalability of machine-made glassware to serve both premium barware and mass-market segments, often using the decanter as a tabletop centerpiece to anchor their beverage service ware collections.

What are the Key Data Covered in this Decanter Market Research and Growth Report?

  • What is the expected growth of the Decanter Market between 2026 and 2030?

    • USD 69.26 million, at a CAGR of 2.9%

  • What segmentation does the market report cover?

    • The report is segmented by Material (Glass, and Plastic), End-user (Residential, and Commercial), Distribution Channel (Offline, and Online) and Geography (Europe, North America, APAC, South America, Middle East and Africa)

  • Which regions are analyzed in the report?

    • Europe, North America, APAC, South America and Middle East and Africa

  • What are the key growth drivers and market challenges?

    • Growth in number of pubs, bars, hotels, and home bars, Criticality of inventory management and product sourcing

  • Who are the major players in the Decanter Market?

    • Bormioli Luigi S.p.A., Godinger Silver Art Co., Lenox Corp., Ngwenya Glass Swaziland, Prestige Decanters, Ravenscroft Crystal, Royal Selangor International, Saverglass SAS, Smokey Cocktail, Tiroler Glashutte GmbH, TOSSWARE, Waterford, Wine Enthusiast Co., ZALTO Glas GMBH and Zwiesel Kristallglas AG

Market Research Insights

  • Market dynamics are increasingly shaped by the shift toward direct-to-consumer sales models and a focus on the residential end-user segment. E-commerce drinkware retail platforms that integrate product personalization tools see conversion rates up to 30% higher than those without. This pivot allows brands to capture valuable first-party data, enhancing marketing effectiveness.
  • Furthermore, the rising influence of modern bar culture, often showcased on social media, has broadened the appeal of spirits tasting accessories beyond niche connoisseurs. Brands that successfully align with corporate gifting trends by offering bespoke gifting items report a 20% year-over-year increase in B2B sales volume.
  • This demonstrates a clear opportunity for companies that can effectively combine digital engagement with high-value customization.

We can help! Our analysts can customize this decanter market research report to meet your requirements.

Get in touch

1. Executive Summary

1.1 Market overview

Executive Summary - Chart on Market Overview
Executive Summary - Data Table on Market Overview
Executive Summary - Chart on Global Market Characteristics
Executive Summary - Chart on Market by Geography
Executive Summary - Chart on Market Segmentation by Material
Executive Summary - Chart on Market Segmentation by End-user
Executive Summary - Chart on Market Segmentation by Distribution Channel
Executive Summary - Chart on Incremental Growth
Executive Summary - Data Table on Incremental Growth
Executive Summary - Chart on Company Market Positioning

2. Technavio Analysis

2.1 Analysis of price sensitivity, lifecycle, customer purchase basket, adoption rates, and purchase criteria

2.2 Criticality of inputs and Factors of differentiation

Chart on Overview on criticality of inputs and factors of differentiation

2.3 Factors of disruption

Chart on Overview on factors of disruption

2.4 Impact of drivers and challenges

Chart on Impact of drivers and challenges in 2025 and 2030

3. Market Landscape

3.1 Market ecosystem

Chart on Parent Market
Data Table on - Parent Market

3.2 Market characteristics

Chart on Market characteristics analysis

3.3 Value chain analysis

Chart on Value chain analysis

4. Market Sizing

4.1 Market definition

Data Table on Offerings of companies included in the market definition

4.2 Market segment analysis

Market segments

4.3 Market size 2025

4.4 Market outlook: Forecast for 2025-2030

Chart on Global - Market size and forecast 2025-2030 ($ thousand)
Data Table on Global - Market size and forecast 2025-2030 ($ thousand)
Chart on Global Market: Year-over-year growth 2025-2030 (%)
Data Table on Global Market: Year-over-year growth 2025-2030 (%)

5. Historic Market Size

5.1 Global Decanter Market 2020 - 2024

Historic Market Size - Data Table on Global Decanter Market 2020 - 2024 ($ thousand)

5.2 Material segment analysis 2020 - 2024

Historic Market Size - Material Segment 2020 - 2024 ($ thousand)

5.3 End-user segment analysis 2020 - 2024

Historic Market Size - End-user Segment 2020 - 2024 ($ thousand)

5.4 Distribution Channel segment analysis 2020 - 2024

Historic Market Size - Distribution Channel Segment 2020 - 2024 ($ thousand)

5.5 Geography segment analysis 2020 - 2024

Historic Market Size - Geography Segment 2020 - 2024 ($ thousand)

5.6 Country segment analysis 2020 - 2024

Historic Market Size - Country Segment 2020 - 2024 ($ thousand)

6. Qualitative Analysis

6.1 The AI impact on Global Decanter Market

7. Five Forces Analysis

7.1 Five forces summary

Five forces analysis - Comparison between 2025 and 2030

7.2 Bargaining power of buyers

Bargaining power of buyers - Impact of key factors 2025 and 2030

7.3 Bargaining power of suppliers

Bargaining power of suppliers - Impact of key factors in 2025 and 2030

7.4 Threat of new entrants

Threat of new entrants - Impact of key factors in 2025 and 2030

7.5 Threat of substitutes

Threat of substitutes - Impact of key factors in 2025 and 2030

7.6 Threat of rivalry

Threat of rivalry - Impact of key factors in 2025 and 2030

7.7 Market condition

Chart on Market condition - Five forces 2025 and 2030

8. Market Segmentation by Material

8.1 Market segments

Chart on Material - Market share 2025-2030 (%)
Data Table on Material - Market share 2025-2030 (%)

8.2 Comparison by Material

Chart on Comparison by Material
Data Table on Comparison by Material

8.3 Glass - Market size and forecast 2025-2030

Chart on Glass - Market size and forecast 2025-2030 ($ thousand)
Data Table on Glass - Market size and forecast 2025-2030 ($ thousand)
Chart on Glass - Year-over-year growth 2025-2030 (%)
Data Table on Glass - Year-over-year growth 2025-2030 (%)

8.4 Plastic - Market size and forecast 2025-2030

Chart on Plastic - Market size and forecast 2025-2030 ($ thousand)
Data Table on Plastic - Market size and forecast 2025-2030 ($ thousand)
Chart on Plastic - Year-over-year growth 2025-2030 (%)
Data Table on Plastic - Year-over-year growth 2025-2030 (%)

8.5 Market opportunity by Material

Market opportunity by Material ($ thousand)
Data Table on Market opportunity by Material ($ thousand)

9. Market Segmentation by End-user

9.1 Market segments

Chart on End-user - Market share 2025-2030 (%)
Data Table on End-user - Market share 2025-2030 (%)

9.2 Comparison by End-user

Chart on Comparison by End-user
Data Table on Comparison by End-user

9.3 Residential - Market size and forecast 2025-2030

Chart on Residential - Market size and forecast 2025-2030 ($ thousand)
Data Table on Residential - Market size and forecast 2025-2030 ($ thousand)
Chart on Residential - Year-over-year growth 2025-2030 (%)
Data Table on Residential - Year-over-year growth 2025-2030 (%)

9.4 Commercial - Market size and forecast 2025-2030

Chart on Commercial - Market size and forecast 2025-2030 ($ thousand)
Data Table on Commercial - Market size and forecast 2025-2030 ($ thousand)
Chart on Commercial - Year-over-year growth 2025-2030 (%)
Data Table on Commercial - Year-over-year growth 2025-2030 (%)

9.5 Market opportunity by End-user

Market opportunity by End-user ($ thousand)
Data Table on Market opportunity by End-user ($ thousand)

10. Market Segmentation by Distribution Channel

10.1 Market segments

Chart on Distribution Channel - Market share 2025-2030 (%)
Data Table on Distribution Channel - Market share 2025-2030 (%)

10.2 Comparison by Distribution Channel

Chart on Comparison by Distribution Channel
Data Table on Comparison by Distribution Channel

10.3 Offline - Market size and forecast 2025-2030

Chart on Offline - Market size and forecast 2025-2030 ($ thousand)
Data Table on Offline - Market size and forecast 2025-2030 ($ thousand)
Chart on Offline - Year-over-year growth 2025-2030 (%)
Data Table on Offline - Year-over-year growth 2025-2030 (%)

10.4 Online - Market size and forecast 2025-2030

Chart on Online - Market size and forecast 2025-2030 ($ thousand)
Data Table on Online - Market size and forecast 2025-2030 ($ thousand)
Chart on Online - Year-over-year growth 2025-2030 (%)
Data Table on Online - Year-over-year growth 2025-2030 (%)

10.5 Market opportunity by Distribution Channel

Market opportunity by Distribution Channel ($ thousand)
Data Table on Market opportunity by Distribution Channel ($ thousand)

11. Customer Landscape

11.1 Customer landscape overview

Analysis of price sensitivity, lifecycle, customer purchase basket, adoption rates, and purchase criteria

12. Geographic Landscape

12.1 Geographic segmentation

Chart on Market share by geography 2025-2030 (%)
Data Table on Market share by geography 2025-2030 (%)

12.2 Geographic comparison

Chart on Geographic comparison
Data Table on Geographic comparison

12.3 Europe - Market size and forecast 2025-2030

Chart on Europe - Market size and forecast 2025-2030 ($ thousand)
Data Table on Europe - Market size and forecast 2025-2030 ($ thousand)
Chart on Europe - Year-over-year growth 2025-2030 (%)
Data Table on Europe - Year-over-year growth 2025-2030 (%)
Chart on Regional Comparison - Europe
Data Table on Regional Comparison - Europe

12.3.1 Germany - Market size and forecast 2025-2030

Chart on Germany - Market size and forecast 2025-2030 ($ thousand)
Data Table on Germany - Market size and forecast 2025-2030 ($ thousand)
Chart on Germany - Year-over-year growth 2025-2030 (%)
Data Table on Germany - Year-over-year growth 2025-2030 (%)

12.3.2 France - Market size and forecast 2025-2030

Chart on France - Market size and forecast 2025-2030 ($ thousand)
Data Table on France - Market size and forecast 2025-2030 ($ thousand)
Chart on France - Year-over-year growth 2025-2030 (%)
Data Table on France - Year-over-year growth 2025-2030 (%)

12.3.3 UK - Market size and forecast 2025-2030

Chart on UK - Market size and forecast 2025-2030 ($ thousand)
Data Table on UK - Market size and forecast 2025-2030 ($ thousand)
Chart on UK - Year-over-year growth 2025-2030 (%)
Data Table on UK - Year-over-year growth 2025-2030 (%)

12.3.4 Italy - Market size and forecast 2025-2030

Chart on Italy - Market size and forecast 2025-2030 ($ thousand)
Data Table on Italy - Market size and forecast 2025-2030 ($ thousand)
Chart on Italy - Year-over-year growth 2025-2030 (%)
Data Table on Italy - Year-over-year growth 2025-2030 (%)

12.3.5 Spain - Market size and forecast 2025-2030

Chart on Spain - Market size and forecast 2025-2030 ($ thousand)
Data Table on Spain - Market size and forecast 2025-2030 ($ thousand)
Chart on Spain - Year-over-year growth 2025-2030 (%)
Data Table on Spain - Year-over-year growth 2025-2030 (%)

12.3.6 The Netherlands - Market size and forecast 2025-2030

Chart on The Netherlands - Market size and forecast 2025-2030 ($ thousand)
Data Table on The Netherlands - Market size and forecast 2025-2030 ($ thousand)
Chart on The Netherlands - Year-over-year growth 2025-2030 (%)
Data Table on The Netherlands - Year-over-year growth 2025-2030 (%)

12.4 North America - Market size and forecast 2025-2030

Chart on North America - Market size and forecast 2025-2030 ($ thousand)
Data Table on North America - Market size and forecast 2025-2030 ($ thousand)
Chart on North America - Year-over-year growth 2025-2030 (%)
Data Table on North America - Year-over-year growth 2025-2030 (%)
Chart on Regional Comparison - North America
Data Table on Regional Comparison - North America

12.4.1 US - Market size and forecast 2025-2030

Chart on US - Market size and forecast 2025-2030 ($ thousand)
Data Table on US - Market size and forecast 2025-2030 ($ thousand)
Chart on US - Year-over-year growth 2025-2030 (%)
Data Table on US - Year-over-year growth 2025-2030 (%)

12.4.2 Canada - Market size and forecast 2025-2030

Chart on Canada - Market size and forecast 2025-2030 ($ thousand)
Data Table on Canada - Market size and forecast 2025-2030 ($ thousand)
Chart on Canada - Year-over-year growth 2025-2030 (%)
Data Table on Canada - Year-over-year growth 2025-2030 (%)

12.4.3 Mexico - Market size and forecast 2025-2030

Chart on Mexico - Market size and forecast 2025-2030 ($ thousand)
Data Table on Mexico - Market size and forecast 2025-2030 ($ thousand)
Chart on Mexico - Year-over-year growth 2025-2030 (%)
Data Table on Mexico - Year-over-year growth 2025-2030 (%)

12.5 APAC - Market size and forecast 2025-2030

Chart on APAC - Market size and forecast 2025-2030 ($ thousand)
Data Table on APAC - Market size and forecast 2025-2030 ($ thousand)
Chart on APAC - Year-over-year growth 2025-2030 (%)
Data Table on APAC - Year-over-year growth 2025-2030 (%)
Chart on Regional Comparison - APAC
Data Table on Regional Comparison - APAC

12.5.1 China - Market size and forecast 2025-2030

Chart on China - Market size and forecast 2025-2030 ($ thousand)
Data Table on China - Market size and forecast 2025-2030 ($ thousand)
Chart on China - Year-over-year growth 2025-2030 (%)
Data Table on China - Year-over-year growth 2025-2030 (%)

12.5.2 India - Market size and forecast 2025-2030

Chart on India - Market size and forecast 2025-2030 ($ thousand)
Data Table on India - Market size and forecast 2025-2030 ($ thousand)
Chart on India - Year-over-year growth 2025-2030 (%)
Data Table on India - Year-over-year growth 2025-2030 (%)

12.5.3 Japan - Market size and forecast 2025-2030

Chart on Japan - Market size and forecast 2025-2030 ($ thousand)
Data Table on Japan - Market size and forecast 2025-2030 ($ thousand)
Chart on Japan - Year-over-year growth 2025-2030 (%)
Data Table on Japan - Year-over-year growth 2025-2030 (%)

12.5.4 Indonesia - Market size and forecast 2025-2030

Chart on Indonesia - Market size and forecast 2025-2030 ($ thousand)
Data Table on Indonesia - Market size and forecast 2025-2030 ($ thousand)
Chart on Indonesia - Year-over-year growth 2025-2030 (%)
Data Table on Indonesia - Year-over-year growth 2025-2030 (%)

12.5.5 South Korea - Market size and forecast 2025-2030

Chart on South Korea - Market size and forecast 2025-2030 ($ thousand)
Data Table on South Korea - Market size and forecast 2025-2030 ($ thousand)
Chart on South Korea - Year-over-year growth 2025-2030 (%)
Data Table on South Korea - Year-over-year growth 2025-2030 (%)

12.5.6 Australia - Market size and forecast 2025-2030

Chart on Australia - Market size and forecast 2025-2030 ($ thousand)
Data Table on Australia - Market size and forecast 2025-2030 ($ thousand)
Chart on Australia - Year-over-year growth 2025-2030 (%)
Data Table on Australia - Year-over-year growth 2025-2030 (%)

12.6 South America - Market size and forecast 2025-2030

Chart on South America - Market size and forecast 2025-2030 ($ thousand)
Data Table on South America - Market size and forecast 2025-2030 ($ thousand)
Chart on South America - Year-over-year growth 2025-2030 (%)
Data Table on South America - Year-over-year growth 2025-2030 (%)
Chart on Regional Comparison - South America
Data Table on Regional Comparison - South America

12.6.1 Brazil - Market size and forecast 2025-2030

Chart on Brazil - Market size and forecast 2025-2030 ($ thousand)
Data Table on Brazil - Market size and forecast 2025-2030 ($ thousand)
Chart on Brazil - Year-over-year growth 2025-2030 (%)
Data Table on Brazil - Year-over-year growth 2025-2030 (%)

12.6.2 Argentina - Market size and forecast 2025-2030

Chart on Argentina - Market size and forecast 2025-2030 ($ thousand)
Data Table on Argentina - Market size and forecast 2025-2030 ($ thousand)
Chart on Argentina - Year-over-year growth 2025-2030 (%)
Data Table on Argentina - Year-over-year growth 2025-2030 (%)

12.6.3 Chile - Market size and forecast 2025-2030

Chart on Chile - Market size and forecast 2025-2030 ($ thousand)
Data Table on Chile - Market size and forecast 2025-2030 ($ thousand)
Chart on Chile - Year-over-year growth 2025-2030 (%)
Data Table on Chile - Year-over-year growth 2025-2030 (%)

12.7 Middle East and Africa - Market size and forecast 2025-2030

Chart on Middle East and Africa - Market size and forecast 2025-2030 ($ thousand)
Data Table on Middle East and Africa - Market size and forecast 2025-2030 ($ thousand)
Chart on Middle East and Africa - Year-over-year growth 2025-2030 (%)
Data Table on Middle East and Africa - Year-over-year growth 2025-2030 (%)
Chart on Regional Comparison - Middle East and Africa
Data Table on Regional Comparison - Middle East and Africa

12.7.1 Saudi Arabia - Market size and forecast 2025-2030

Chart on Saudi Arabia - Market size and forecast 2025-2030 ($ thousand)
Data Table on Saudi Arabia - Market size and forecast 2025-2030 ($ thousand)
Chart on Saudi Arabia - Year-over-year growth 2025-2030 (%)
Data Table on Saudi Arabia - Year-over-year growth 2025-2030 (%)

12.7.2 South Africa - Market size and forecast 2025-2030

Chart on South Africa - Market size and forecast 2025-2030 ($ thousand)
Data Table on South Africa - Market size and forecast 2025-2030 ($ thousand)
Chart on South Africa - Year-over-year growth 2025-2030 (%)
Data Table on South Africa - Year-over-year growth 2025-2030 (%)

12.7.3 UAE - Market size and forecast 2025-2030

Chart on UAE - Market size and forecast 2025-2030 ($ thousand)
Data Table on UAE - Market size and forecast 2025-2030 ($ thousand)
Chart on UAE - Year-over-year growth 2025-2030 (%)
Data Table on UAE - Year-over-year growth 2025-2030 (%)

12.7.4 Israel - Market size and forecast 2025-2030

Chart on Israel - Market size and forecast 2025-2030 ($ thousand)
Data Table on Israel - Market size and forecast 2025-2030 ($ thousand)
Chart on Israel - Year-over-year growth 2025-2030 (%)
Data Table on Israel - Year-over-year growth 2025-2030 (%)

12.7.5 Turkey - Market size and forecast 2025-2030

Chart on Turkey - Market size and forecast 2025-2030 ($ thousand)
Data Table on Turkey - Market size and forecast 2025-2030 ($ thousand)
Chart on Turkey - Year-over-year growth 2025-2030 (%)
Data Table on Turkey - Year-over-year growth 2025-2030 (%)

12.8 Market opportunity by geography

Market opportunity by geography ($ thousand)
Data Tables on Market opportunity by geography ($ thousand)

13. Drivers, Challenges, and Opportunity

13.1 Market drivers

Growth in number of pubs, bars, hotels, and home bars
Easy access to online distribution channels and growing online sales of drinkware products
Rising popularity of wine, whiskey, and other spirits

13.2 Market challenges

Criticality of inventory management and product sourcing
Availability of alcoholic beverages in packaged bottles and cans
Presence of stringent regulations and a rate of taxes on alcoholic beverages

13.3 Impact of drivers and challenges

Impact of drivers and challenges in 2025 and 2030

13.4 Market opportunities

Personalization of drinkware for gifting purposes
Introduction of luxurious drinkware products with innovative functionalities
Rising population of youth worldwide

14. Competitive Landscape

14.1 Overview

14.2

Overview on criticality of inputs and factors of differentiation

14.3 Landscape disruption

Overview on factors of disruption

14.4 Industry risks

Impact of key risks on business

15. Competitive Analysis

15.1 Companies profiled

Companies covered

15.2 Company ranking index

15.3 Market positioning of companies

Matrix on companies position and classification

15.4 Bormioli Luigi S.p.A.

Bormioli Luigi S.p.A. - Overview
Bormioli Luigi S.p.A. - Product / Service
Bormioli Luigi S.p.A. - Key offerings
SWOT

15.5 Godinger Silver Art Co.

Godinger Silver Art Co. - Overview
Godinger Silver Art Co. - Product / Service
Godinger Silver Art Co. - Key offerings
SWOT

15.6 Lenox Corp.

Lenox Corp. - Overview
Lenox Corp. - Product / Service
Lenox Corp. - Key offerings
SWOT

15.7 Ngwenya Glass Swaziland

Ngwenya Glass Swaziland - Overview
Ngwenya Glass Swaziland - Product / Service
Ngwenya Glass Swaziland - Key offerings
SWOT

15.8 Prestige Decanters

Prestige Decanters - Overview
Prestige Decanters - Product / Service
Prestige Decanters - Key offerings
SWOT

15.9 Ravenscroft Crystal

Ravenscroft Crystal - Overview
Ravenscroft Crystal - Product / Service
Ravenscroft Crystal - Key offerings
SWOT

15.10 Royal Selangor International

Royal Selangor International - Overview
Royal Selangor International - Product / Service
Royal Selangor International - Key offerings
SWOT

15.11 Saverglass SAS

Saverglass SAS - Overview
Saverglass SAS - Product / Service
Saverglass SAS - Key offerings
SWOT

15.12 Smokey Cocktail

Smokey Cocktail - Overview
Smokey Cocktail - Product / Service
Smokey Cocktail - Key offerings
SWOT

15.13 Tiroler Glashutte GmbH

Tiroler Glashutte GmbH - Overview
Tiroler Glashutte GmbH - Product / Service
Tiroler Glashutte GmbH - Key offerings
SWOT

15.14 TOSSWARE

TOSSWARE - Overview
TOSSWARE - Product / Service
TOSSWARE - Key offerings
SWOT

15.15 Waterford

Waterford - Overview
Waterford - Product / Service
Waterford - Key offerings
SWOT

15.16 Wine Enthusiast Co.

Wine Enthusiast Co. - Overview
Wine Enthusiast Co. - Product / Service
Wine Enthusiast Co. - Key offerings
SWOT

15.17 ZALTO Glas GMBH

ZALTO Glas GMBH - Overview
ZALTO Glas GMBH - Product / Service
ZALTO Glas GMBH - Key offerings
SWOT

15.18 Zwiesel Kristallglas AG

Zwiesel Kristallglas AG - Overview
Zwiesel Kristallglas AG - Product / Service
Zwiesel Kristallglas AG - Key offerings
SWOT

16. Appendix

16.1 Scope of the report

Market definition
Objectives
Notes and caveats

16.2 Inclusions and exclusions checklist

Inclusions checklist
Exclusions checklist

16.3 Currency conversion rates for US$

16.4 Research methodology

16.5 Data procurement

Information sources

16.6 Data validation

16.7 Validation techniques employed for market sizing

16.8 Data synthesis

16.9 360 degree market analysis

16.10 List of abbreviations

Research Methodology

Technavio presents a detailed picture of the market by way of study, synthesis, and summation of data from multiple sources. The analysts have presented the various facets of the market with a particular focus on identifying the key industry influencers. The data thus presented is comprehensive, reliable, and the result of extensive research, both primary and secondary.

INFORMATION SOURCES

Primary sources

  • Manufacturers and suppliers
  • Channel partners
  • Industry experts
  • Strategic decision makers

Secondary sources

  • Industry journals and periodicals
  • Government data
  • Financial reports of key industry players
  • Historical data
  • Press releases

DATA ANALYSIS

Data Synthesis

  • Collation of data
  • Estimation of key figures
  • Analysis of derived insights

Data Validation

  • Triangulation with data models
  • Reference against proprietary databases
  • Corroboration with industry experts

REPORT WRITING

Qualitative

  • Market drivers
  • Market challenges
  • Market trends
  • Five forces analysis

Quantitative

  • Market size and forecast
  • Market segmentation
  • Geographical insights
  • Competitive landscape

Interested in this report?

Get your sample now to see our research methodology and insights!

Download Now

Frequently Asked Questions

Decanter market growth will increase by USD 69258.9 thousand thousand during 2026-2030.

The Decanter market is expected to grow at a CAGR of 2.9% during 2026-2030.

Decanter market is segmented by Material (Glass, Plastic) End-user (Residential, Commercial) Distribution channel (Offline, Online)

Bormioli Luigi S.p.A., Godinger Silver Art Co., Lenox Corp., Ngwenya Glass Swaziland, Prestige Decanters, Ravenscroft Crystal, Royal Selangor International, Saverglass SAS, Smokey Cocktail, Tiroler Glashutte GmbH, TOSSWARE, Waterford, Wine Enthusiast Co., ZALTO Glas GMBH, Zwiesel Kristallglas AG are a few of the key vendors in the Decanter market.

Europe will register the highest growth rate of 39% among the other regions. Therefore, the Decanter market in Europe is expected to garner significant business opportunities for the vendors during the forecast period.

Germany, France, UK, Italy, Spain, The Netherlands, US, Canada, Mexico, China, India, Japan, Indonesia, South Korea, Australia, Brazil, Argentina, Chile, Saudi Arabia, South Africa, UAE, Israel, Turkey

  • Growth in number of pubs, bars, hotels, and home bars is the driving factor this market.

The Decanter market vendors should focus on grabbing business opportunities from the Material segment as it accounted for the largest market share in the base year.