Dental Insurance Market Analysis, Size, and Forecast 2026-2030: North America (US, Canada, and Mexico), Europe (UK, Germany, and France), APAC (Japan, China, and Australia), South America (Brazil, Argentina, and Colombia), Middle East and Africa (Saudi Arabia, UAE, and South Africa), and Rest of World (ROW)

Dental Insurance Market Analysis, Size, and Forecast 2026-2030:
North America (US, Canada, and Mexico), Europe (UK, Germany, and France), APAC (Japan, China, and Australia), South America (Brazil, Argentina, and Colombia), Middle East and Africa (Saudi Arabia, UAE, and South Africa), and Rest of World (ROW)

Published: Jan 2026 297 Pages SKU: IRTNTR81241

Market Overview at a Glance

$138 B
Market Opportunity
9.5%
CAGR 2025 - 2030
49.6%
North America Growth
$120.7 B
DPPO segment 2024

Dental Insurance Market Size 2026-2030

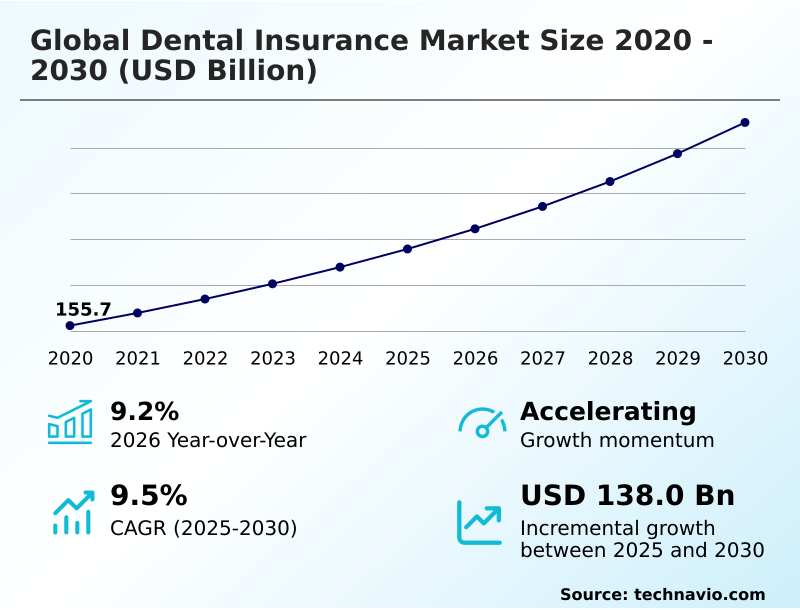
The dental insurance market size is valued to increase by USD 138 billion, at a CAGR of 9.5% from 2025 to 2030. Integration of oral and systemic healthcare models will drive the dental insurance market.

Major Market Trends & Insights

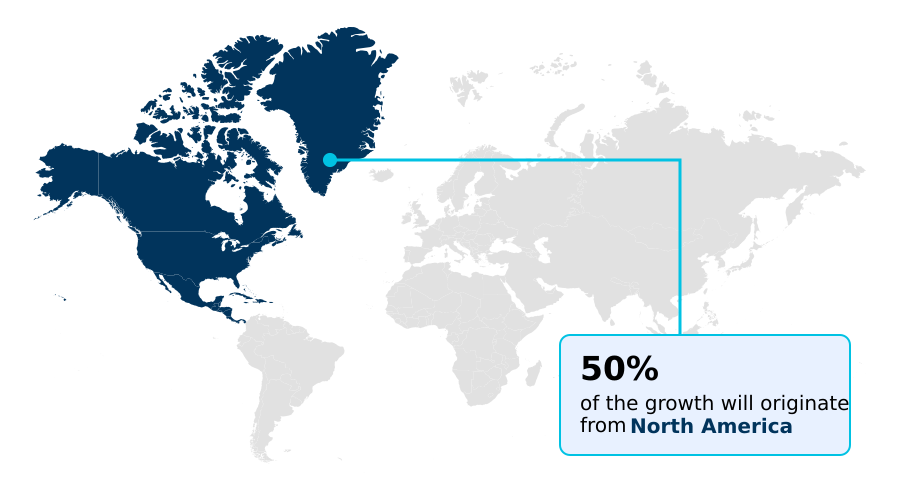
  • North America dominated the market and accounted for a 49.6% growth during the forecast period.
  • By Type - DPPO segment was valued at USD 120.7 billion in 2024
  • By Service Type - Basic segment accounted for the largest market revenue share in 2024

Market Size & Forecast

  • Market Opportunities: USD 221.6 billion
  • Market Future Opportunities: USD 138 billion
  • CAGR from 2025 to 2030 : 9.5%

Market Summary

  • The dental insurance market is undergoing a significant transformation, driven by a shift toward value-based care models and the integration of advanced digital technologies. Payers are moving beyond traditional reimbursement structures to prioritize preventive services and measurable patient outcomes, compelling investment in robust data analytics.
  • This evolution addresses the need for greater operational efficiency in provider network management and claims adjudication automation. For instance, a business scenario involves leveraging AI-powered utilization review to analyze treatment patterns, flagging potential over-treatment and reducing costs by over 15% without compromising care quality. This approach not only contains expenses but also strengthens payer-provider collaboration models.
  • Challenges remain, including navigating complex dental insurance regulatory compliance and addressing the dental workforce shortage impact, which strains network adequacy. However, the focus on teledentistry platforms and member engagement portals continues to enhance access and improve the policyholder experience, defining the industry's forward trajectory.

What will be the Size of the Dental Insurance Market during the forecast period?

Get Key Insights on Market Forecast (PDF) Request Free Sample

How is the Dental Insurance Market Segmented?

The dental insurance industry research report provides comprehensive data (region-wise segment analysis), with forecasts and estimates in "USD billion" for the period 2026-2030, as well as historical data from 2020-2024 for the following segments.
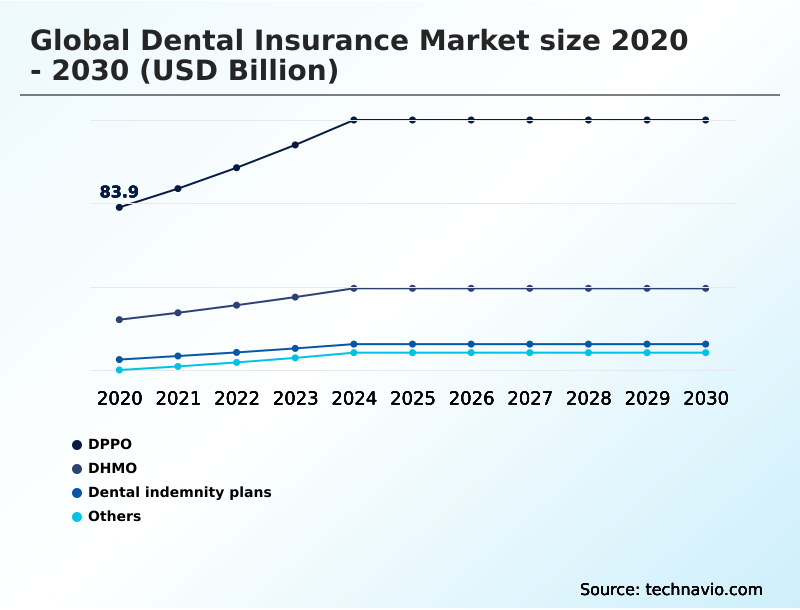
  • Type
    • DPPO
    • DHMO
    • Dental indemnity plans
    • Others
  • Service type
    • Basic
    • Preventive
    • Major
  • End-user
    • Corporates
    • Individuals
    • Families
  • Geography
    • North America
      • US
      • Canada
      • Mexico
    • Europe
      • UK
      • Germany
      • France
    • APAC
      • Japan
      • China
      • Australia
    • South America
      • Brazil
      • Argentina
      • Colombia
    • Middle East and Africa
      • Saudi Arabia
      • UAE
      • South Africa
    • Rest of World (ROW)

By Type Insights

The dppo segment is estimated to witness significant growth during the forecast period.

The global dental insurance market is segmented by plan types, with the Dental Preferred Provider Organization (DPPO) model representing a dominant structure.

This framework operates on a network-based system where carriers contract with a wide range of dental professionals to offer services at negotiated rates.

A core appeal of the DPPO is its flexibility, allowing policyholders to seek care from out-of-network providers, albeit with a different coinsurance structure. The design balances cost-containment for employers with the freedom of choice consumers demand.

This model is integral to corporate dental benefit design, especially for entities focused on provider network management and delivering value-based care models.

Effective claims adjudication automation and integrated dental-medical benefits are key to optimizing these plans and delivering effective orthodontic solutions and fee-for-service options within a Dental Health Maintenance Organization.

Request Free Sample

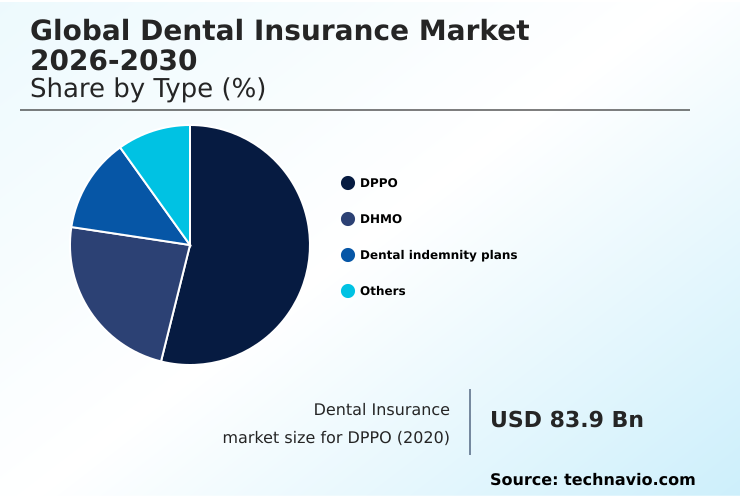
The DPPO segment was valued at USD 120.7 billion in 2024 and showed a gradual increase during the forecast period.

Request Free Sample

Regional Analysis

North America is estimated to contribute 49.6% to the growth of the global market during the forecast period.Technavio’s analysts have elaborately explained the regional trends and drivers that shape the market during the forecast period.

See How Dental Insurance Market Demand is Rising in North America Request Free Sample

The geographic landscape of the dental insurance market is diverse, with North America accounting for 49.6% of the opportunity, driven by mature employer-sponsored markets in the United States and Canada.

Europe follows with 25.2%, where statutory health systems in countries like Germany and France are increasingly supplemented by private plans. The APAC region is the fastest-growing frontier, fueled by rising incomes in China and India.

Key operational elements like prosthodontics coverage and periodontal disease management are universal, but their implementation varies. For instance, teledentistry platforms are crucial for expanding access in markets like Australia.

The adoption of specific orthodontic solutions, management of non-covered service fees, and navigating varied cybersecurity in dental insurance protocols define regional strategies. Moreover, dental insurance for seniors and effective dental insurance network optimization are global priorities shaped by local demographics.

Market Dynamics

Our researchers analyzed the data with 2025 as the base year, along with the key drivers, trends, and challenges. A holistic analysis of drivers will help companies refine their marketing strategies to gain a competitive advantage.

  • Navigating the dental insurance landscape requires a clear understanding of its intricate components. Consumers are constantly comparing DPPO and DHMO plans to find the best fit for their needs, while also learning how to use FSAs for dental procedures and managing dental benefits with HSAs.
  • A key concern is understanding your explanation of benefits and how to calculate out-of-pocket dental costs, which is often complicated by the dental insurance waiting period explained in policy documents. The rise of value-based care models in dentistry is changing how providers operate, with an increasing focus on medical necessity criteria for implants and negotiating reimbursement rates with payers.
  • Simultaneously, the impact of DSO consolidation on premiums is a major topic, as is how AI streamlines dental claims. For patients, knowing how to find the best dental insurance for orthodontic work and filing appeals for denied dental claims are critical skills.
  • The industry also faces internal and external pressures, including cybersecurity risks for dental payers and ongoing regulatory changes in dental insurance. These shifts affect everything from dental coverage in medicare advantage plans to the challenges of non-covered service fees and how medical loss ratio affects plans, creating a dynamic environment for both dental insurance options for retirees and corporate beneficiaries.
  • Data shows that individuals with insurance are more than twice as likely to seek preventive care, underscoring its role in promoting health.

What are the key market drivers leading to the rise in the adoption of Dental Insurance Industry?

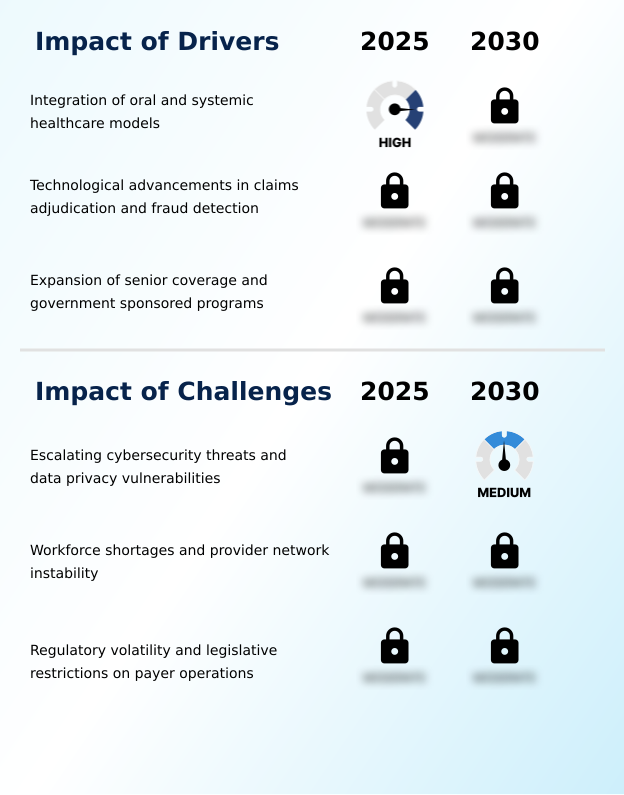
  • The integration of oral and systemic healthcare models is a key driver propelling market growth and reshaping benefit plan designs.

  • Market growth is propelled by the convergence of healthcare models and demographic shifts. The expansion of integrated dental-medical benefits is a primary driver, as evidence shows this approach improves outcomes for chronic conditions by over 15%.
  • This has led to a re-evaluation of value-based dental reimbursement structures and dental insurance premium calculation methodologies. A significant catalyst is the growing demand for dental insurance for seniors, largely through Medicare Advantage Plans that include supplemental dental insurance.
  • This demographic requires extensive prosthodontics coverage and periodontal disease management. The industry's response includes designing better self-funded dental administration options and enhancing cross-border dental coverage for retirees.
  • The ongoing payer-provider collaboration models are crucial for managing costs and ensuring the viability of these expanding benefit packages, addressing a critical need in an aging global population.

What are the market trends shaping the Dental Insurance Industry?

  • A significant market trend is the strategic integration of medical and oral health benefits, driven by the recognized link between oral health and systemic well-being.

  • Key trends are reshaping the dental insurance sector, with a pronounced shift toward digital integration and consumer-centric products. The adoption of health savings accounts and flexible spending accounts for dental care is growing, with users reporting up to 30% more control over their healthcare spending.
  • Insurers are focused on protected health information security and personally identifiable information privacy as they roll out teledentistry insurance coverage and member engagement portals. This digital shift is supported by the increasing use of automated claims review systems. Moreover, the formalization of dental implant insurance and cosmetic dentistry riders within plans addresses rising consumer demand.
  • In a significant regulatory development, at least two states have enacted laws governing AI in dental claims processing, setting a precedent for industry-wide compliance. This push for transparency and efficiency is also evident in the expansion of pediatric dental benefits and orthodontia coverage plans.

What challenges does the Dental Insurance Industry face during its growth?

  • Escalating cybersecurity threats and data privacy vulnerabilities present a key challenge affecting industry growth and operational stability.

  • The dental insurance market faces significant structural and operational challenges that constrain growth. A primary issue is the acute dental workforce shortage impact, with over 60% of dental practices reporting difficulties in hiring, which compromises network adequacy standards and leads to care delays.
  • This operational strain is compounded by escalating cybersecurity threats, as evidenced by a recent breach that exposed the data of 146,000 individuals, highlighting vulnerabilities in protecting PHI. Furthermore, navigating complex dental insurance regulatory compliance is a major hurdle. Payers must constantly adapt to new rules governing medical loss ratio and virtual credit card payments.
  • The industry's reliance on electronic health record integration and the need for a stringent utilization review process create additional complexities, alongside managing the coordination of benefits and the grievance and appeals process effectively.

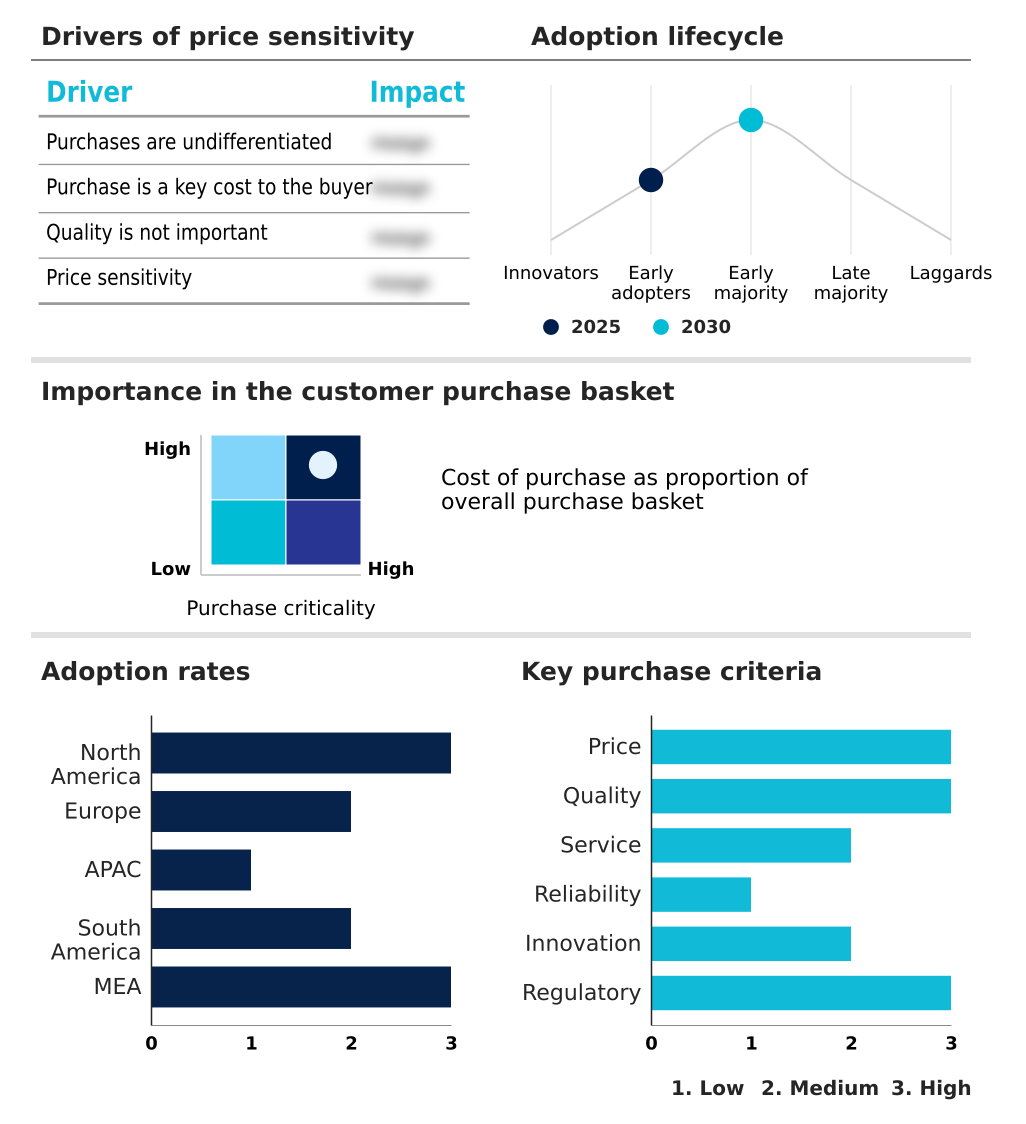
Exclusive Technavio Analysis on Customer Landscape

The dental insurance market forecasting report includes the adoption lifecycle of the market, covering from the innovator’s stage to the laggard’s stage. It focuses on adoption rates in different regions based on penetration. Furthermore, the dental insurance market report also includes key purchase criteria and drivers of price sensitivity to help companies evaluate and develop their market growth analysis strategies.

Customer Landscape of Dental Insurance Industry

Competitive Landscape

Companies are implementing various strategies, such as strategic alliances, dental insurance market forecast, partnerships, mergers and acquisitions, geographical expansion, and product/service launches, to enhance their presence in the industry.

Aetna Inc. - Offers PPO and DMO dental insurance plans featuring extensive provider networks for comprehensive cleanings, fillings, crowns, and orthodontic treatments.

The industry research and growth report includes detailed analyses of the competitive landscape of the market and information about key companies, including:

  • Aetna Inc.
  • AFLAC Inc.
  • Allianz SE
  • Ameritas Mutual Holding Co.
  • Anthem Inc.
  • AXA Health
  • Delta Dental Plans Association
  • HDFC ERGO General Insurance Co.
  • Humana Inc.
  • Metlife Inc.
  • Star Health and Allied Insurance
  • Sun Life Financial Inc.
  • The Cigna Group
  • The Guardian Life Insurance Co
  • United Concordia Companies Inc
  • United HealthCare Services Inc
  • Unum Group.
  • Zurich Insurance Co. Ltd.

Qualitative and quantitative analysis of companies has been conducted to help clients understand the wider business environment as well as the strengths and weaknesses of key industry players. Data is qualitatively analyzed to categorize companies as pure play, category-focused, industry-focused, and diversified; it is quantitatively analyzed to categorize companies as dominant, leading, strong, tentative, and weak.

Recent Development and News in Dental insurance market

  • In August 2025, Cigna Healthcare released its 2025 Dental Trends Report, highlighting the necessity of whole-person health and detailing how integrated medical, dental, and behavioral treatments improve overall health outcomes.
  • In October 2025, the states of Arizona and Maryland enacted legislation to regulate the use of artificial intelligence in insurance claim payment adjudication, establishing new legal boundaries for automated systems.
  • In November 2025, Delta Dental of Virginia disclosed a significant data security incident in which an employee email compromise led to the exposure of personal and health information for approximately 146,000 individuals.
  • In January 2025, the American Dental Association Health Policy Institute released a report indicating that over 60% of surveyed dentists identified staffing shortages as the most significant challenge facing their practices.

Dive into Technavio’s robust research methodology, blending expert interviews, extensive data synthesis, and validated models for unparalleled Dental Insurance Market insights. See full methodology.

Market Scope
Page number 297
Base year 2025
Historic period 2020-2024
Forecast period 2026-2030
Growth momentum & CAGR Accelerate at a CAGR of 9.5%
Market growth 2026-2030 USD 138.0 billion
Market structure Fragmented
YoY growth 2025-2026(%) 9.2%
Key countries US, Canada, Mexico, UK, Germany, France, Italy, Spain, The Netherlands, Japan, China, Australia, India, South Korea, Indonesia, Brazil, Argentina, Colombia, Saudi Arabia, UAE, South Africa, Israel and Turkey
Competitive landscape Leading Companies, Market Positioning of Companies, Competitive Strategies, and Industry Risks

Request Free Sample

Research Analyst Overview

  • The dental insurance market is defined by a complex interplay of risk management and operational efficiency. Core plan structures like the Dental Preferred Provider Organization and Dental Health Maintenance Organization are evolving through technology. The industry is focused on adverse selection mitigation by refining its group underwriting and coordination of benefits protocols.
  • A key boardroom-level decision area is the investment in claims adjudication automation and utilization review systems, which can reduce processing times by over 30%. This efficiency is critical for managing the high volume of transactions associated with capitation plans and direct reimbursement plans. Payers are also standardizing their pre-authorization process and explanation of benefits for clarity.
  • The management of usual, customary, and reasonable rates remains a central operational task, directly impacting profitability. Adherence to network adequacy standards and a transparent grievance and appeals process are essential for regulatory compliance and maintaining member trust. These operational mechanics are fundamental to delivering sustainable and competitive dental coverage.

What are the Key Data Covered in this Dental Insurance Market Research and Growth Report?

  • What is the expected growth of the Dental Insurance Market between 2026 and 2030?

    • USD 138 billion, at a CAGR of 9.5%

  • What segmentation does the market report cover?

    • The report is segmented by Type (DPPO, DHMO, Dental indemnity plans, and Others), Service Type (Basic, Preventive, and Major), End-user (Corporates, Individuals, and Families) and Geography (North America, Europe, APAC, South America, Middle East and Africa)

  • Which regions are analyzed in the report?

    • North America, Europe, APAC, South America and Middle East and Africa

  • What are the key growth drivers and market challenges?

    • Integration of oral and systemic healthcare models, Escalating cybersecurity threats and data privacy vulnerabilities

  • Who are the major players in the Dental Insurance Market?

    • Aetna Inc., AFLAC Inc., Allianz SE, Ameritas Mutual Holding Co., Anthem Inc., AXA Health, Delta Dental Plans Association, HDFC ERGO General Insurance Co., Humana Inc., Metlife Inc., Star Health and Allied Insurance, Sun Life Financial Inc., The Cigna Group, The Guardian Life Insurance Co, United Concordia Companies Inc, United HealthCare Services Inc, Unum Group. and Zurich Insurance Co. Ltd.

Market Research Insights

  • The dental insurance market dynamics are increasingly shaped by a focus on value and efficiency. Payers are adopting sophisticated dental insurance cost-sharing models to manage expenses, while corporate dental benefit design is evolving to attract and retain talent. A critical area of focus is the individual dental insurance marketplace, where consumer choice is paramount.
  • Statistics show that plans offering robust preventive care coverage mandates see up to 40% higher member retention compared to basic plans. Furthermore, the implementation of AI in dental claims processing has reduced adjudication errors by more than 25% for some carriers, demonstrating a clear return on investment.
  • The dental workforce shortage impact continues to be a concern, with over 60% of practices reporting recruitment challenges, which directly affects dental insurance network optimization and member access to timely care.

We can help! Our analysts can customize this dental insurance market research report to meet your requirements.

Get in touch

1. Executive Summary

1.1 Market overview

Executive Summary - Chart on Market Overview
Executive Summary - Data Table on Market Overview
Executive Summary - Chart on Global Market Characteristics
Executive Summary - Chart on Market by Geography
Executive Summary - Chart on Market Segmentation by Type
Executive Summary - Chart on Market Segmentation by Service Type
Executive Summary - Chart on Market Segmentation by End-user
Executive Summary - Chart on Incremental Growth
Executive Summary - Data Table on Incremental Growth
Executive Summary - Chart on Company Market Positioning

2. Technavio Analysis

2.1 Analysis of price sensitivity, lifecycle, customer purchase basket, adoption rates, and purchase criteria

2.2 Criticality of inputs and Factors of differentiation

Chart on Overview on criticality of inputs and factors of differentiation

2.3 Factors of disruption

Chart on Overview on factors of disruption

2.4 Impact of drivers and challenges

Chart on Impact of drivers and challenges in 2025 and 2030

3. Market Landscape

3.1 Market ecosystem

Chart on Parent Market
Data Table on - Parent Market

3.2 Market characteristics

Chart on Market characteristics analysis

3.3 Value chain analysis

Chart on Value chain analysis

4. Market Sizing

4.1 Market definition

Data Table on Offerings of companies included in the market definition

4.2 Market segment analysis

Market segments

4.3 Market size 2025

4.4 Market outlook: Forecast for 2025-2030

Chart on Global - Market size and forecast 2025-2030 ($ billion)
Data Table on Global - Market size and forecast 2025-2030 ($ billion)
Chart on Global Market: Year-over-year growth 2025-2030 (%)
Data Table on Global Market: Year-over-year growth 2025-2030 (%)

5. Historic Market Size

5.1 Global Dental Insurance Market 2020 - 2024

Historic Market Size - Data Table on Global Dental Insurance Market 2020 - 2024 ($ billion)

5.2 Type segment analysis 2020 - 2024

Historic Market Size - Type Segment 2020 - 2024 ($ billion)

5.3 Service Type segment analysis 2020 - 2024

Historic Market Size - Service Type Segment 2020 - 2024 ($ billion)

5.4 End-user segment analysis 2020 - 2024

Historic Market Size - End-user Segment 2020 - 2024 ($ billion)

5.5 Geography segment analysis 2020 - 2024

Historic Market Size - Geography Segment 2020 - 2024 ($ billion)

5.6 Country segment analysis 2020 - 2024

Historic Market Size - Country Segment 2020 - 2024 ($ billion)

6. Qualitative Analysis

6.1 The AI impact on global dental insurance market

7. Five Forces Analysis

7.1 Five forces summary

Five forces analysis - Comparison between 2025 and 2030

7.2 Bargaining power of buyers

Bargaining power of buyers - Impact of key factors 2025 and 2030

7.3 Bargaining power of suppliers

Bargaining power of suppliers - Impact of key factors in 2025 and 2030

7.4 Threat of new entrants

Threat of new entrants - Impact of key factors in 2025 and 2030

7.5 Threat of substitutes

Threat of substitutes - Impact of key factors in 2025 and 2030

7.6 Threat of rivalry

Threat of rivalry - Impact of key factors in 2025 and 2030

7.7 Market condition

Chart on Market condition - Five forces 2025 and 2030

8. Market Segmentation by Type

8.1 Market segments

Chart on Type - Market share 2025-2030 (%)
Data Table on Type - Market share 2025-2030 (%)

8.2 Comparison by Type

Chart on Comparison by Type
Data Table on Comparison by Type

8.3 DPPO - Market size and forecast 2025-2030

Chart on DPPO - Market size and forecast 2025-2030 ($ billion)
Data Table on DPPO - Market size and forecast 2025-2030 ($ billion)
Chart on DPPO - Year-over-year growth 2025-2030 (%)
Data Table on DPPO - Year-over-year growth 2025-2030 (%)

8.4 DHMO - Market size and forecast 2025-2030

Chart on DHMO - Market size and forecast 2025-2030 ($ billion)
Data Table on DHMO - Market size and forecast 2025-2030 ($ billion)
Chart on DHMO - Year-over-year growth 2025-2030 (%)
Data Table on DHMO - Year-over-year growth 2025-2030 (%)

8.5 Dental indemnity plans - Market size and forecast 2025-2030

Chart on Dental indemnity plans - Market size and forecast 2025-2030 ($ billion)
Data Table on Dental indemnity plans - Market size and forecast 2025-2030 ($ billion)
Chart on Dental indemnity plans - Year-over-year growth 2025-2030 (%)
Data Table on Dental indemnity plans - Year-over-year growth 2025-2030 (%)

8.6 Others - Market size and forecast 2025-2030

Chart on Others - Market size and forecast 2025-2030 ($ billion)
Data Table on Others - Market size and forecast 2025-2030 ($ billion)
Chart on Others - Year-over-year growth 2025-2030 (%)
Data Table on Others - Year-over-year growth 2025-2030 (%)

8.7 Market opportunity by Type

Market opportunity by Type ($ billion)
Data Table on Market opportunity by Type ($ billion)

9. Market Segmentation by Service Type

9.1 Market segments

Chart on Service Type - Market share 2025-2030 (%)
Data Table on Service Type - Market share 2025-2030 (%)

9.2 Comparison by Service Type

Chart on Comparison by Service Type
Data Table on Comparison by Service Type

9.3 Basic - Market size and forecast 2025-2030

Chart on Basic - Market size and forecast 2025-2030 ($ billion)
Data Table on Basic - Market size and forecast 2025-2030 ($ billion)
Chart on Basic - Year-over-year growth 2025-2030 (%)
Data Table on Basic - Year-over-year growth 2025-2030 (%)

9.4 Preventive - Market size and forecast 2025-2030

Chart on Preventive - Market size and forecast 2025-2030 ($ billion)
Data Table on Preventive - Market size and forecast 2025-2030 ($ billion)
Chart on Preventive - Year-over-year growth 2025-2030 (%)
Data Table on Preventive - Year-over-year growth 2025-2030 (%)

9.5 Major - Market size and forecast 2025-2030

Chart on Major - Market size and forecast 2025-2030 ($ billion)
Data Table on Major - Market size and forecast 2025-2030 ($ billion)
Chart on Major - Year-over-year growth 2025-2030 (%)
Data Table on Major - Year-over-year growth 2025-2030 (%)

9.6 Market opportunity by Service Type

Market opportunity by Service Type ($ billion)
Data Table on Market opportunity by Service Type ($ billion)

10. Market Segmentation by End-user

10.1 Market segments

Chart on End-user - Market share 2025-2030 (%)
Data Table on End-user - Market share 2025-2030 (%)

10.2 Comparison by End-user

Chart on Comparison by End-user
Data Table on Comparison by End-user

10.3 Corporates - Market size and forecast 2025-2030

Chart on Corporates - Market size and forecast 2025-2030 ($ billion)
Data Table on Corporates - Market size and forecast 2025-2030 ($ billion)
Chart on Corporates - Year-over-year growth 2025-2030 (%)
Data Table on Corporates - Year-over-year growth 2025-2030 (%)

10.4 Individuals - Market size and forecast 2025-2030

Chart on Individuals - Market size and forecast 2025-2030 ($ billion)
Data Table on Individuals - Market size and forecast 2025-2030 ($ billion)
Chart on Individuals - Year-over-year growth 2025-2030 (%)
Data Table on Individuals - Year-over-year growth 2025-2030 (%)

10.5 Families - Market size and forecast 2025-2030

Chart on Families - Market size and forecast 2025-2030 ($ billion)
Data Table on Families - Market size and forecast 2025-2030 ($ billion)
Chart on Families - Year-over-year growth 2025-2030 (%)
Data Table on Families - Year-over-year growth 2025-2030 (%)

10.6 Market opportunity by End-user

Market opportunity by End-user ($ billion)
Data Table on Market opportunity by End-user ($ billion)

11. Customer Landscape

11.1 Customer landscape overview

Analysis of price sensitivity, lifecycle, customer purchase basket, adoption rates, and purchase criteria

12. Geographic Landscape

12.1 Geographic segmentation

Chart on Market share by geography 2025-2030 (%)
Data Table on Market share by geography 2025-2030 (%)

12.2 Geographic comparison

Chart on Geographic comparison
Data Table on Geographic comparison

12.3 North America - Market size and forecast 2025-2030

Chart on North America - Market size and forecast 2025-2030 ($ billion)
Data Table on North America - Market size and forecast 2025-2030 ($ billion)
Chart on North America - Year-over-year growth 2025-2030 (%)
Data Table on North America - Year-over-year growth 2025-2030 (%)
Chart on Regional Comparison - North America
Data Table on Regional Comparison - North America

12.3.1 US - Market size and forecast 2025-2030

Chart on US - Market size and forecast 2025-2030 ($ billion)
Data Table on US - Market size and forecast 2025-2030 ($ billion)
Chart on US - Year-over-year growth 2025-2030 (%)
Data Table on US - Year-over-year growth 2025-2030 (%)

12.3.2 Canada - Market size and forecast 2025-2030

Chart on Canada - Market size and forecast 2025-2030 ($ billion)
Data Table on Canada - Market size and forecast 2025-2030 ($ billion)
Chart on Canada - Year-over-year growth 2025-2030 (%)
Data Table on Canada - Year-over-year growth 2025-2030 (%)

12.3.3 Mexico - Market size and forecast 2025-2030

Chart on Mexico - Market size and forecast 2025-2030 ($ billion)
Data Table on Mexico - Market size and forecast 2025-2030 ($ billion)
Chart on Mexico - Year-over-year growth 2025-2030 (%)
Data Table on Mexico - Year-over-year growth 2025-2030 (%)

12.4 Europe - Market size and forecast 2025-2030

Chart on Europe - Market size and forecast 2025-2030 ($ billion)
Data Table on Europe - Market size and forecast 2025-2030 ($ billion)
Chart on Europe - Year-over-year growth 2025-2030 (%)
Data Table on Europe - Year-over-year growth 2025-2030 (%)
Chart on Regional Comparison - Europe
Data Table on Regional Comparison - Europe

12.4.1 UK - Market size and forecast 2025-2030

Chart on UK - Market size and forecast 2025-2030 ($ billion)
Data Table on UK - Market size and forecast 2025-2030 ($ billion)
Chart on UK - Year-over-year growth 2025-2030 (%)
Data Table on UK - Year-over-year growth 2025-2030 (%)

12.4.2 Germany - Market size and forecast 2025-2030

Chart on Germany - Market size and forecast 2025-2030 ($ billion)
Data Table on Germany - Market size and forecast 2025-2030 ($ billion)
Chart on Germany - Year-over-year growth 2025-2030 (%)
Data Table on Germany - Year-over-year growth 2025-2030 (%)

12.4.3 France - Market size and forecast 2025-2030

Chart on France - Market size and forecast 2025-2030 ($ billion)
Data Table on France - Market size and forecast 2025-2030 ($ billion)
Chart on France - Year-over-year growth 2025-2030 (%)
Data Table on France - Year-over-year growth 2025-2030 (%)

12.4.4 Italy - Market size and forecast 2025-2030

Chart on Italy - Market size and forecast 2025-2030 ($ billion)
Data Table on Italy - Market size and forecast 2025-2030 ($ billion)
Chart on Italy - Year-over-year growth 2025-2030 (%)
Data Table on Italy - Year-over-year growth 2025-2030 (%)

12.4.5 Spain - Market size and forecast 2025-2030

Chart on Spain - Market size and forecast 2025-2030 ($ billion)
Data Table on Spain - Market size and forecast 2025-2030 ($ billion)
Chart on Spain - Year-over-year growth 2025-2030 (%)
Data Table on Spain - Year-over-year growth 2025-2030 (%)

12.4.6 The Netherlands - Market size and forecast 2025-2030

Chart on The Netherlands - Market size and forecast 2025-2030 ($ billion)
Data Table on The Netherlands - Market size and forecast 2025-2030 ($ billion)
Chart on The Netherlands - Year-over-year growth 2025-2030 (%)
Data Table on The Netherlands - Year-over-year growth 2025-2030 (%)

12.5 APAC - Market size and forecast 2025-2030

Chart on APAC - Market size and forecast 2025-2030 ($ billion)
Data Table on APAC - Market size and forecast 2025-2030 ($ billion)
Chart on APAC - Year-over-year growth 2025-2030 (%)
Data Table on APAC - Year-over-year growth 2025-2030 (%)
Chart on Regional Comparison - APAC
Data Table on Regional Comparison - APAC

12.5.1 Japan - Market size and forecast 2025-2030

Chart on Japan - Market size and forecast 2025-2030 ($ billion)
Data Table on Japan - Market size and forecast 2025-2030 ($ billion)
Chart on Japan - Year-over-year growth 2025-2030 (%)
Data Table on Japan - Year-over-year growth 2025-2030 (%)

12.5.2 China - Market size and forecast 2025-2030

Chart on China - Market size and forecast 2025-2030 ($ billion)
Data Table on China - Market size and forecast 2025-2030 ($ billion)
Chart on China - Year-over-year growth 2025-2030 (%)
Data Table on China - Year-over-year growth 2025-2030 (%)

12.5.3 Australia - Market size and forecast 2025-2030

Chart on Australia - Market size and forecast 2025-2030 ($ billion)
Data Table on Australia - Market size and forecast 2025-2030 ($ billion)
Chart on Australia - Year-over-year growth 2025-2030 (%)
Data Table on Australia - Year-over-year growth 2025-2030 (%)

12.5.4 India - Market size and forecast 2025-2030

Chart on India - Market size and forecast 2025-2030 ($ billion)
Data Table on India - Market size and forecast 2025-2030 ($ billion)
Chart on India - Year-over-year growth 2025-2030 (%)
Data Table on India - Year-over-year growth 2025-2030 (%)

12.5.5 South Korea - Market size and forecast 2025-2030

Chart on South Korea - Market size and forecast 2025-2030 ($ billion)
Data Table on South Korea - Market size and forecast 2025-2030 ($ billion)
Chart on South Korea - Year-over-year growth 2025-2030 (%)
Data Table on South Korea - Year-over-year growth 2025-2030 (%)

12.5.6 Indonesia - Market size and forecast 2025-2030

Chart on Indonesia - Market size and forecast 2025-2030 ($ billion)
Data Table on Indonesia - Market size and forecast 2025-2030 ($ billion)
Chart on Indonesia - Year-over-year growth 2025-2030 (%)
Data Table on Indonesia - Year-over-year growth 2025-2030 (%)

12.6 South America - Market size and forecast 2025-2030

Chart on South America - Market size and forecast 2025-2030 ($ billion)
Data Table on South America - Market size and forecast 2025-2030 ($ billion)
Chart on South America - Year-over-year growth 2025-2030 (%)
Data Table on South America - Year-over-year growth 2025-2030 (%)
Chart on Regional Comparison - South America
Data Table on Regional Comparison - South America

12.6.1 Brazil - Market size and forecast 2025-2030

Chart on Brazil - Market size and forecast 2025-2030 ($ billion)
Data Table on Brazil - Market size and forecast 2025-2030 ($ billion)
Chart on Brazil - Year-over-year growth 2025-2030 (%)
Data Table on Brazil - Year-over-year growth 2025-2030 (%)

12.6.2 Argentina - Market size and forecast 2025-2030

Chart on Argentina - Market size and forecast 2025-2030 ($ billion)
Data Table on Argentina - Market size and forecast 2025-2030 ($ billion)
Chart on Argentina - Year-over-year growth 2025-2030 (%)
Data Table on Argentina - Year-over-year growth 2025-2030 (%)

12.6.3 Colombia - Market size and forecast 2025-2030

Chart on Colombia - Market size and forecast 2025-2030 ($ billion)
Data Table on Colombia - Market size and forecast 2025-2030 ($ billion)
Chart on Colombia - Year-over-year growth 2025-2030 (%)
Data Table on Colombia - Year-over-year growth 2025-2030 (%)

12.7 Middle East and Africa - Market size and forecast 2025-2030

Chart on Middle East and Africa - Market size and forecast 2025-2030 ($ billion)
Data Table on Middle East and Africa - Market size and forecast 2025-2030 ($ billion)
Chart on Middle East and Africa - Year-over-year growth 2025-2030 (%)
Data Table on Middle East and Africa - Year-over-year growth 2025-2030 (%)
Chart on Regional Comparison - Middle East and Africa
Data Table on Regional Comparison - Middle East and Africa

12.7.1 Saudi Arabia - Market size and forecast 2025-2030

Chart on Saudi Arabia - Market size and forecast 2025-2030 ($ billion)
Data Table on Saudi Arabia - Market size and forecast 2025-2030 ($ billion)
Chart on Saudi Arabia - Year-over-year growth 2025-2030 (%)
Data Table on Saudi Arabia - Year-over-year growth 2025-2030 (%)

12.7.2 UAE - Market size and forecast 2025-2030

Chart on UAE - Market size and forecast 2025-2030 ($ billion)
Data Table on UAE - Market size and forecast 2025-2030 ($ billion)
Chart on UAE - Year-over-year growth 2025-2030 (%)
Data Table on UAE - Year-over-year growth 2025-2030 (%)

12.7.3 South Africa - Market size and forecast 2025-2030

Chart on South Africa - Market size and forecast 2025-2030 ($ billion)
Data Table on South Africa - Market size and forecast 2025-2030 ($ billion)
Chart on South Africa - Year-over-year growth 2025-2030 (%)
Data Table on South Africa - Year-over-year growth 2025-2030 (%)

12.7.4 Israel - Market size and forecast 2025-2030

Chart on Israel - Market size and forecast 2025-2030 ($ billion)
Data Table on Israel - Market size and forecast 2025-2030 ($ billion)
Chart on Israel - Year-over-year growth 2025-2030 (%)
Data Table on Israel - Year-over-year growth 2025-2030 (%)

12.7.5 Turkey - Market size and forecast 2025-2030

Chart on Turkey - Market size and forecast 2025-2030 ($ billion)
Data Table on Turkey - Market size and forecast 2025-2030 ($ billion)
Chart on Turkey - Year-over-year growth 2025-2030 (%)
Data Table on Turkey - Year-over-year growth 2025-2030 (%)

12.8 Market opportunity by geography

Market opportunity by geography ($ billion)
Data Tables on Market opportunity by geography ($ billion)

13. Drivers, Challenges, and Opportunity

13.1 Market drivers

Integration of oral and systemic healthcare models
Technological advancements in claims adjudication and fraud detection
Expansion of senior coverage and government sponsored programs

13.2 Market challenges

Escalating cybersecurity threats and data privacy vulnerabilities
Workforce shortages and provider network instability
Regulatory volatility and legislative restrictions on payer operations

13.3 Impact of drivers and challenges

Impact of drivers and challenges in 2025 and 2030

13.4 Market opportunities

Strategic integration of medical and oral health benefits
Formalized governance of AI in claims adjudication
Expansion of preventive-centric and wellness-based plan designs

14. Competitive Landscape

14.1 Overview

14.2

Overview on criticality of inputs and factors of differentiation

14.3 Landscape disruption

Overview on factors of disruption

14.4 Industry risks

Impact of key risks on business

15. Competitive Analysis

15.1 Companies profiled

Companies covered

15.2 Company ranking index

15.3 Market positioning of companies

Matrix on companies position and classification

15.4 Aetna Inc.

Aetna Inc. - Overview
Aetna Inc. - Product / Service
Aetna Inc. - Key offerings
SWOT

15.5 AFLAC Inc.

AFLAC Inc. - Overview
AFLAC Inc. - Business segments
AFLAC Inc. - Key offerings
AFLAC Inc. - Segment focus
SWOT

15.6 Allianz SE

Allianz SE - Overview
Allianz SE - Business segments
Allianz SE - Key news
Allianz SE - Key offerings
Allianz SE - Segment focus
SWOT

15.7 Anthem Inc.

Anthem Inc. - Overview
Anthem Inc. - Business segments
Anthem Inc. - Key offerings
Anthem Inc. - Segment focus
SWOT

15.8 AXA Health

AXA Health - Overview
AXA Health - Product / Service
AXA Health - Key offerings
SWOT

15.9 Delta Dental Plans Association

Delta Dental Plans Association - Overview
Delta Dental Plans Association - Product / Service
Delta Dental Plans Association - Key offerings
SWOT

15.10 HDFC ERGO General Insurance Co.

HDFC ERGO General Insurance Co. - Overview
HDFC ERGO General Insurance Co. - Product / Service
HDFC ERGO General Insurance Co. - Key offerings
SWOT

15.11 Humana Inc.

Humana Inc. - Overview
Humana Inc. - Business segments
Humana Inc. - Key offerings
Humana Inc. - Segment focus
SWOT

15.12 Metlife Inc.

Metlife Inc. - Overview
Metlife Inc. - Business segments
Metlife Inc. - Key offerings
Metlife Inc. - Segment focus
SWOT

15.13 Sun Life Financial Inc.

Sun Life Financial Inc. - Overview
Sun Life Financial Inc. - Business segments
Sun Life Financial Inc. - Key offerings
Sun Life Financial Inc. - Segment focus
SWOT

15.14 The Cigna Group

The Cigna Group - Overview
The Cigna Group - Product / Service
The Cigna Group - Key offerings
SWOT

15.15 The Guardian Life Insurance Co

The Guardian Life Insurance Co - Overview
The Guardian Life Insurance Co - Product / Service
The Guardian Life Insurance Co - Key offerings
SWOT

15.16 United Concordia Companies Inc

United Concordia Companies Inc - Overview
United Concordia Companies Inc - Product / Service
United Concordia Companies Inc - Key offerings
SWOT

15.17 United HealthCare Services Inc

United HealthCare Services Inc - Overview
United HealthCare Services Inc - Business segments
United HealthCare Services Inc - Key offerings
United HealthCare Services Inc - Segment focus
SWOT

15.18 Unum Group.

Unum Group. - Overview
Unum Group. - Product / Service
Unum Group. - Key offerings
SWOT

16. Appendix

16.1 Scope of the report

Market definition
Objectives
Notes and caveats

16.2 Inclusions and exclusions checklist

Inclusions checklist
Exclusions checklist

16.3 Currency conversion rates for US$

16.4 Research methodology

16.5 Data procurement

Information sources

16.6 Data validation

16.7 Validation techniques employed for market sizing

16.8 Data synthesis

16.9 360 degree market analysis

16.10 List of abbreviations

Research Methodology

Technavio presents a detailed picture of the market by way of study, synthesis, and summation of data from multiple sources. The analysts have presented the various facets of the market with a particular focus on identifying the key industry influencers. The data thus presented is comprehensive, reliable, and the result of extensive research, both primary and secondary.

INFORMATION SOURCES

Primary sources

  • Manufacturers and suppliers
  • Channel partners
  • Industry experts
  • Strategic decision makers

Secondary sources

  • Industry journals and periodicals
  • Government data
  • Financial reports of key industry players
  • Historical data
  • Press releases

DATA ANALYSIS

Data Synthesis

  • Collation of data
  • Estimation of key figures
  • Analysis of derived insights

Data Validation

  • Triangulation with data models
  • Reference against proprietary databases
  • Corroboration with industry experts

REPORT WRITING

Qualitative

  • Market drivers
  • Market challenges
  • Market trends
  • Five forces analysis

Quantitative

  • Market size and forecast
  • Market segmentation
  • Geographical insights
  • Competitive landscape

Interested in this report?

Get your sample now to see our research methodology and insights!

Download Now

Frequently Asked Questions

Dental Insurance market growth will increase by USD 138.0 billion during 2026-2030 .

The Dental Insurance market is expected to grow at a CAGR of 9.5% during 2026-2030 .

Dental Insurance market is segmented by Type (DPPO, DHMO, Dental indemnity plans, Others) Service type (Basic, Preventive, Major) End-user (Corporates, Individuals, Families)

Aetna Inc., AFLAC Inc., Allianz SE, Ameritas Mutual Holding Co., Anthem Inc., AXA Health, Delta Dental Plans Association, HDFC ERGO General Insurance Co., Humana Inc., Metlife Inc., Star Health and Allied Insurance, Sun Life Financial Inc., The Cigna Group, The Guardian Life Insurance Co, United Concordia Companies Inc, United HealthCare Services Inc, Unum Group., Zurich Insurance Co. Ltd. are a few of the key vendors in the Dental Insurance market.

North America will register the highest growth rate of 49.6% among the other regions. Therefore, the Dental Insurance market in North America is expected to garner significant business opportunities for the vendors during the forecast period.

US, Canada, Mexico, UK, Germany, France, Italy, Spain, The Netherlands, Japan, China, Australia, India, South Korea, Indonesia, Brazil, Argentina, Colombia, Saudi Arabia, UAE, South Africa, Israel, Turkey

  • Integration of oral and systemic healthcare models is the driving factor this market.

The Dental Insurance market vendors should focus on grabbing business opportunities from the Type segment as it accounted for the largest market share in the base year.