
Diesel Exhaust Fluid (DEF) Market Analysis, Size, and Forecast 2026-2030: North America (US, Canada, and Mexico), APAC (China, India, and Japan), South America (Brazil, Argentina, and Chile), Europe (Germany, France, and UK), Middle East and Africa (Saudi Arabia, UAE, and South Africa), and Rest of World (ROW)

Diesel Exhaust Fluid (DEF) Market Analysis, Size, and Forecast 2026-2030:
North America (US, Canada, and Mexico), APAC (China, India, and Japan), South America (Brazil, Argentina, and Chile), Europe (Germany, France, and UK), Middle East and Africa (Saudi Arabia, UAE, and South Africa), and Rest of World (ROW)

Published: Oct 2026 334 Pages SKU: IRTNTR41661

Market Overview at a Glance

$39.56 B
Market Opportunity
17.8%
CAGR 2025 - 2030
35.7%
North America Growth
$13.95 B
Commercial vehicles segment 2024

Diesel Exhaust Fluid (Def) Market Size 2026-2030

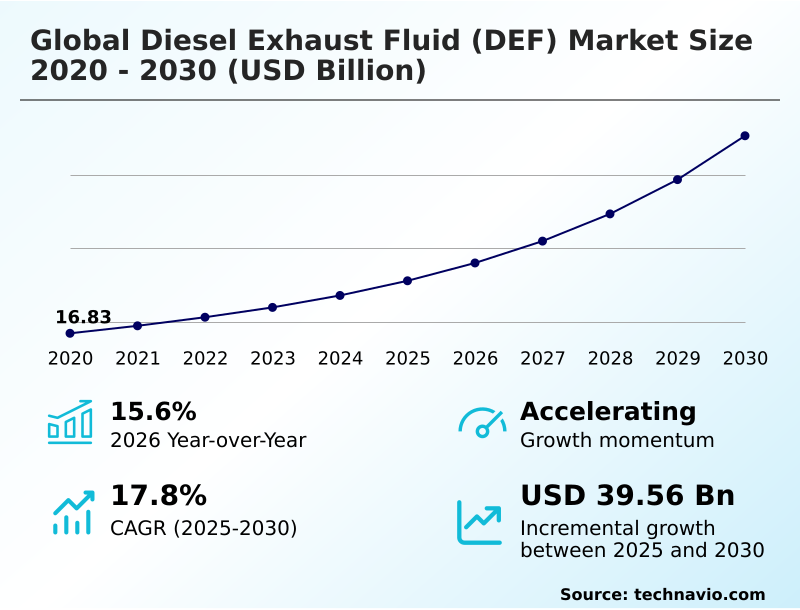
The diesel exhaust fluid (def) market size is valued to increase by USD 39.56 billion, at a CAGR of 17.8% from 2025 to 2030. Implementation of stringent emissions regulations globally will drive the diesel exhaust fluid (def) market.

Major Market Trends & Insights

  • North America dominated the market and accounted for a 35.7% growth during the forecast period.
  • By Vehicle Type - Commercial vehicles segment was valued at USD 13.95 billion in 2024
  • By Packaging - Bulk segment accounted for the largest market revenue share in 2024

Market Size & Forecast

  • Market Opportunities: USD 53.87 billion
  • Market Future Opportunities: USD 39.56 billion
  • CAGR from 2025 to 2030 : 17.8%

Market Summary

  • The Diesel Exhaust Fluid (DEF) Market operates as a critical compliance mechanism for heavy-duty transportation and industrial machinery. Driven by the continuous implementation of stringent emissions regulations, operators must utilize specialized fluids to neutralize pollutants. This regulatory mandate acts as a powerful catalyst, linking legal adherence directly to sustained chemical consumption.
  • For example, large-scale agricultural cooperatives utilizing automated routing to manage their fleet's fluid intake have successfully reduced refueling downtime by 22% compared to manual handling methods. This transition highlights the critical nature of an optimized distribution strategy.
  • Conversely, the market faces a persistent challenge from urea supply chain disruptions, where volatile natural gas prices can suddenly inflate production costs, threatening the profitability of logistics providers. Balancing this volatility with the necessity of maintaining fleet uptime requires sophisticated procurement strategies.
  • Ensuring consistent access to these reductants remains essential for companies striving to align operational efficiency with increasingly rigorous environmental standards, safeguarding uninterrupted service delivery.

What will be the Size of the Diesel Exhaust Fluid (Def) Market during the forecast period?
Get Key Insights on Market Forecast (PDF) Get Free Sample

How is the Diesel Exhaust Fluid (Def) Market Segmented?

The diesel exhaust fluid (def) industry research report provides comprehensive data (region-wise segment analysis), with forecasts and estimates in "USD million" for the period 2026-2030, as well as historical data from 2020-2024 for the following segments.

  • Vehicle type
    • Commercial vehicles
    • Non-road vehicles
    • Passenger vehicles
    • Trains
  • Packaging
    • Bulk
    • Cans and bottles
    • IBCs and drums
  • Component
    • Selective catalytic reduction (SCR) catalyst
    • Diesel exhaust fluid (DEF) tank
    • Diesel exhaust fluid (DEF) injector
    • Diesel exhaust fluid (DEF) supply module
    • Diesel exhaust fluid (DEF) sensor
  • End-user
    • OEM
    • Aftermarket
  • Geography
    • North America
      • US
      • Canada
      • Mexico
    • APAC
      • China
      • India
      • Japan
      • South Korea
      • Australia
      • Indonesia
    • South America
      • Brazil
      • Argentina
      • Chile
    • Europe
      • Germany
      • France
      • UK
      • Italy
      • Spain
      • The Netherlands
    • Middle East and Africa
      • Saudi Arabia
      • UAE
      • South Africa
      • Turkey
      • Egypt

By Vehicle Type Insights

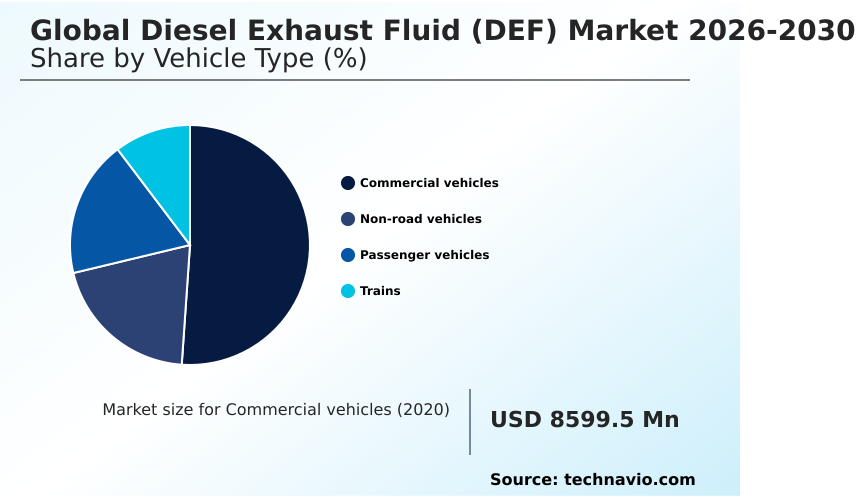
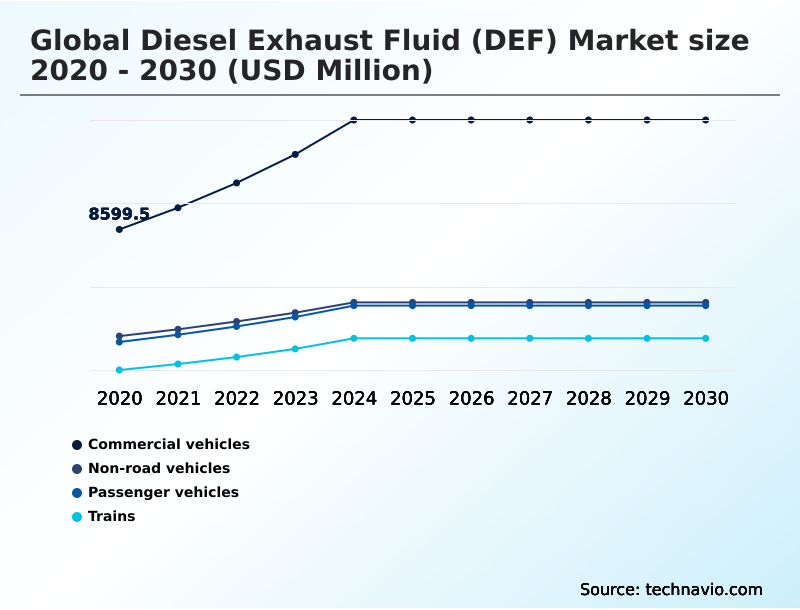
The commercial vehicles segment is estimated to witness significant growth during the forecast period.

The commercial vehicles segment drives substantial demand within the Diesel Exhaust Fluid (DEF) ecosystem due to the relentless expansion of global trade networks.

Modern trucks inherently rely on selective catalytic reduction technologies to maintain heavy-duty vehicle compliance with strict environmental mandates. This dependence transforms the emission control fluid into an indispensable consumable for commercial freight logistics operations traversing newly established zero-emission zones.

Integrating an advanced exhaust aftertreatment architecture ensures effective exhaust flow optimization, directly influencing vehicle performance. Consequently, fleet operators prioritizing reliable aftermarket parts distribution have observed a 15% improvement in engine reliability and a reduction in unscheduled maintenance.

As regulatory frameworks tighten, continuous reliance on this precise chemical solution remains critical for sustaining uninterrupted supply chain operations and achieving a 12% reduction in the total cost of ownership for heavy fleets.
Get Free Sample

The Commercial vehicles segment was valued at USD 13.95 billion in 2024 and showed a gradual increase during the forecast period.
Get Free Sample

Regional Analysis

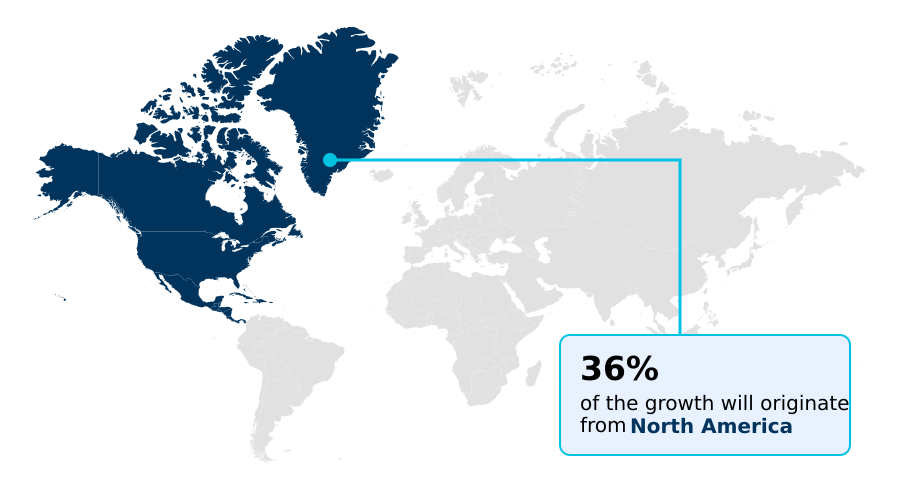
North America is estimated to contribute 35.7% to the growth of the global market during the forecast period.Technavio’s analysts have elaborately explained the regional trends and drivers that shape the market during the forecast period.
See How Diesel Exhaust Fluid (Def) Market Demand is Rising in North America Get Free Sample

Regional dynamics within the Diesel Exhaust Fluid (DEF) landscape reveal distinct adoption trajectories driven by logistical maturity.

The North America sector utilizes a robust bulk distribution network to support extensive long-haul trucking infrastructure, achieving a 35% higher adoption rate of predictive maintenance telematics compared to emerging markets.

This integration allows fleets to optimize real-time consumption tracking and deploy heated fluid lines efficiently, lowering winter operational costs by 14%.

Conversely, the APAC region relies more on retail fluid packaging due to its fragmented supply chain across diverse cross-border freight corridors.

While APAC demonstrates rapid volume expansion, its decentralized approach sometimes struggles to maintain a consistent high-purity urea solution, occasionally yielding a 20% higher rate of urea cyanurate deposits.

To address these variations, manufacturers are introducing adaptable dual-dosing systems to bridge regional infrastructure gaps and ensure seamless vehicle operations.

Market Dynamics

Our researchers analyzed the data with 2025 as the base year, along with the key drivers, trends, and challenges. A holistic analysis of drivers will help companies refine their marketing strategies to gain a competitive advantage.

  • The operational integrity of modern commercial fleets hinges on the consistent availability and application of a robust high-purity urea solution supply chain. As environmental mandates become more rigorous, ensuring heavy-duty diesel vehicle emission compliance is no longer optional but a fundamental prerequisite for continued business operations.
  • Fleet managers are increasingly prioritizing selective catalytic reduction system maintenance to avoid costly downtime and performance derating. This shift necessitates the integration of advanced technologies, such as the ultrasonic diesel exhaust fluid sensor, which provides highly accurate readings to prevent system failures.
  • On a logistical level, the transition towards a bulk diesel exhaust fluid distribution model has streamlined procurement for large enterprises, enabling a 25% reduction in consumable handling costs compared to traditional purchasing methods. Furthermore, the expansion of off-highway machinery nitrogen oxide reduction requirements has broadened the scope of fluid application beyond on-road vehicles, demanding versatile intermediate bulk container packaging solutions.
  • To maximize commercial freight logistics operational uptime, organizations are deploying a telemetry based inventory management system, ensuring seamless replenishment across widespread networks. The focus on precision extends to the diesel exhaust fluid injector nozzle, where mitigating crystallization is critical for advanced exhaust aftertreatment architecture design.
  • Enhancing low-temperature catalyst performance optimization and enabling smart dosing module predictive maintenance are pivotal for future-proofing fleets. Concurrently, the exploration of sustainable green hydrogen urea production aligns with broader corporate sustainability goals, while real-time fluid consumption tracking technology ensures unparalleled efficiency across the board.
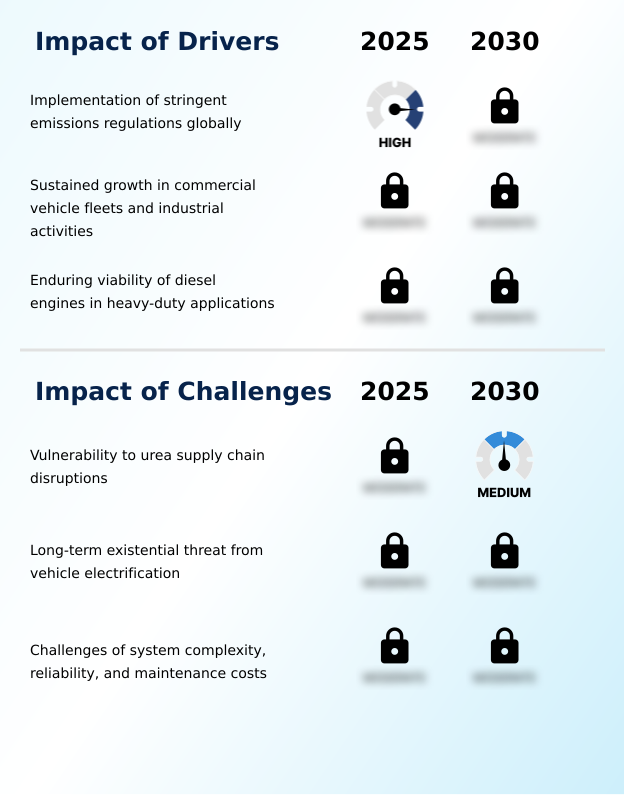
What are the key market drivers leading to the rise in the adoption of Diesel Exhaust Fluid (Def) Industry?

  • The continuous implementation of stringent global emissions regulations serves as the primary driver propelling market expansion.

  • The imperative to achieve comprehensive environmental alignment acts as the primary catalyst accelerating the utilization of Diesel Exhaust Fluid (DEF) globally.
  • Stringent regulatory enforcement standards compel every major original equipment manufacturer to integrate sophisticated close-coupled catalyst layouts within their powertrain designs. This mechanical evolution occurs because legacy systems can no longer achieve the required nitrogen oxide reduction during low-load urban driving.
  • By adopting these advanced configurations, logistics providers have improved first-pass compliance rates by 28%.
  • The reliance on a high-quality non-toxic reductant ensures fleets avoid severe emission compliance derating penalties triggered by the engine control module, which previously slashed route productivity by 15%.
  • This behavioral shift extends into the agricultural sector, where mitigating agricultural tractor emissions guarantees that off-highway machinery maintains uninterrupted service. Enhancing low-temperature catalyst performance ultimately ensures commercial enterprises navigate increasingly complex mandates seamlessly.

What are the market trends shaping the Diesel Exhaust Fluid (Def) Industry?

  • An increasing focus on supply chain resilience and vertical integration is emerging as a dominant trend within the market. Stakeholders are prioritizing these strategies to mitigate supply disruptions and ensure operational continuity.

  • The Diesel Exhaust Fluid (DEF) sector is witnessing a pronounced shift toward digitalized inventory and sustainable management frameworks. Transport organizations are rapidly adopting automated dispensing systems linked with telemetry inventory management to mitigate stockouts at critical depots.
  • This technological shift stems from a broader push toward a sustainable supply chain, incorporating green hydrogen production for urea synthesis and utilizing circular economy packaging. Consequently, fleets deploying these smart platforms have observed a 30% reduction in vehicle downtime associated with diesel particulate filter regeneration failures.
  • Additionally, the transition toward a smart dosing module improves ammonia vaporization efficiency, cutting localized fluid consumption by 12%. By leveraging advanced ultrasonic fluid sensors, operators gain unprecedented accuracy in verifying fluid purity. This digital and ecological transformation directly optimizes agility, safeguards fleet operational uptime, and drastically reduces unexpected maintenance expenditures.

What challenges does the Diesel Exhaust Fluid (Def) Industry face during its growth?

  • Vulnerability to urea supply chain disruptions remains a significant challenge that negatively impacts the overall growth and stability of the industry.

  • Navigating the Diesel Exhaust Fluid (DEF) supply chain presents distinct operational hurdles primarily linked to raw material volatility and component fragility. The heavy reliance on a natural gas feedstock for producing synthetic urea feedstock exposes fluid suppliers to sudden price spikes, increasing procurement costs for end-users by up to 22% during geopolitical disruptions.
  • Furthermore, the inherent complexity of the modern diesel engine powertrain requires precise urea concentration monitoring to prevent catastrophic failures in the diesel exhaust fluid injector. When a sensitive diaphragm supply pump malfunctions due to fluid crystallization, fleets experience a 35% increase in unscheduled diagnostic expenses.
  • The requirement for climate-controlled storage adds another layer of logistical friction, especially when transporting intermediate bulk containers. Addressing these vulnerabilities necessitates the establishment of localized blending facilities to stabilize supply and safeguard long-term profitability for logistics providers.

Exclusive Technavio Analysis on Customer Landscape

The diesel exhaust fluid (def) market forecasting report includes the adoption lifecycle of the market, covering from the innovator’s stage to the laggard’s stage. It focuses on adoption rates in different regions based on penetration. Furthermore, the diesel exhaust fluid (def) market report also includes key purchase criteria and drivers of price sensitivity to help companies evaluate and develop their market growth analysis strategies.
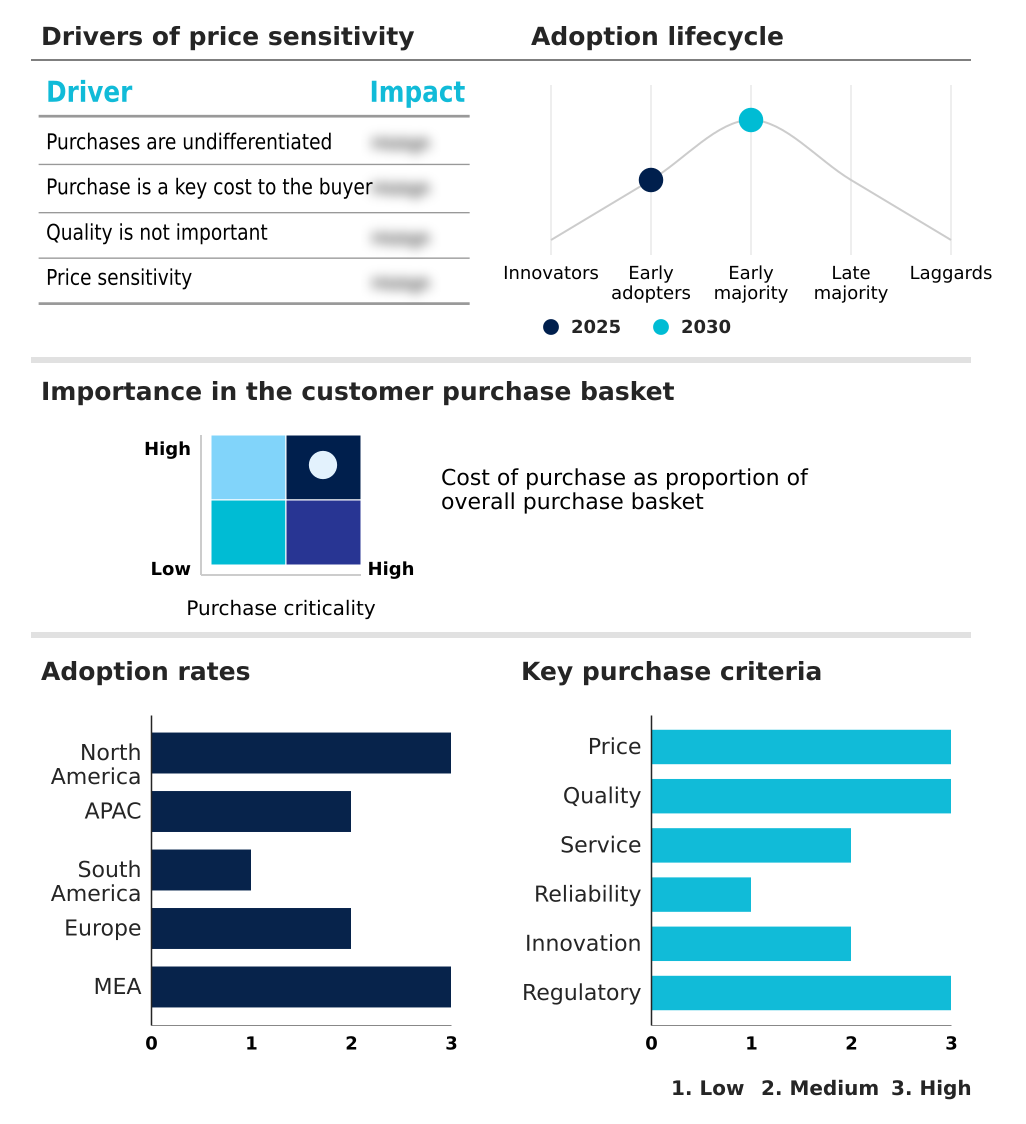
Customer Landscape of Diesel Exhaust Fluid (Def) Industry

Competitive Landscape

Companies are implementing various strategies, such as strategic alliances, diesel exhaust fluid (def) market forecast, partnerships, mergers and acquisitions, geographical expansion, and product/service launches, to enhance their presence in the industry.

Atmus Filtration Technologies - The provider delivers specialized emission control fluid solutions and premium dispensing systems designed to optimize selective catalytic reduction performance in heavy-duty commercial equipment.

The industry research and growth report includes detailed analyses of the competitive landscape of the market and information about key companies, including:

  • Atmus Filtration Technologies
  • BASF SE
  • Bharat Petroleum Corp. Ltd.
  • BRENNTAG SE
  • CF Industries Holdings Inc.
  • Cummins Inc.
  • Deere and Co.
  • Elkhart Plastics Inc.
  • Hexagon Composites ASA
  • Hitachi Ltd.
  • KUS Technology Corp.
  • Petroleo Brasileiro SA
  • Robert Bosch GmbH
  • Shaw Development LLC
  • Shell plc
  • Sinopec Shanghai Co. Ltd.
  • Tenneco Inc.
  • The Chemours Co.
  • TotalEnergies SE
  • Yara International ASA

Qualitative and quantitative analysis of companies has been conducted to help clients understand the wider business environment as well as the strengths and weaknesses of key industry players. Data is qualitatively analyzed to categorize companies as pure play, category-focused, industry-focused, and diversified; it is quantitatively analyzed to categorize companies as dominant, leading, strong, tentative, and weak.

Recent Development and News in Diesel exhaust fluid (def) market

  • In the Specialty Chemicals industry, the shift toward sustainable green hydrogen production for synthesizing ammonia has restructured raw material sourcing, directly impacting Diesel Exhaust Fluid (DEF) supply stability by reducing carbon-intensive feedstock dependence by up to 25%.
  • Strict implementation of the EU REACH framework regarding chemical handling has mandated advanced circular economy packaging protocols, affecting Diesel Exhaust Fluid (DEF) distributors who must now incorporate 30% recycled materials into their packaging solutions.
  • Advancements in precision chemical dosing technologies have accelerated the development of smart industrial systems, enabling Diesel Exhaust Fluid (DEF) manufacturers to improve vaporization efficiency and reduce problematic crystallization deposits by 18% in commercial applications.
  • The rapid integration of industrial IoT platforms in chemical logistics has enhanced the bulk distribution network capabilities, impacting Diesel Exhaust Fluid (DEF) availability through digital management systems that cut stockout incidents by 40% across major freight routes.

Dive into Technavio’s robust research methodology, blending expert interviews, extensive data synthesis, and validated models for unparalleled Diesel Exhaust Fluid (Def) Market insights. See full methodology.

Market Scope
Page number 334
Base year 2025
Historic period 2020-2024
Forecast period 2026-2030
Growth momentum & CAGR Accelerate at a CAGR of 17.8%
Market growth 2026-2030 USD 39556.2 million
Market structure Fragmented
YoY growth 2025-2026(%) 15.6%
Key countries US, Canada, Mexico, China, India, Japan, South Korea, Australia, Indonesia, Brazil, Argentina, Chile, Germany, France, UK, Italy, Spain, The Netherlands, Saudi Arabia, UAE, South Africa, Turkey and Egypt
Competitive landscape Leading Companies, Market Positioning of Companies, Competitive Strategies, and Industry Risks

Request Free Sample

Research Analyst Overview

  • The Diesel Exhaust Fluid (DEF) ecosystem is experiencing a critical evolution driven by the necessity to neutralize harmful exhaust emissions efficiently. Organizations managing extensive freight networks are increasingly prioritizing selective catalytic reduction reliability to avoid severe operational penalties. The seamless integration of a high-purity urea solution is imperative for sustaining commercial activities.
  • By upgrading to an advanced exhaust aftertreatment architecture, transport companies have realized a 20% decrease in unscheduled maintenance events tied to sensor malfunctions. A robust diesel exhaust fluid injector ensures precise fluid atomization, directly preventing the accumulation of urea cyanurate deposits that choke exhaust flow.
  • The deployment of a diaphragm supply pump guarantees consistent pressure, enabling optimal low-temperature catalyst performance during cold weather operations. Furthermore, accurate urea concentration monitoring is essential for verifying fluid quality before injection occurs. Modern logistics enterprises integrating smart diagnostic tools experience significantly fewer compliance-related vehicle groundings.
  • Securing resilient supply channels for essential chemical reductants fundamentally protects fleet operators from localized shortage disruptions.

What are the Key Data Covered in this Diesel Exhaust Fluid (Def) Market Research and Growth Report?

  • What is the expected growth of the Diesel Exhaust Fluid (Def) Market between 2026 and 2030?

    • USD 39.56 billion, at a CAGR of 17.8%

  • What segmentation does the market report cover?

    • The report is segmented by Vehicle Type (Commercial vehicles, Non-road vehicles, Passenger vehicles, and Trains), Packaging (Bulk, Cans and bottles, and IBCs and drums), Component (Selective catalytic reduction (SCR) catalyst, Diesel exhaust fluid (DEF) tank, Diesel exhaust fluid (DEF) injector, Diesel exhaust fluid (DEF) supply module, and Diesel exhaust fluid (DEF) sensor), End-user (OEM, and Aftermarket) and Geography (North America, APAC, South America, Europe, Middle East and Africa)

  • Which regions are analyzed in the report?

    • North America, APAC, South America, Europe and Middle East and Africa

  • What are the key growth drivers and market challenges?

    • Implementation of stringent emissions regulations globally, Vulnerability to urea supply chain disruptions

  • Who are the major players in the Diesel Exhaust Fluid (Def) Market?

    • Atmus Filtration Technologies, BASF SE, Bharat Petroleum Corp. Ltd., BRENNTAG SE, CF Industries Holdings Inc., Cummins Inc., Deere and Co., Elkhart Plastics Inc., Hexagon Composites ASA, Hitachi Ltd., KUS Technology Corp., Petroleo Brasileiro SA, Robert Bosch GmbH, Shaw Development LLC, Shell plc, Sinopec Shanghai Co. Ltd., Tenneco Inc., The Chemours Co., TotalEnergies SE and Yara International ASA

Market Research Insights

  • The Diesel Exhaust Fluid (DEF) Market represents a vital intersection of chemical engineering and vehicular compliance. The deployment of an efficient bulk distribution network has enabled fleet operators to achieve a 15% reduction in consumable procurement costs. Furthermore, integrating predictive maintenance telematics allows logistics managers to execute real-time consumption tracking, effectively decreasing engine derating incidents by 25%.
  • This data-driven approach enhances fleet operational uptime while ensuring strict adherence to environmental mandates. By utilizing climate-controlled storage solutions, distributors successfully maintain fluid integrity in extreme weather, preventing crystallization that typically increases maintenance expenses by 12%. Consequently, strategic fluid management translates directly into superior financial returns and uninterrupted commercial activities.

We can help! Our analysts can customize this diesel exhaust fluid (def) market research report to meet your requirements.

Get in touch

1. Executive Summary

1.1 Market overview

Executive Summary - Chart on Market Overview
Executive Summary - Data Table on Market Overview
Executive Summary - Chart on Global Market Characteristics
Executive Summary - Chart on Market by Geography
Executive Summary - Chart on Market Segmentation by Vehicle Type
Executive Summary - Chart on Market Segmentation by Packaging
Executive Summary - Chart on Market Segmentation by Component
Executive Summary - Chart on Market Segmentation by End-user
Executive Summary - Chart on Incremental Growth
Executive Summary - Data Table on Incremental Growth
Executive Summary - Chart on Company Market Positioning

2. Technavio Analysis

2.1 Analysis of price sensitivity, lifecycle, customer purchase basket, adoption rates, and purchase criteria

2.2 Criticality of inputs and Factors of differentiation

Chart on Overview on criticality of inputs and factors of differentiation

2.3 Factors of disruption

Chart on Overview on factors of disruption

2.4 Impact of drivers and challenges

Chart on Impact of drivers and challenges in 2025 and 2030

3. Market Landscape

3.1 Market ecosystem

Chart on Parent Market
Data Table on - Parent Market

3.2 Market characteristics

Chart on Market characteristics analysis

3.3 Value chain analysis

Chart on Value chain analysis

4. Market Sizing

4.1 Market definition

Data Table on Offerings of companies included in the market definition

4.2 Market segment analysis

Market segments

4.3 Market size 2025

4.4 Market outlook: Forecast for 2025-2030

Chart on Global - Market size and forecast 2025-2030 ($ million)
Data Table on Global - Market size and forecast 2025-2030 ($ million)
Chart on Global Market: Year-over-year growth 2025-2030 (%)
Data Table on Global Market: Year-over-year growth 2025-2030 (%)

5. Historic Market Size

5.1 Global Diesel Exhaust Fluid (DEF) Market 2020 - 2024

Historic Market Size - Data Table on Global Diesel Exhaust Fluid (DEF) Market 2020 - 2024 ($ million)

5.2 Vehicle Type segment analysis 2020 - 2024

Historic Market Size - Vehicle Type Segment 2020 - 2024 ($ million)

5.3 Packaging segment analysis 2020 - 2024

Historic Market Size - Packaging Segment 2020 - 2024 ($ million)

5.4 Component segment analysis 2020 - 2024

Historic Market Size - Component Segment 2020 - 2024 ($ million)

5.5 End-user segment analysis 2020 - 2024

Historic Market Size - End-user Segment 2020 - 2024 ($ million)

5.6 Geography segment analysis 2020 - 2024

Historic Market Size - Geography Segment 2020 - 2024 ($ million)

5.7 Country segment analysis 2020 - 2024

Historic Market Size - Country Segment 2020 - 2024 ($ million)

6. Qualitative Analysis

6.1 Impact of AI on Global Diesel Exhaust Fluid (DEF) Market

6.2 Impact of Geopolitical Conflicts on Global Diesel Exhaust Fluid (DEF) Market

7. Five Forces Analysis

7.1 Five forces summary

Five forces analysis - Comparison between 2025 and 2030

7.2 Bargaining power of buyers

Bargaining power of buyers - Impact of key factors 2025 and 2030

7.3 Bargaining power of suppliers

Bargaining power of suppliers - Impact of key factors in 2025 and 2030

7.4 Threat of new entrants

Threat of new entrants - Impact of key factors in 2025 and 2030

7.5 Threat of substitutes

Threat of substitutes - Impact of key factors in 2025 and 2030

7.6 Threat of rivalry

Threat of rivalry - Impact of key factors in 2025 and 2030

7.7 Market condition

Chart on Market condition - Five forces 2025 and 2030

8. Market Segmentation by Vehicle Type

8.1 Market segments

Chart on Vehicle Type - Market share 2025-2030 (%)
Data Table on Vehicle Type - Market share 2025-2030 (%)

8.2 Comparison by Vehicle Type

Chart on Comparison by Vehicle Type
Data Table on Comparison by Vehicle Type

8.3 Commercial vehicles - Market size and forecast 2025-2030

Chart on Commercial vehicles - Market size and forecast 2025-2030 ($ million)
Data Table on Commercial vehicles - Market size and forecast 2025-2030 ($ million)
Chart on Commercial vehicles - Year-over-year growth 2025-2030 (%)
Data Table on Commercial vehicles - Year-over-year growth 2025-2030 (%)

8.4 Non-road vehicles - Market size and forecast 2025-2030

Chart on Non-road vehicles - Market size and forecast 2025-2030 ($ million)
Data Table on Non-road vehicles - Market size and forecast 2025-2030 ($ million)
Chart on Non-road vehicles - Year-over-year growth 2025-2030 (%)
Data Table on Non-road vehicles - Year-over-year growth 2025-2030 (%)

8.5 Passenger vehicles - Market size and forecast 2025-2030

Chart on Passenger vehicles - Market size and forecast 2025-2030 ($ million)
Data Table on Passenger vehicles - Market size and forecast 2025-2030 ($ million)
Chart on Passenger vehicles - Year-over-year growth 2025-2030 (%)
Data Table on Passenger vehicles - Year-over-year growth 2025-2030 (%)

8.6 Trains - Market size and forecast 2025-2030

Chart on Trains - Market size and forecast 2025-2030 ($ million)
Data Table on Trains - Market size and forecast 2025-2030 ($ million)
Chart on Trains - Year-over-year growth 2025-2030 (%)
Data Table on Trains - Year-over-year growth 2025-2030 (%)

8.7 Market opportunity by Vehicle Type

Market opportunity by Vehicle Type ($ million)
Data Table on Market opportunity by Vehicle Type ($ million)

9. Market Segmentation by Packaging

9.1 Market segments

Chart on Packaging - Market share 2025-2030 (%)
Data Table on Packaging - Market share 2025-2030 (%)

9.2 Comparison by Packaging

Chart on Comparison by Packaging
Data Table on Comparison by Packaging

9.3 Bulk - Market size and forecast 2025-2030

Chart on Bulk - Market size and forecast 2025-2030 ($ million)
Data Table on Bulk - Market size and forecast 2025-2030 ($ million)
Chart on Bulk - Year-over-year growth 2025-2030 (%)
Data Table on Bulk - Year-over-year growth 2025-2030 (%)

9.4 Cans and bottles - Market size and forecast 2025-2030

Chart on Cans and bottles - Market size and forecast 2025-2030 ($ million)
Data Table on Cans and bottles - Market size and forecast 2025-2030 ($ million)
Chart on Cans and bottles - Year-over-year growth 2025-2030 (%)
Data Table on Cans and bottles - Year-over-year growth 2025-2030 (%)

9.5 IBCs and drums - Market size and forecast 2025-2030

Chart on IBCs and drums - Market size and forecast 2025-2030 ($ million)
Data Table on IBCs and drums - Market size and forecast 2025-2030 ($ million)
Chart on IBCs and drums - Year-over-year growth 2025-2030 (%)
Data Table on IBCs and drums - Year-over-year growth 2025-2030 (%)

9.6 Market opportunity by Packaging

Market opportunity by Packaging ($ million)
Data Table on Market opportunity by Packaging ($ million)

10. Market Segmentation by Component

10.1 Market segments

Chart on Component - Market share 2025-2030 (%)
Data Table on Component - Market share 2025-2030 (%)

10.2 Comparison by Component

Chart on Comparison by Component
Data Table on Comparison by Component

10.3 Selective catalytic reduction (SCR) catalyst - Market size and forecast 2025-2030

Chart on Selective catalytic reduction (SCR) catalyst - Market size and forecast 2025-2030 ($ million)
Data Table on Selective catalytic reduction (SCR) catalyst - Market size and forecast 2025-2030 ($ million)
Chart on Selective catalytic reduction (SCR) catalyst - Year-over-year growth 2025-2030 (%)
Data Table on Selective catalytic reduction (SCR) catalyst - Year-over-year growth 2025-2030 (%)

10.4 Diesel exhaust fluid (DEF) tank - Market size and forecast 2025-2030

Chart on Diesel exhaust fluid (DEF) tank - Market size and forecast 2025-2030 ($ million)
Data Table on Diesel exhaust fluid (DEF) tank - Market size and forecast 2025-2030 ($ million)
Chart on Diesel exhaust fluid (DEF) tank - Year-over-year growth 2025-2030 (%)
Data Table on Diesel exhaust fluid (DEF) tank - Year-over-year growth 2025-2030 (%)

10.5 Diesel exhaust fluid (DEF) injector - Market size and forecast 2025-2030

Chart on Diesel exhaust fluid (DEF) injector - Market size and forecast 2025-2030 ($ million)
Data Table on Diesel exhaust fluid (DEF) injector - Market size and forecast 2025-2030 ($ million)
Chart on Diesel exhaust fluid (DEF) injector - Year-over-year growth 2025-2030 (%)
Data Table on Diesel exhaust fluid (DEF) injector - Year-over-year growth 2025-2030 (%)

10.6 Diesel exhaust fluid (DEF) supply module - Market size and forecast 2025-2030

Chart on Diesel exhaust fluid (DEF) supply module - Market size and forecast 2025-2030 ($ million)
Data Table on Diesel exhaust fluid (DEF) supply module - Market size and forecast 2025-2030 ($ million)
Chart on Diesel exhaust fluid (DEF) supply module - Year-over-year growth 2025-2030 (%)
Data Table on Diesel exhaust fluid (DEF) supply module - Year-over-year growth 2025-2030 (%)

10.7 Diesel exhaust fluid (DEF) sensor - Market size and forecast 2025-2030

Chart on Diesel exhaust fluid (DEF) sensor - Market size and forecast 2025-2030 ($ million)
Data Table on Diesel exhaust fluid (DEF) sensor - Market size and forecast 2025-2030 ($ million)
Chart on Diesel exhaust fluid (DEF) sensor - Year-over-year growth 2025-2030 (%)
Data Table on Diesel exhaust fluid (DEF) sensor - Year-over-year growth 2025-2030 (%)

10.8 Market opportunity by Component

Market opportunity by Component ($ million)
Data Table on Market opportunity by Component ($ million)

11. Market Segmentation by End-user

11.1 Market segments

Chart on End-user - Market share 2025-2030 (%)
Data Table on End-user - Market share 2025-2030 (%)

11.2 Comparison by End-user

Chart on Comparison by End-user
Data Table on Comparison by End-user

11.3 OEM - Market size and forecast 2025-2030

Chart on OEM - Market size and forecast 2025-2030 ($ million)
Data Table on OEM - Market size and forecast 2025-2030 ($ million)
Chart on OEM - Year-over-year growth 2025-2030 (%)
Data Table on OEM - Year-over-year growth 2025-2030 (%)

11.4 Aftermarket - Market size and forecast 2025-2030

Chart on Aftermarket - Market size and forecast 2025-2030 ($ million)
Data Table on Aftermarket - Market size and forecast 2025-2030 ($ million)
Chart on Aftermarket - Year-over-year growth 2025-2030 (%)
Data Table on Aftermarket - Year-over-year growth 2025-2030 (%)

11.5 Market opportunity by End-user

Market opportunity by End-user ($ million)
Data Table on Market opportunity by End-user ($ million)

12. Customer Landscape

12.1 Customer landscape overview

Analysis of price sensitivity, lifecycle, customer purchase basket, adoption rates, and purchase criteria

13. Geographic Landscape

13.1 Geographic segmentation

Chart on Market share by geography 2025-2030 (%)
Data Table on Market share by geography 2025-2030 (%)

13.2 Geographic comparison

Chart on Geographic comparison
Data Table on Geographic comparison

13.3 North America - Market size and forecast 2025-2030

Chart on North America - Market size and forecast 2025-2030 ($ million)
Data Table on North America - Market size and forecast 2025-2030 ($ million)
Chart on North America - Year-over-year growth 2025-2030 (%)
Data Table on North America - Year-over-year growth 2025-2030 (%)
Chart on Regional Comparison - North America
Data Table on Regional Comparison - North America

13.3.1 US - Market size and forecast 2025-2030

Chart on US - Market size and forecast 2025-2030 ($ million)
Data Table on US - Market size and forecast 2025-2030 ($ million)
Chart on US - Year-over-year growth 2025-2030 (%)
Data Table on US - Year-over-year growth 2025-2030 (%)

13.3.2 Canada - Market size and forecast 2025-2030

Chart on Canada - Market size and forecast 2025-2030 ($ million)
Data Table on Canada - Market size and forecast 2025-2030 ($ million)
Chart on Canada - Year-over-year growth 2025-2030 (%)
Data Table on Canada - Year-over-year growth 2025-2030 (%)

13.3.3 Mexico - Market size and forecast 2025-2030

Chart on Mexico - Market size and forecast 2025-2030 ($ million)
Data Table on Mexico - Market size and forecast 2025-2030 ($ million)
Chart on Mexico - Year-over-year growth 2025-2030 (%)
Data Table on Mexico - Year-over-year growth 2025-2030 (%)

13.4 APAC - Market size and forecast 2025-2030

Chart on APAC - Market size and forecast 2025-2030 ($ million)
Data Table on APAC - Market size and forecast 2025-2030 ($ million)
Chart on APAC - Year-over-year growth 2025-2030 (%)
Data Table on APAC - Year-over-year growth 2025-2030 (%)
Chart on Regional Comparison - APAC
Data Table on Regional Comparison - APAC

13.4.1 China - Market size and forecast 2025-2030

Chart on China - Market size and forecast 2025-2030 ($ million)
Data Table on China - Market size and forecast 2025-2030 ($ million)
Chart on China - Year-over-year growth 2025-2030 (%)
Data Table on China - Year-over-year growth 2025-2030 (%)

13.4.2 India - Market size and forecast 2025-2030

Chart on India - Market size and forecast 2025-2030 ($ million)
Data Table on India - Market size and forecast 2025-2030 ($ million)
Chart on India - Year-over-year growth 2025-2030 (%)
Data Table on India - Year-over-year growth 2025-2030 (%)

13.4.3 Japan - Market size and forecast 2025-2030

Chart on Japan - Market size and forecast 2025-2030 ($ million)
Data Table on Japan - Market size and forecast 2025-2030 ($ million)
Chart on Japan - Year-over-year growth 2025-2030 (%)
Data Table on Japan - Year-over-year growth 2025-2030 (%)

13.4.4 South Korea - Market size and forecast 2025-2030

Chart on South Korea - Market size and forecast 2025-2030 ($ million)
Data Table on South Korea - Market size and forecast 2025-2030 ($ million)
Chart on South Korea - Year-over-year growth 2025-2030 (%)
Data Table on South Korea - Year-over-year growth 2025-2030 (%)

13.4.5 Australia - Market size and forecast 2025-2030

Chart on Australia - Market size and forecast 2025-2030 ($ million)
Data Table on Australia - Market size and forecast 2025-2030 ($ million)
Chart on Australia - Year-over-year growth 2025-2030 (%)
Data Table on Australia - Year-over-year growth 2025-2030 (%)

13.4.6 Indonesia - Market size and forecast 2025-2030

Chart on Indonesia - Market size and forecast 2025-2030 ($ million)
Data Table on Indonesia - Market size and forecast 2025-2030 ($ million)
Chart on Indonesia - Year-over-year growth 2025-2030 (%)
Data Table on Indonesia - Year-over-year growth 2025-2030 (%)

13.5 South America - Market size and forecast 2025-2030

Chart on South America - Market size and forecast 2025-2030 ($ million)
Data Table on South America - Market size and forecast 2025-2030 ($ million)
Chart on South America - Year-over-year growth 2025-2030 (%)
Data Table on South America - Year-over-year growth 2025-2030 (%)
Chart on Regional Comparison - South America
Data Table on Regional Comparison - South America

13.5.1 Brazil - Market size and forecast 2025-2030

Chart on Brazil - Market size and forecast 2025-2030 ($ million)
Data Table on Brazil - Market size and forecast 2025-2030 ($ million)
Chart on Brazil - Year-over-year growth 2025-2030 (%)
Data Table on Brazil - Year-over-year growth 2025-2030 (%)

13.5.2 Argentina - Market size and forecast 2025-2030

Chart on Argentina - Market size and forecast 2025-2030 ($ million)
Data Table on Argentina - Market size and forecast 2025-2030 ($ million)
Chart on Argentina - Year-over-year growth 2025-2030 (%)
Data Table on Argentina - Year-over-year growth 2025-2030 (%)

13.5.3 Chile - Market size and forecast 2025-2030

Chart on Chile - Market size and forecast 2025-2030 ($ million)
Data Table on Chile - Market size and forecast 2025-2030 ($ million)
Chart on Chile - Year-over-year growth 2025-2030 (%)
Data Table on Chile - Year-over-year growth 2025-2030 (%)

13.6 Europe - Market size and forecast 2025-2030

Chart on Europe - Market size and forecast 2025-2030 ($ million)
Data Table on Europe - Market size and forecast 2025-2030 ($ million)
Chart on Europe - Year-over-year growth 2025-2030 (%)
Data Table on Europe - Year-over-year growth 2025-2030 (%)
Chart on Regional Comparison - Europe
Data Table on Regional Comparison - Europe

13.6.1 Germany - Market size and forecast 2025-2030

Chart on Germany - Market size and forecast 2025-2030 ($ million)
Data Table on Germany - Market size and forecast 2025-2030 ($ million)
Chart on Germany - Year-over-year growth 2025-2030 (%)
Data Table on Germany - Year-over-year growth 2025-2030 (%)

13.6.2 France - Market size and forecast 2025-2030

Chart on France - Market size and forecast 2025-2030 ($ million)
Data Table on France - Market size and forecast 2025-2030 ($ million)
Chart on France - Year-over-year growth 2025-2030 (%)
Data Table on France - Year-over-year growth 2025-2030 (%)

13.6.3 UK - Market size and forecast 2025-2030

Chart on UK - Market size and forecast 2025-2030 ($ million)
Data Table on UK - Market size and forecast 2025-2030 ($ million)
Chart on UK - Year-over-year growth 2025-2030 (%)
Data Table on UK - Year-over-year growth 2025-2030 (%)

13.6.4 Italy - Market size and forecast 2025-2030

Chart on Italy - Market size and forecast 2025-2030 ($ million)
Data Table on Italy - Market size and forecast 2025-2030 ($ million)
Chart on Italy - Year-over-year growth 2025-2030 (%)
Data Table on Italy - Year-over-year growth 2025-2030 (%)

13.6.5 Spain - Market size and forecast 2025-2030

Chart on Spain - Market size and forecast 2025-2030 ($ million)
Data Table on Spain - Market size and forecast 2025-2030 ($ million)
Chart on Spain - Year-over-year growth 2025-2030 (%)
Data Table on Spain - Year-over-year growth 2025-2030 (%)

13.6.6 The Netherlands - Market size and forecast 2025-2030

Chart on The Netherlands - Market size and forecast 2025-2030 ($ million)
Data Table on The Netherlands - Market size and forecast 2025-2030 ($ million)
Chart on The Netherlands - Year-over-year growth 2025-2030 (%)
Data Table on The Netherlands - Year-over-year growth 2025-2030 (%)

13.7 Middle East and Africa - Market size and forecast 2025-2030

Chart on Middle East and Africa - Market size and forecast 2025-2030 ($ million)
Data Table on Middle East and Africa - Market size and forecast 2025-2030 ($ million)
Chart on Middle East and Africa - Year-over-year growth 2025-2030 (%)
Data Table on Middle East and Africa - Year-over-year growth 2025-2030 (%)
Chart on Regional Comparison - Middle East and Africa
Data Table on Regional Comparison - Middle East and Africa

13.7.1 Saudi Arabia - Market size and forecast 2025-2030

Chart on Saudi Arabia - Market size and forecast 2025-2030 ($ million)
Data Table on Saudi Arabia - Market size and forecast 2025-2030 ($ million)
Chart on Saudi Arabia - Year-over-year growth 2025-2030 (%)
Data Table on Saudi Arabia - Year-over-year growth 2025-2030 (%)

13.7.2 UAE - Market size and forecast 2025-2030

Chart on UAE - Market size and forecast 2025-2030 ($ million)
Data Table on UAE - Market size and forecast 2025-2030 ($ million)
Chart on UAE - Year-over-year growth 2025-2030 (%)
Data Table on UAE - Year-over-year growth 2025-2030 (%)

13.7.3 South Africa - Market size and forecast 2025-2030

Chart on South Africa - Market size and forecast 2025-2030 ($ million)
Data Table on South Africa - Market size and forecast 2025-2030 ($ million)
Chart on South Africa - Year-over-year growth 2025-2030 (%)
Data Table on South Africa - Year-over-year growth 2025-2030 (%)

13.7.4 Turkey - Market size and forecast 2025-2030

Chart on Turkey - Market size and forecast 2025-2030 ($ million)
Data Table on Turkey - Market size and forecast 2025-2030 ($ million)
Chart on Turkey - Year-over-year growth 2025-2030 (%)
Data Table on Turkey - Year-over-year growth 2025-2030 (%)

13.7.5 Egypt - Market size and forecast 2025-2030

Chart on Egypt - Market size and forecast 2025-2030 ($ million)
Data Table on Egypt - Market size and forecast 2025-2030 ($ million)
Chart on Egypt - Year-over-year growth 2025-2030 (%)
Data Table on Egypt - Year-over-year growth 2025-2030 (%)

13.8 Market opportunity by geography

Market opportunity by geography ($ million)
Data Tables on Market opportunity by geography ($ million)

14. Drivers, Challenges, and Opportunity

14.1 Market drivers

Implementation of stringent emissions regulations globally
Sustained growth in commercial vehicle fleets and industrial activities
Enduring viability of diesel engines in heavy-duty applications

14.2 Market challenges

Vulnerability to urea supply chain disruptions
Long-term existential threat from vehicle electrification
Challenges of system complexity, reliability, and maintenance costs

14.3 Impact of drivers and challenges

Impact of drivers and challenges in 2025 and 2030

14.4 Market opportunities

Increasing focus on supply chain resilience and vertical integration
Integration of advanced sensor technology and digitalization
Development of next-generation, high-efficiency aftertreatment systems

15. Competitive Landscape

15.1 Overview

15.2

Overview on criticality of inputs and factors of differentiation

15.3 Landscape disruption

Overview on factors of disruption

15.4 Industry risks

Impact of key risks on business

16. Competitive Analysis

16.1 Companies profiled

Companies covered

16.2 Company ranking index

16.3 Market positioning of companies

Matrix on companies position and classification

16.4 Atmus Filtration Technologies

Atmus Filtration Technologies - Overview
Atmus Filtration Technologies - Business segments
Atmus Filtration Technologies - Key offerings
Atmus Filtration Technologies - Segment focus
SWOT

16.5 BASF SE

BASF SE - Overview
BASF SE - Business segments
BASF SE - Key news
BASF SE - Key offerings
BASF SE - Segment focus
SWOT

16.6 Bharat Petroleum Corp. Ltd.

Bharat Petroleum Corp. Ltd. - Overview
Bharat Petroleum Corp. Ltd. - Product / Service
Bharat Petroleum Corp. Ltd. - Key offerings
SWOT

16.7 BRENNTAG SE

BRENNTAG SE - Overview
BRENNTAG SE - Business segments
BRENNTAG SE - Key offerings
BRENNTAG SE - Segment focus
SWOT

16.8 CF Industries Holdings Inc.

CF Industries Holdings Inc. - Overview
CF Industries Holdings Inc. - Business segments
CF Industries Holdings Inc. - Key offerings
CF Industries Holdings Inc. - Segment focus
SWOT

16.9 Cummins Inc.

Cummins Inc. - Overview
Cummins Inc. - Business segments
Cummins Inc. - Key offerings
Cummins Inc. - Segment focus
SWOT

16.10 Deere and Co.

Deere and Co. - Overview
Deere and Co. - Business segments
Deere and Co. - Key offerings
Deere and Co. - Segment focus
SWOT

16.11 Hexagon Composites ASA

Hexagon Composites ASA - Overview
Hexagon Composites ASA - Business segments
Hexagon Composites ASA - Key offerings
Hexagon Composites ASA - Segment focus
SWOT

16.12 Hitachi Ltd.

Hitachi Ltd. - Overview
Hitachi Ltd. - Business segments
Hitachi Ltd. - Key offerings
Hitachi Ltd. - Segment focus
SWOT

16.13 Robert Bosch GmbH

Robert Bosch GmbH - Overview
Robert Bosch GmbH - Product / Service
Robert Bosch GmbH - Key offerings
SWOT

16.14 Shell plc

Shell plc - Overview
Shell plc - Business segments
Shell plc - Key offerings
Shell plc - Segment focus
SWOT

16.15 Sinopec Shanghai Co. Ltd.

Sinopec Shanghai Co. Ltd. - Overview
Sinopec Shanghai Co. Ltd. - Business segments
Sinopec Shanghai Co. Ltd. - Key offerings
Sinopec Shanghai Co. Ltd. - Segment focus
SWOT

16.16 The Chemours Co.

The Chemours Co. - Overview
The Chemours Co. - Business segments
The Chemours Co. - Key news
The Chemours Co. - Key offerings
The Chemours Co. - Segment focus
SWOT

16.17 TotalEnergies SE

TotalEnergies SE - Overview
TotalEnergies SE - Business segments
TotalEnergies SE - Key news
TotalEnergies SE - Key offerings
TotalEnergies SE - Segment focus
SWOT

16.18 Yara International ASA

Yara International ASA - Overview
Yara International ASA - Business segments
Yara International ASA - Key offerings
Yara International ASA - Segment focus
SWOT

17. Appendix

17.1 Scope of the report

Market definition
Objectives
Notes and caveats

17.2 Inclusions and exclusions checklist

Inclusions checklist
Exclusions checklist

17.3 Currency conversion rates for US$

17.4 Research methodology

17.5 Data procurement

Information sources

17.6 Data validation

17.7 Validation techniques employed for market sizing

17.8 Data synthesis

17.9 360 degree market analysis

17.10 List of abbreviations

Research Methodology

Technavio presents a detailed picture of the market by way of study, synthesis, and summation of data from multiple sources. The analysts have presented the various facets of the market with a particular focus on identifying the key industry influencers. The data thus presented is comprehensive, reliable, and the result of extensive research, both primary and secondary.

INFORMATION SOURCES

Primary sources

  • Manufacturers and suppliers
  • Channel partners
  • Industry experts
  • Strategic decision makers

Secondary sources

  • Industry journals and periodicals
  • Government data
  • Financial reports of key industry players
  • Historical data
  • Press releases

DATA ANALYSIS

Data Synthesis

  • Collation of data
  • Estimation of key figures
  • Analysis of derived insights

Data Validation

  • Triangulation with data models
  • Reference against proprietary databases
  • Corroboration with industry experts

REPORT WRITING

Qualitative

  • Market drivers
  • Market challenges
  • Market trends
  • Five forces analysis

Quantitative

  • Market size and forecast
  • Market segmentation
  • Geographical insights
  • Competitive landscape

Interested in this report?

Get your sample now to see our research methodology and insights!

Download Now

Frequently Asked Questions

Diesel Exhaust Fluid (Def) market growth will increase by USD 39556.2 million during 2026-2030.

The Diesel Exhaust Fluid (Def) market is expected to grow at a CAGR of 17.8% during 2026-2030.

Diesel Exhaust Fluid (Def) market is segmented by Vehicle type (Commercial vehicles, Non-road vehicles, Passenger vehicles, Trains) Packaging (Bulk, Cans and bottles, IBCs and drums) Component (Selective catalytic reduction (SCR) catalyst, Diesel exhaust fluid (DEF) tank, Diesel exhaust fluid (DEF) injector, Diesel exhaust fluid (DEF) supply module, Diesel exhaust fluid (DEF) sensor) End-user (OEM, Aftermarket)

Atmus Filtration Technologies, BASF SE, Bharat Petroleum Corp. Ltd., BRENNTAG SE, CF Industries Holdings Inc., Cummins Inc., Deere and Co., Elkhart Plastics Inc., Hexagon Composites ASA, Hitachi Ltd., KUS Technology Corp., Petroleo Brasileiro SA, Robert Bosch GmbH, Shaw Development LLC, Shell plc, Sinopec Shanghai Co. Ltd., Tenneco Inc., The Chemours Co., TotalEnergies SE, Yara International ASA are a few of the key vendors in the Diesel Exhaust Fluid (Def) market.

North America will register the highest growth rate of 35.7% among the other regions. Therefore, the Diesel Exhaust Fluid (Def) market in North America is expected to garner significant business opportunities for the vendors during the forecast period.

US, Canada, Mexico, China, India, Japan, South Korea, Australia, Indonesia, Brazil, Argentina, Chile, Germany, France, UK, Italy, Spain, The Netherlands, Saudi Arabia, UAE, South Africa, Turkey, Egypt

  • Implementation of stringent emissions regulations globally is the driving factor this market.

The Diesel Exhaust Fluid (Def) market vendors should focus on grabbing business opportunities from the Vehicle type segment as it accounted for the largest market share in the base year.
RIA - Research AI Assistant
Ask RIA
