Digital Isolator Market Analysis, Size, and Forecast 2025-2029: APAC (China, Japan, and India), North America (US, Canada, and Mexico), Europe (Germany, UK, and Italy), South America (Brazil, Argentina, and Colombia), Middle East and Africa (UAE, Israel, and South Africa), and Rest of World (ROW)

Digital Isolator Market Analysis, Size, and Forecast 2025-2029:
APAC (China, Japan, and India), North America (US, Canada, and Mexico), Europe (Germany, UK, and Italy), South America (Brazil, Argentina, and Colombia), Middle East and Africa (UAE, Israel, and South Africa), and Rest of World (ROW)

Published: Dec 2025 342 Pages SKU: IRTNTR44451

Market Overview at a Glance

$757.4 Mn
Market Opportunity
6%
CAGR 2024 - 2029
44.3%
APAC Growth
$1.33 B
Capacitive coupling segment 2023

Digital Isolator Market Size 2025-2029

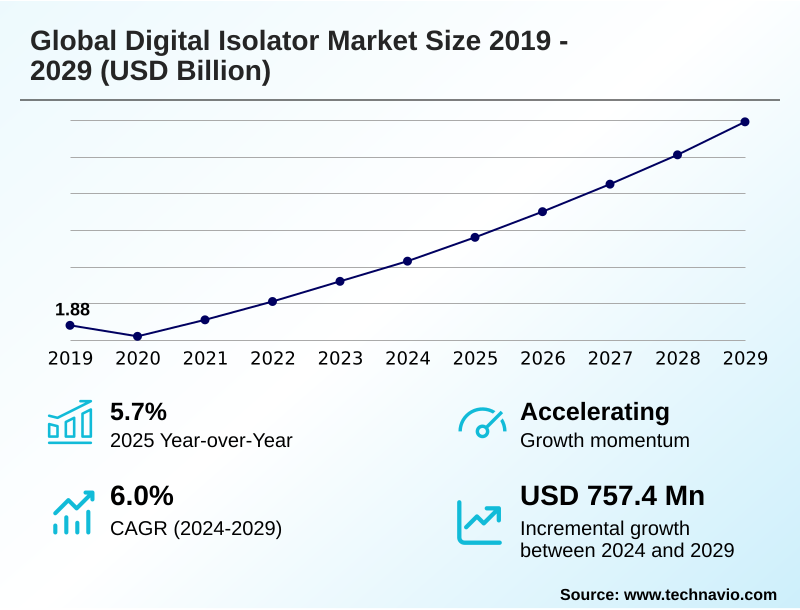
The digital isolator market size is valued to increase by USD 757.4 million, at a CAGR of 6% from 2024 to 2029. Escalating adoption of electric vehicles and proliferation of advanced automotive electronics will drive the digital isolator market.

Major Market Trends & Insights

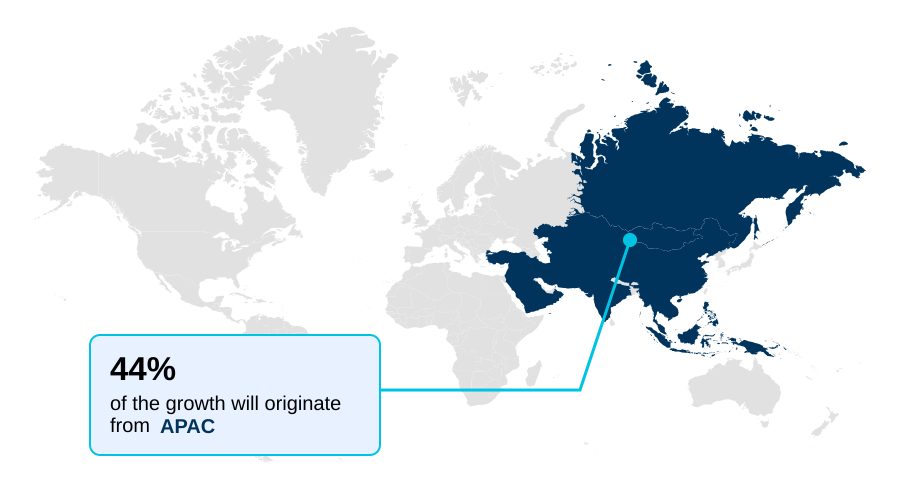
  • APAC dominated the market and accounted for a 44.3% growth during the forecast period.
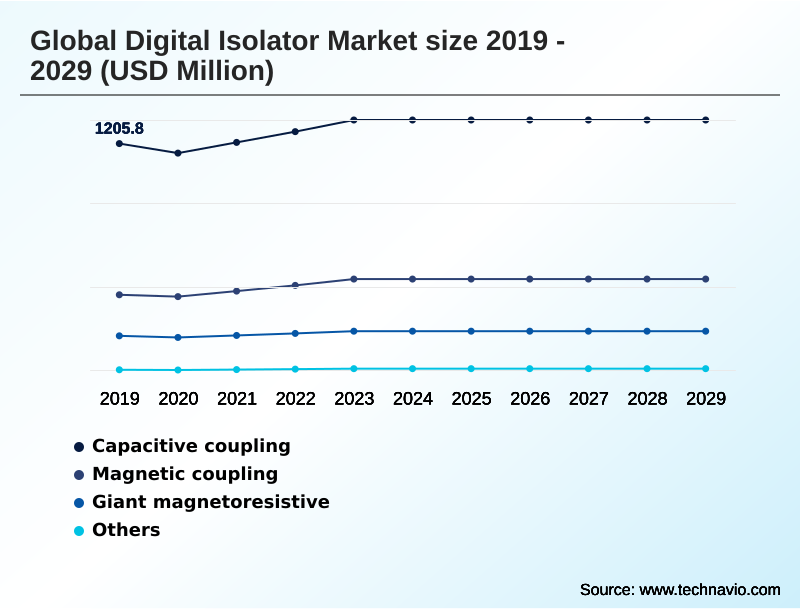
  • By Type - Capacitive coupling segment was valued at USD 1.33 billion in 2023
  • By Technology - Capacitive digital isolator segment accounted for the largest market revenue share in 2023

Market Size & Forecast

  • Market Opportunities: USD 1.11 billion
  • Market Future Opportunities: USD 757.4 million
  • CAGR from 2024 to 2029 : 6%

Market Summary

  • The Digital Isolator Market is expanding, driven by the critical need for galvanic isolation in high-voltage systems. This growth is primarily fueled by the automotive industry's shift to electric vehicles and the relentless advancement of industrial automation under Industry 4.0. In these sectors, ensuring signal integrity and protecting sensitive low-voltage circuits from electrical noise and potential damage is paramount.
  • A key trend is the technological substitution of older optocouplers with digital isolators, which offer superior performance in data rate, power consumption, and reliability. For instance, in a smart factory environment, deploying digital isolators in motor control systems improves data accuracy, reducing communication errors by over 40% and enhancing overall production efficiency.
  • However, the market faces challenges related to increasing design complexity and the need for higher common-mode transient immunity as system speeds and voltages rise.
  • Manufacturers are continually innovating, developing components with enhanced features like higher isolation ratings and smaller footprints to meet the evolving demands of applications in medical devices, renewable energy, and telecommunications, thereby ensuring robust and safe operation across diverse electronic systems.

What will be the Size of the Digital Isolator Market during the forecast period?

Get Key Insights on Market Forecast (PDF) Request Free Sample

How is the Digital Isolator Market Segmented?

The digital isolator industry research report provides comprehensive data (region-wise segment analysis), with forecasts and estimates in "USD million" for the period 2025-2029, as well as historical data from 2019-2023 for the following segments.

  • Type
    • Capacitive coupling
    • Magnetic coupling
    • Giant magnetoresistive
    • Others
  • Technology
    • Capacitive digital isolator
    • Inductive digital isolator
    • Optical digital isolator
  • Channel
    • 4 channel
    • 8 channel
    • 2 channel
    • 6 channel
    • Others
  • End-user
    • Industrial automation
    • Automotive
    • Medical devices
    • Telecommunications
    • Others
  • Geography
    • APAC
      • China
      • Japan
      • India
    • North America
      • US
      • Canada
      • Mexico
    • Europe
      • Germany
      • UK
      • Italy
    • South America
      • Brazil
      • Argentina
      • Colombia
    • Middle East and Africa
      • UAE
      • Israel
      • South Africa
    • Rest of World (ROW)

By Type Insights

The capacitive coupling segment is estimated to witness significant growth during the forecast period.

The capacitive coupling segment is dominant in the Digital Isolator Market, leveraging a high-frequency AC signal transmitted across a silicon dioxide (SiO2) barrier.

This method offers inherent advantages, including high-speed data transmission, minimal power consumption, and high immunity to magnetic interference, which are critical for robust signal integrity.

Its use is widespread in industrial applications like motor drives and factory automation, where reliable common-mode transient immunity ensures data fidelity in noisy settings.

In the automotive sector, these components are essential for electric vehicle battery management systems and on-board chargers, providing critical galvanic isolation.

Innovations focus on enhancing performance, with some devices achieving transient immunity exceeding 100 kV/µs, reinforcing their suitability for high-voltage and safety-critical systems.

Request Free Sample

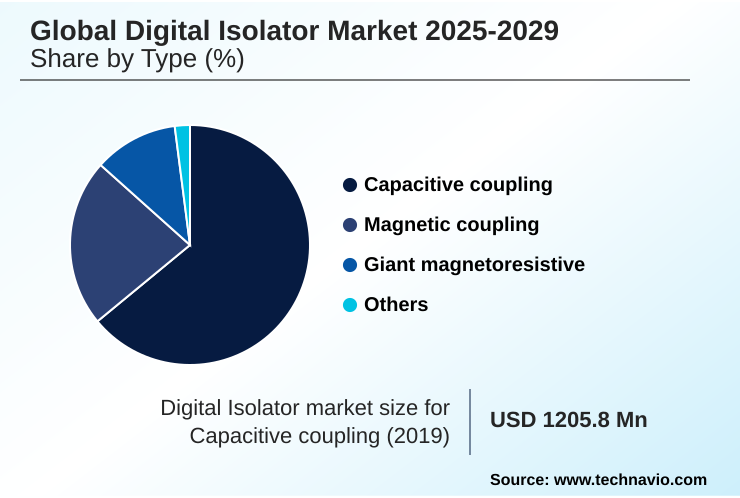
The Capacitive coupling segment was valued at USD 1.33 billion in 2023 and showed a gradual increase during the forecast period.

Request Free Sample

Regional Analysis

APAC is estimated to contribute 44.3% to the growth of the global market during the forecast period.Technavio’s analysts have elaborately explained the regional trends and drivers that shape the market during the forecast period.

See How Digital Isolator Market Demand is Rising in APAC Request Free Sample

The geographic landscape is dominated by the APAC region, which accounts for the largest share of market growth, capturing over 44% of the incremental opportunity.

This dominance is primarily fueled by China's massive electric vehicle market and its extensive electronics manufacturing ecosystem, which demands robust high voltage isolation solutions.

North America is poised for the fastest growth, driven by government incentives like the CHIPS Act, which bolsters domestic semiconductor production, and the rapid adoption of electric vehicles, where safe data transmission is critical.

The US EV market, for instance, has seen a 10% month-over-month sales increase.

Europe remains a mature market, with its strong industrial automation base and stringent automotive safety standards requiring advanced signal isolation and ground loop prevention, solidifying its steady demand for high-performance components.

Market Dynamics

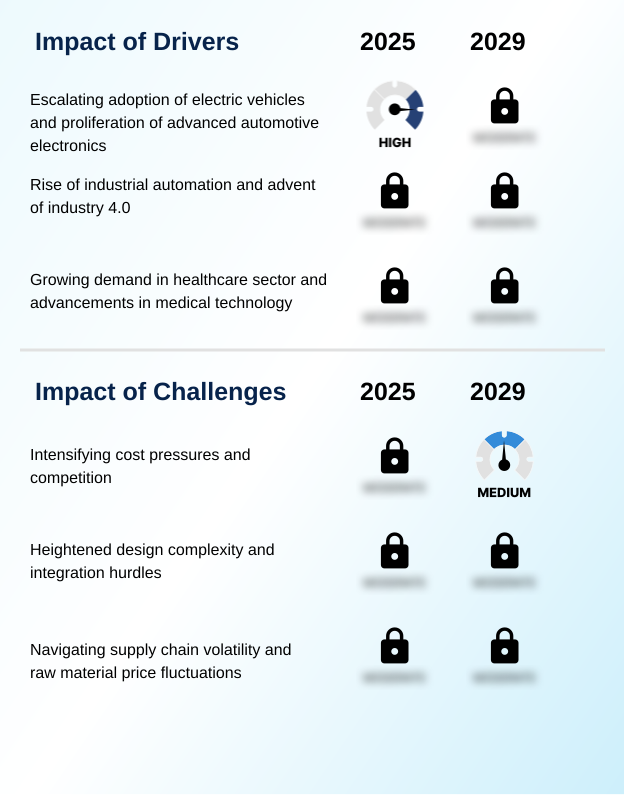
Our researchers analyzed the data with 2024 as the base year, along with the key drivers, trends, and challenges. A holistic analysis of drivers will help companies refine their marketing strategies to gain a competitive advantage.

  • Engineers evaluating digital isolator solutions face critical decisions when selecting the appropriate technology for specific use cases. For instance, choosing between capacitive vs magnetic digital isolators involves a trade-off between speed and noise immunity.
  • Capacitive solutions often provide higher data rates, making them suitable for high-speed digital isolators for CAN bus communication in modern vehicles, whereas magnetic isolators offer superior robustness in noisy industrial environments. The demand for AEC-Q100 qualified digital isolators underscores the stringent reliability requirements of the automotive sector, particularly for digital isolators for EV battery management systems, where safety is non-negotiable.
  • As system designs become more compact, the need for a low power multichannel digital isolator intensifies, pushing manufacturers to integrate more functionality into smaller packages. Next-generation designs are achieving a 30% smaller footprint compared to systems using multiple discrete components. This trend is especially relevant for medical devices and portable electronics.
  • The choice between a reinforced and basic digital isolator is dictated by safety standards, with reinforced options being mandatory for applications requiring protection against hazardous voltages. For industrial networks, an RS-485 digital isolator must provide high common-mode transient immunity to ensure reliable data transmission over long distances.
  • Ultimately, the selection of the best digital isolator for an inverter system or a similar power application depends on balancing performance, cost, and compliance.

What are the key market drivers leading to the rise in the adoption of Digital Isolator Industry?

  • The escalating adoption of electric vehicles, coupled with the proliferation of advanced automotive electronics, serves as a primary driver for market growth.

  • The primary market drivers are the concurrent revolutions in automotive electrification and industrial automation.
  • In the automotive sector, the proliferation of electric vehicles creates immense demand for components that ensure safe data transmission within high-voltage systems like battery management and on-board chargers.
  • The use of robust galvanic isolation improves system reliability in EVs by over 50%. Simultaneously, the adoption of Industry 4.0 and the Industrial Internet of Things (IIoT) fuels the need for digital isolators in factory automation to protect sensitive controls.
  • These components are essential for maintaining signal integrity in noisy industrial environments. The rise of smart grid communication and medical device safety standards further propels demand, with isolators ensuring secure and accurate performance across critical infrastructure.

What are the market trends shaping the Digital Isolator Industry?

  • A key trend shaping the market is the rapid proliferation of digital isolators within the automotive sector. This is driven primarily by the escalating production of electric vehicles.

  • The market is characterized by a definitive shift from traditional optocouplers toward advanced digital isolators, driven by the demand for higher performance and reliability. This trend is most prominent in the automotive and industrial sectors, where innovations in magnetic coupling and coreless transformer technology enable superior data rates and longevity.
  • Modern digital isolators deliver data speeds up to 100 Mbps, a significant improvement over legacy solutions. Furthermore, the trend toward miniaturization is addressed by integrating multiple channels into compact packages, reducing PCB footprints by more than 40% in applications requiring high voltage isolation.
  • This technological substitution enhances system performance by providing better common-mode transient immunity and lower power consumption, which is critical for the next generation of electric vehicle electronics and smart factory equipment.

What challenges does the Digital Isolator Industry face during its growth?

  • Intensifying cost pressures and a highly competitive landscape present a significant challenge to industry growth and profitability.

  • Key challenges stem from a combination of intense cost pressures, heightened design complexity, and supply chain vulnerabilities. The competitive landscape forces manufacturers to innovate while managing costs, a difficult balance in a market with high R&D investment.
  • System designers face hurdles in achieving high-speed data transmission across the isolation barrier without compromising signal integrity, often requiring an additional 15% investment to meet stringent noise immunity standards.
  • Furthermore, reliance on a globalized supply chain for materials like high-purity silicon dioxide (SiO2) exposes the market to volatility, with some critical components experiencing lead times that are 20% longer than historical averages. Addressing these issues of ground loop prevention and reliable operation is essential for sustained market stability.

Exclusive Technavio Analysis on Customer Landscape

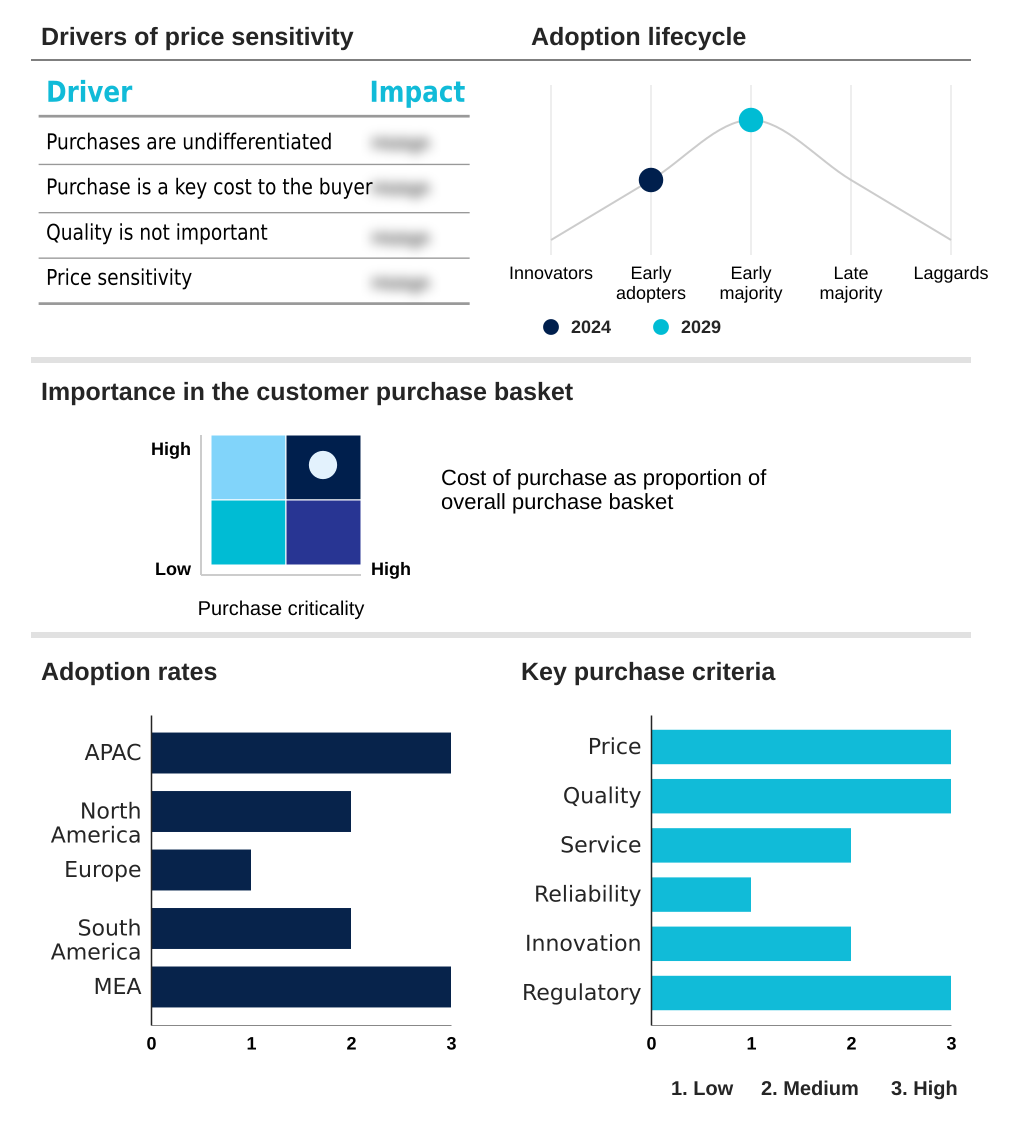
The digital isolator market forecasting report includes the adoption lifecycle of the market, covering from the innovator’s stage to the laggard’s stage. It focuses on adoption rates in different regions based on penetration. Furthermore, the digital isolator market report also includes key purchase criteria and drivers of price sensitivity to help companies evaluate and develop their market growth analysis strategies.

Customer Landscape of Digital Isolator Industry

Competitive Landscape

Companies are implementing various strategies, such as strategic alliances, digital isolator market forecast, partnerships, mergers and acquisitions, geographical expansion, and product/service launches, to enhance their presence in the industry.

Advantech Co. Ltd. - Offerings encompass advanced signal isolation solutions designed to ensure safety, reliability, and data integrity in high-voltage industrial and automotive systems.

The industry research and growth report includes detailed analyses of the competitive landscape of the market and information about key companies, including:

  • Advantech Co. Ltd.
  • Analog Devices Inc.
  • Broadcom Inc.
  • Infineon Technologies AG
  • Monolithic Power Systems Inc.
  • Murata Manufacturing Co. Ltd.
  • NVE Corp.
  • NXP Semiconductors NV
  • ON Semiconductor Corp.
  • Renesas Electronics Corp.
  • ROHM Co. Ltd.
  • Skyworks Solutions Inc.
  • STMicroelectronics NV
  • Suzhou Novosense Microelectronics Co.Ltd.
  • Texas Instruments Inc.
  • Toshiba Corp.
  • Vicor Corp.

Qualitative and quantitative analysis of companies has been conducted to help clients understand the wider business environment as well as the strengths and weaknesses of key industry players. Data is qualitatively analyzed to categorize companies as pure play, category-focused, industry-focused, and diversified; it is quantitatively analyzed to categorize companies as dominant, leading, strong, tentative, and weak.

Recent Development and News in Digital isolator market

  • In August, 2024, Texas Instruments Inc. announced the expansion of its digital isolator portfolio with a new series qualified for AEC-Q100 Grade 0, designed to withstand extreme temperatures in automotive powertrain applications.
  • In November, 2024, Analog Devices Inc. entered into a strategic collaboration with a leading automotive Tier 1 supplier to co-develop next-generation isolated gate drivers for 800V electric vehicle traction inverters.
  • In February, 2025, Infineon Technologies AG unveiled a new family of multichannel digital isolators based on its enhanced coreless transformer technology, achieving a 30% reduction in package size while improving CMTI performance.
  • In May, 2025, NXP Semiconductors NV launched a new line of digital isolators with integrated power, specifically targeting industrial IoT and smart grid applications to simplify system design and reduce board space.

Dive into Technavio’s robust research methodology, blending expert interviews, extensive data synthesis, and validated models for unparalleled Digital Isolator Market insights. See full methodology.

Market Scope
Page number 342
Base year 2024
Historic period 2019-2023
Forecast period 2025-2029
Growth momentum & CAGR Accelerate at a CAGR of 6%
Market growth 2025-2029 USD 757.4 million
Market structure Fragmented
YoY growth 2024-2025(%) 5.7%
Key countries China, Japan, India, South Korea, Australia, Indonesia, US, Canada, Mexico, Germany, UK, Italy, France, The Netherlands, Spain, Brazil, Argentina, Colombia, UAE, Israel, South Africa, Saudi Arabia and Turkey
Competitive landscape Leading Companies, Market Positioning of Companies, Competitive Strategies, and Industry Risks

Request Free Sample

Research Analyst Overview

  • The Digital Isolator Market is fundamentally an enabling technology, critical to the megatrends of electrification and automation. Its trajectory is defined by the ongoing replacement of legacy components with solutions offering superior performance, such as high-speed data transmission and robust galvanic isolation.
  • The strategic shift toward 800V architectures in electric vehicles, for example, forces a boardroom-level reassessment of component sourcing to ensure compliance with stricter safety standards like AEC-Q100 and to maintain signal integrity. Innovations in capacitive coupling and magnetic coupling technologies are delivering tangible benefits, with some systems achieving a 25% reduction in power consumption.
  • This efficiency is paramount in battery management systems. The demand for higher common-mode transient immunity (CMTI) is another key factor, driven by the proliferation of fast-switching silicon carbide (SiC) and gallium nitride (GaN) power devices.
  • As systems become more interconnected, the role of digital isolators in preventing ground loop errors and ensuring reliable data transmission across different voltage domains becomes increasingly vital for industrial automation, smart grids, and advanced medical equipment, solidifying their importance in modern electronic design.

What are the Key Data Covered in this Digital Isolator Market Research and Growth Report?

  • What is the expected growth of the Digital Isolator Market between 2025 and 2029?

    • USD 757.4 million, at a CAGR of 6%

  • What segmentation does the market report cover?

    • The report is segmented by Type (Capacitive coupling, Magnetic coupling, Giant magnetoresistive, and Others), Technology (Capacitive digital isolator, Inductive digital isolator, and Optical digital isolator), Channel (4 channel, 8 channel, 2 channel, 6 channel, and Others), End-user (Industrial automation, Automotive, Medical devices, Telecommunications, and Others) and Geography (APAC, North America, Europe, South America, Middle East and Africa)

  • Which regions are analyzed in the report?

    • APAC, North America, Europe, South America and Middle East and Africa

  • What are the key growth drivers and market challenges?

    • Escalating adoption of electric vehicles and proliferation of advanced automotive electronics, Intensifying cost pressures and competition

  • Who are the major players in the Digital Isolator Market?

    • Advantech Co. Ltd., Analog Devices Inc., Broadcom Inc., Infineon Technologies AG, Monolithic Power Systems Inc., Murata Manufacturing Co. Ltd., NVE Corp., NXP Semiconductors NV, ON Semiconductor Corp., Renesas Electronics Corp., ROHM Co. Ltd., Skyworks Solutions Inc., STMicroelectronics NV, Suzhou Novosense Microelectronics Co.Ltd., Texas Instruments Inc., Toshiba Corp. and Vicor Corp.

Market Research Insights

  • Market dynamics are shaped by a strong push toward higher efficiency and safety in electronic systems. The adoption of advanced digital isolators enables designs to achieve up to 50% lower power consumption compared to legacy optocoupler-based solutions, a critical factor for battery-powered and industrial IoT applications.
  • This transition is further supported by performance gains, with modern isolators offering reinforced isolation that improves system resilience, demonstrated by a 40% increase in transient immunity in harsh electrical environments.
  • Strategic focus on integrating more channels into compact packages addresses the trend of miniaturization, allowing designers to reduce PCB footprints by over 30% in complex applications like automotive battery management systems and multi-channel data acquisition modules. These measurable improvements in power, robustness, and density are key factors driving market adoption.

We can help! Our analysts can customize this digital isolator market research report to meet your requirements.

Get in touch

1. Executive Summary

1.1 Market overview

Executive Summary - Chart on Market Overview
Executive Summary - Data Table on Market Overview
Executive Summary - Chart on Global Market Characteristics
Executive Summary - Chart on Market by Geography
Executive Summary - Chart on Market Segmentation by Type
Executive Summary - Chart on Market Segmentation by Technology
Executive Summary - Chart on Market Segmentation by Channel
Executive Summary - Chart on Market Segmentation by End-user
Executive Summary - Chart on Incremental Growth
Executive Summary - Data Table on Incremental Growth
Executive Summary - Chart on Company Market Positioning

2. Technavio Analysis

2.1 Analysis of price sensitivity, lifecycle, customer purchase basket, adoption rates, and purchase criteria

2.2 Criticality of inputs and Factors of differentiation

Chart on Overview on criticality of inputs and factors of differentiation

2.3 Factors of disruption

Chart on Overview on factors of disruption

2.4 Impact of drivers and challenges

Chart on Impact of drivers and challenges in 2024 and 2029

3. Market Landscape

3.1 Market ecosystem

Chart on Parent Market
Data Table on - Parent Market

3.2 Market characteristics

Chart on Market characteristics analysis

3.3 Value chain analysis

Chart on Value chain analysis

4. Market Sizing

4.1 Market definition

Data Table on Offerings of companies included in the market definition

4.2 Market segment analysis

Market segments

4.3 Market size 2024

4.4 Market outlook: Forecast for 2024-2029

Chart on Global - Market size and forecast 2024-2029 ($ million)
Data Table on Global - Market size and forecast 2024-2029 ($ million)
Chart on Global Market: Year-over-year growth 2024-2029 (%)
Data Table on Global Market: Year-over-year growth 2024-2029 (%)

5. Historic Market Size

5.1 Global Digital Isolator Market 2019 - 2023

Historic Market Size - Data Table on Global Digital Isolator Market 2019 - 2023 ($ million)

5.2 Type segment analysis 2019 - 2023

Historic Market Size - Type Segment 2019 - 2023 ($ million)

5.3 Technology segment analysis 2019 - 2023

Historic Market Size - Technology Segment 2019 - 2023 ($ million)

5.4 Channel segment analysis 2019 - 2023

Historic Market Size - Channel Segment 2019 - 2023 ($ million)

5.5 End-user segment analysis 2019 - 2023

Historic Market Size - End-user Segment 2019 - 2023 ($ million)

5.6 Geography segment analysis 2019 - 2023

Historic Market Size - Geography Segment 2019 - 2023 ($ million)

5.7 Country segment analysis 2019 - 2023

Historic Market Size - Country Segment 2019 - 2023 ($ million)

6. Qualitative Analysis

6.1 The AI impact on Global Digital Isolator Market

7. Five Forces Analysis

7.1 Five forces summary

Five forces analysis - Comparison between 2024 and 2029

7.2 Bargaining power of buyers

Bargaining power of buyers - Impact of key factors 2024 and 2029

7.3 Bargaining power of suppliers

Bargaining power of suppliers - Impact of key factors in 2024 and 2029

7.4 Threat of new entrants

Threat of new entrants - Impact of key factors in 2024 and 2029

7.5 Threat of substitutes

Threat of substitutes - Impact of key factors in 2024 and 2029

7.6 Threat of rivalry

Threat of rivalry - Impact of key factors in 2024 and 2029

7.7 Market condition

Chart on Market condition - Five forces 2024 and 2029

8. Market Segmentation by Type

8.1 Market segments

Chart on Type - Market share 2024-2029 (%)
Data Table on Type - Market share 2024-2029 (%)

8.2 Comparison by Type

Chart on Comparison by Type
Data Table on Comparison by Type

8.3 Capacitive coupling - Market size and forecast 2024-2029

Chart on Capacitive coupling - Market size and forecast 2024-2029 ($ million)
Data Table on Capacitive coupling - Market size and forecast 2024-2029 ($ million)
Chart on Capacitive coupling - Year-over-year growth 2024-2029 (%)
Data Table on Capacitive coupling - Year-over-year growth 2024-2029 (%)

8.4 Magnetic coupling - Market size and forecast 2024-2029

Chart on Magnetic coupling - Market size and forecast 2024-2029 ($ million)
Data Table on Magnetic coupling - Market size and forecast 2024-2029 ($ million)
Chart on Magnetic coupling - Year-over-year growth 2024-2029 (%)
Data Table on Magnetic coupling - Year-over-year growth 2024-2029 (%)

8.5 Giant magnetoresistive - Market size and forecast 2024-2029

Chart on Giant magnetoresistive - Market size and forecast 2024-2029 ($ million)
Data Table on Giant magnetoresistive - Market size and forecast 2024-2029 ($ million)
Chart on Giant magnetoresistive - Year-over-year growth 2024-2029 (%)
Data Table on Giant magnetoresistive - Year-over-year growth 2024-2029 (%)

8.6 Others - Market size and forecast 2024-2029

Chart on Others - Market size and forecast 2024-2029 ($ million)
Data Table on Others - Market size and forecast 2024-2029 ($ million)
Chart on Others - Year-over-year growth 2024-2029 (%)
Data Table on Others - Year-over-year growth 2024-2029 (%)

8.7 Market opportunity by Type

Market opportunity by Type ($ million)
Data Table on Market opportunity by Type ($ million)

9. Market Segmentation by Technology

9.1 Market segments

Chart on Technology - Market share 2024-2029 (%)
Data Table on Technology - Market share 2024-2029 (%)

9.2 Comparison by Technology

Chart on Comparison by Technology
Data Table on Comparison by Technology

9.3 Capacitive digital isolator - Market size and forecast 2024-2029

Chart on Capacitive digital isolator - Market size and forecast 2024-2029 ($ million)
Data Table on Capacitive digital isolator - Market size and forecast 2024-2029 ($ million)
Chart on Capacitive digital isolator - Year-over-year growth 2024-2029 (%)
Data Table on Capacitive digital isolator - Year-over-year growth 2024-2029 (%)

9.4 Inductive digital isolator - Market size and forecast 2024-2029

Chart on Inductive digital isolator - Market size and forecast 2024-2029 ($ million)
Data Table on Inductive digital isolator - Market size and forecast 2024-2029 ($ million)
Chart on Inductive digital isolator - Year-over-year growth 2024-2029 (%)
Data Table on Inductive digital isolator - Year-over-year growth 2024-2029 (%)

9.5 Optical digital isolator - Market size and forecast 2024-2029

Chart on Optical digital isolator - Market size and forecast 2024-2029 ($ million)
Data Table on Optical digital isolator - Market size and forecast 2024-2029 ($ million)
Chart on Optical digital isolator - Year-over-year growth 2024-2029 (%)
Data Table on Optical digital isolator - Year-over-year growth 2024-2029 (%)

9.6 Market opportunity by Technology

Market opportunity by Technology ($ million)
Data Table on Market opportunity by Technology ($ million)

10. Market Segmentation by Channel

10.1 Market segments

Chart on Channel - Market share 2024-2029 (%)
Data Table on Channel - Market share 2024-2029 (%)

10.2 Comparison by Channel

Chart on Comparison by Channel
Data Table on Comparison by Channel

10.3 4 channel - Market size and forecast 2024-2029

Chart on 4 channel - Market size and forecast 2024-2029 ($ million)
Data Table on 4 channel - Market size and forecast 2024-2029 ($ million)
Chart on 4 channel - Year-over-year growth 2024-2029 (%)
Data Table on 4 channel - Year-over-year growth 2024-2029 (%)

10.4 8 channel - Market size and forecast 2024-2029

Chart on 8 channel - Market size and forecast 2024-2029 ($ million)
Data Table on 8 channel - Market size and forecast 2024-2029 ($ million)
Chart on 8 channel - Year-over-year growth 2024-2029 (%)
Data Table on 8 channel - Year-over-year growth 2024-2029 (%)

10.5 2 channel - Market size and forecast 2024-2029

Chart on 2 channel - Market size and forecast 2024-2029 ($ million)
Data Table on 2 channel - Market size and forecast 2024-2029 ($ million)
Chart on 2 channel - Year-over-year growth 2024-2029 (%)
Data Table on 2 channel - Year-over-year growth 2024-2029 (%)

10.6 6 channel - Market size and forecast 2024-2029

Chart on 6 channel - Market size and forecast 2024-2029 ($ million)
Data Table on 6 channel - Market size and forecast 2024-2029 ($ million)
Chart on 6 channel - Year-over-year growth 2024-2029 (%)
Data Table on 6 channel - Year-over-year growth 2024-2029 (%)

10.7 Others - Market size and forecast 2024-2029

Chart on Others - Market size and forecast 2024-2029 ($ million)
Data Table on Others - Market size and forecast 2024-2029 ($ million)
Chart on Others - Year-over-year growth 2024-2029 (%)
Data Table on Others - Year-over-year growth 2024-2029 (%)

10.8 Market opportunity by Channel

Market opportunity by Channel ($ million)
Data Table on Market opportunity by Channel ($ million)

11. Market Segmentation by End-user

11.1 Market segments

Chart on End-user - Market share 2024-2029 (%)
Data Table on End-user - Market share 2024-2029 (%)

11.2 Comparison by End-user

Chart on Comparison by End-user
Data Table on Comparison by End-user

11.3 Industrial automation - Market size and forecast 2024-2029

Chart on Industrial automation - Market size and forecast 2024-2029 ($ million)
Data Table on Industrial automation - Market size and forecast 2024-2029 ($ million)
Chart on Industrial automation - Year-over-year growth 2024-2029 (%)
Data Table on Industrial automation - Year-over-year growth 2024-2029 (%)

11.4 Automotive - Market size and forecast 2024-2029

Chart on Automotive - Market size and forecast 2024-2029 ($ million)
Data Table on Automotive - Market size and forecast 2024-2029 ($ million)
Chart on Automotive - Year-over-year growth 2024-2029 (%)
Data Table on Automotive - Year-over-year growth 2024-2029 (%)

11.5 Medical devices - Market size and forecast 2024-2029

Chart on Medical devices - Market size and forecast 2024-2029 ($ million)
Data Table on Medical devices - Market size and forecast 2024-2029 ($ million)
Chart on Medical devices - Year-over-year growth 2024-2029 (%)
Data Table on Medical devices - Year-over-year growth 2024-2029 (%)

11.6 Telecommunications - Market size and forecast 2024-2029

Chart on Telecommunications - Market size and forecast 2024-2029 ($ million)
Data Table on Telecommunications - Market size and forecast 2024-2029 ($ million)
Chart on Telecommunications - Year-over-year growth 2024-2029 (%)
Data Table on Telecommunications - Year-over-year growth 2024-2029 (%)

11.7 Others - Market size and forecast 2024-2029

Chart on Others - Market size and forecast 2024-2029 ($ million)
Data Table on Others - Market size and forecast 2024-2029 ($ million)
Chart on Others - Year-over-year growth 2024-2029 (%)
Data Table on Others - Year-over-year growth 2024-2029 (%)

11.8 Market opportunity by End-user

Market opportunity by End-user ($ million)
Data Table on Market opportunity by End-user ($ million)

12. Customer Landscape

12.1 Customer landscape overview

Analysis of price sensitivity, lifecycle, customer purchase basket, adoption rates, and purchase criteria

13. Geographic Landscape

13.1 Geographic segmentation

Chart on Market share by geography 2024-2029 (%)
Data Table on Market share by geography 2024-2029 (%)

13.2 Geographic comparison

Chart on Geographic comparison
Data Table on Geographic comparison

13.3 APAC - Market size and forecast 2024-2029

Chart on APAC - Market size and forecast 2024-2029 ($ million)
Data Table on APAC - Market size and forecast 2024-2029 ($ million)
Chart on APAC - Year-over-year growth 2024-2029 (%)
Data Table on APAC - Year-over-year growth 2024-2029 (%)
Chart on Regional Comparison - APAC
Data Table on Regional Comparison - APAC

13.3.1 China - Market size and forecast 2024-2029

Chart on China - Market size and forecast 2024-2029 ($ million)
Data Table on China - Market size and forecast 2024-2029 ($ million)
Chart on China - Year-over-year growth 2024-2029 (%)
Data Table on China - Year-over-year growth 2024-2029 (%)

13.3.2 Japan - Market size and forecast 2024-2029

Chart on Japan - Market size and forecast 2024-2029 ($ million)
Data Table on Japan - Market size and forecast 2024-2029 ($ million)
Chart on Japan - Year-over-year growth 2024-2029 (%)
Data Table on Japan - Year-over-year growth 2024-2029 (%)

13.3.3 India - Market size and forecast 2024-2029

Chart on India - Market size and forecast 2024-2029 ($ million)
Data Table on India - Market size and forecast 2024-2029 ($ million)
Chart on India - Year-over-year growth 2024-2029 (%)
Data Table on India - Year-over-year growth 2024-2029 (%)

13.3.4 South Korea - Market size and forecast 2024-2029

Chart on South Korea - Market size and forecast 2024-2029 ($ million)
Data Table on South Korea - Market size and forecast 2024-2029 ($ million)
Chart on South Korea - Year-over-year growth 2024-2029 (%)
Data Table on South Korea - Year-over-year growth 2024-2029 (%)

13.3.5 Australia - Market size and forecast 2024-2029

Chart on Australia - Market size and forecast 2024-2029 ($ million)
Data Table on Australia - Market size and forecast 2024-2029 ($ million)
Chart on Australia - Year-over-year growth 2024-2029 (%)
Data Table on Australia - Year-over-year growth 2024-2029 (%)

13.3.6 Indonesia - Market size and forecast 2024-2029

Chart on Indonesia - Market size and forecast 2024-2029 ($ million)
Data Table on Indonesia - Market size and forecast 2024-2029 ($ million)
Chart on Indonesia - Year-over-year growth 2024-2029 (%)
Data Table on Indonesia - Year-over-year growth 2024-2029 (%)

13.4 North America - Market size and forecast 2024-2029

Chart on North America - Market size and forecast 2024-2029 ($ million)
Data Table on North America - Market size and forecast 2024-2029 ($ million)
Chart on North America - Year-over-year growth 2024-2029 (%)
Data Table on North America - Year-over-year growth 2024-2029 (%)
Chart on Regional Comparison - North America
Data Table on Regional Comparison - North America

13.4.1 US - Market size and forecast 2024-2029

Chart on US - Market size and forecast 2024-2029 ($ million)
Data Table on US - Market size and forecast 2024-2029 ($ million)
Chart on US - Year-over-year growth 2024-2029 (%)
Data Table on US - Year-over-year growth 2024-2029 (%)

13.4.2 Canada - Market size and forecast 2024-2029

Chart on Canada - Market size and forecast 2024-2029 ($ million)
Data Table on Canada - Market size and forecast 2024-2029 ($ million)
Chart on Canada - Year-over-year growth 2024-2029 (%)
Data Table on Canada - Year-over-year growth 2024-2029 (%)

13.4.3 Mexico - Market size and forecast 2024-2029

Chart on Mexico - Market size and forecast 2024-2029 ($ million)
Data Table on Mexico - Market size and forecast 2024-2029 ($ million)
Chart on Mexico - Year-over-year growth 2024-2029 (%)
Data Table on Mexico - Year-over-year growth 2024-2029 (%)

13.5 Europe - Market size and forecast 2024-2029

Chart on Europe - Market size and forecast 2024-2029 ($ million)
Data Table on Europe - Market size and forecast 2024-2029 ($ million)
Chart on Europe - Year-over-year growth 2024-2029 (%)
Data Table on Europe - Year-over-year growth 2024-2029 (%)
Chart on Regional Comparison - Europe
Data Table on Regional Comparison - Europe

13.5.1 Germany - Market size and forecast 2024-2029

Chart on Germany - Market size and forecast 2024-2029 ($ million)
Data Table on Germany - Market size and forecast 2024-2029 ($ million)
Chart on Germany - Year-over-year growth 2024-2029 (%)
Data Table on Germany - Year-over-year growth 2024-2029 (%)

13.5.2 UK - Market size and forecast 2024-2029

Chart on UK - Market size and forecast 2024-2029 ($ million)
Data Table on UK - Market size and forecast 2024-2029 ($ million)
Chart on UK - Year-over-year growth 2024-2029 (%)
Data Table on UK - Year-over-year growth 2024-2029 (%)

13.5.3 Italy - Market size and forecast 2024-2029

Chart on Italy - Market size and forecast 2024-2029 ($ million)
Data Table on Italy - Market size and forecast 2024-2029 ($ million)
Chart on Italy - Year-over-year growth 2024-2029 (%)
Data Table on Italy - Year-over-year growth 2024-2029 (%)

13.5.4 France - Market size and forecast 2024-2029

Chart on France - Market size and forecast 2024-2029 ($ million)
Data Table on France - Market size and forecast 2024-2029 ($ million)
Chart on France - Year-over-year growth 2024-2029 (%)
Data Table on France - Year-over-year growth 2024-2029 (%)

13.5.5 The Netherlands - Market size and forecast 2024-2029

Chart on The Netherlands - Market size and forecast 2024-2029 ($ million)
Data Table on The Netherlands - Market size and forecast 2024-2029 ($ million)
Chart on The Netherlands - Year-over-year growth 2024-2029 (%)
Data Table on The Netherlands - Year-over-year growth 2024-2029 (%)

13.5.6 Spain - Market size and forecast 2024-2029

Chart on Spain - Market size and forecast 2024-2029 ($ million)
Data Table on Spain - Market size and forecast 2024-2029 ($ million)
Chart on Spain - Year-over-year growth 2024-2029 (%)
Data Table on Spain - Year-over-year growth 2024-2029 (%)

13.6 South America - Market size and forecast 2024-2029

Chart on South America - Market size and forecast 2024-2029 ($ million)
Data Table on South America - Market size and forecast 2024-2029 ($ million)
Chart on South America - Year-over-year growth 2024-2029 (%)
Data Table on South America - Year-over-year growth 2024-2029 (%)
Chart on Regional Comparison - South America
Data Table on Regional Comparison - South America

13.6.1 Brazil - Market size and forecast 2024-2029

Chart on Brazil - Market size and forecast 2024-2029 ($ million)
Data Table on Brazil - Market size and forecast 2024-2029 ($ million)
Chart on Brazil - Year-over-year growth 2024-2029 (%)
Data Table on Brazil - Year-over-year growth 2024-2029 (%)

13.6.2 Argentina - Market size and forecast 2024-2029

Chart on Argentina - Market size and forecast 2024-2029 ($ million)
Data Table on Argentina - Market size and forecast 2024-2029 ($ million)
Chart on Argentina - Year-over-year growth 2024-2029 (%)
Data Table on Argentina - Year-over-year growth 2024-2029 (%)

13.6.3 Colombia - Market size and forecast 2024-2029

Chart on Colombia - Market size and forecast 2024-2029 ($ million)
Data Table on Colombia - Market size and forecast 2024-2029 ($ million)
Chart on Colombia - Year-over-year growth 2024-2029 (%)
Data Table on Colombia - Year-over-year growth 2024-2029 (%)

13.7 Middle East and Africa - Market size and forecast 2024-2029

Chart on Middle East and Africa - Market size and forecast 2024-2029 ($ million)
Data Table on Middle East and Africa - Market size and forecast 2024-2029 ($ million)
Chart on Middle East and Africa - Year-over-year growth 2024-2029 (%)
Data Table on Middle East and Africa - Year-over-year growth 2024-2029 (%)
Chart on Regional Comparison - Middle East and Africa
Data Table on Regional Comparison - Middle East and Africa

13.7.1 UAE - Market size and forecast 2024-2029

Chart on UAE - Market size and forecast 2024-2029 ($ million)
Data Table on UAE - Market size and forecast 2024-2029 ($ million)
Chart on UAE - Year-over-year growth 2024-2029 (%)
Data Table on UAE - Year-over-year growth 2024-2029 (%)

13.7.2 Israel - Market size and forecast 2024-2029

Chart on Israel - Market size and forecast 2024-2029 ($ million)
Data Table on Israel - Market size and forecast 2024-2029 ($ million)
Chart on Israel - Year-over-year growth 2024-2029 (%)
Data Table on Israel - Year-over-year growth 2024-2029 (%)

13.7.3 South Africa - Market size and forecast 2024-2029

Chart on South Africa - Market size and forecast 2024-2029 ($ million)
Data Table on South Africa - Market size and forecast 2024-2029 ($ million)
Chart on South Africa - Year-over-year growth 2024-2029 (%)
Data Table on South Africa - Year-over-year growth 2024-2029 (%)

13.7.4 Saudi Arabia - Market size and forecast 2024-2029

Chart on Saudi Arabia - Market size and forecast 2024-2029 ($ million)
Data Table on Saudi Arabia - Market size and forecast 2024-2029 ($ million)
Chart on Saudi Arabia - Year-over-year growth 2024-2029 (%)
Data Table on Saudi Arabia - Year-over-year growth 2024-2029 (%)

13.7.5 Turkey - Market size and forecast 2024-2029

Chart on Turkey - Market size and forecast 2024-2029 ($ million)
Data Table on Turkey - Market size and forecast 2024-2029 ($ million)
Chart on Turkey - Year-over-year growth 2024-2029 (%)
Data Table on Turkey - Year-over-year growth 2024-2029 (%)

13.8 Market opportunity by geography

Market opportunity by geography ($ million)
Data Tables on Market opportunity by geography ($ million)

14. Drivers, Challenges, and Opportunity

14.1 Market drivers

Escalating adoption of electric vehicles and proliferation of advanced automotive electronics
Rise of industrial automation and advent of industry 4.0
Growing demand in healthcare sector and advancements in medical technology

14.2 Market challenges

Intensifying cost pressures and competition
Heightened design complexity and integration hurdles
Navigating supply chain volatility and raw material price fluctuations

14.3 Impact of drivers and challenges

Impact of drivers and challenges in 2024 and 2029

14.4 Market opportunities

Proliferation in automotive, especially electric vehicles
Expansion of industrial automation and IoT
Technological advancements and miniaturization driving performance and adoption

15. Competitive Landscape

15.1 Overview

15.2

Overview on criticality of inputs and factors of differentiation

15.3 Landscape disruption

Overview on factors of disruption

15.4 Industry risks

Impact of key risks on business

16. Competitive Analysis

16.1 Companies profiled

Companies covered

16.2 Company ranking index

16.3 Market positioning of companies

Matrix on companies position and classification

16.4 Analog Devices Inc.

Analog Devices Inc. - Overview
Analog Devices Inc. - Business segments
Analog Devices Inc. - Key news
Analog Devices Inc. - Key offerings
Analog Devices Inc. - Segment focus
SWOT

16.5 Broadcom Inc.

Broadcom Inc. - Overview
Broadcom Inc. - Business segments
Broadcom Inc. - Key news
Broadcom Inc. - Key offerings
Broadcom Inc. - Segment focus
SWOT

16.6 Infineon Technologies AG

Infineon Technologies AG - Overview
Infineon Technologies AG - Business segments
Infineon Technologies AG - Key news
Infineon Technologies AG - Key offerings
Infineon Technologies AG - Segment focus
SWOT

16.7 Monolithic Power Systems Inc.

Monolithic Power Systems Inc. - Overview
Monolithic Power Systems Inc. - Product / Service
Monolithic Power Systems Inc. - Key offerings
SWOT

16.8 Murata Manufacturing Co. Ltd.

Murata Manufacturing Co. Ltd. - Overview
Murata Manufacturing Co. Ltd. - Business segments
Murata Manufacturing Co. Ltd. - Key news
Murata Manufacturing Co. Ltd. - Key offerings
Murata Manufacturing Co. Ltd. - Segment focus
SWOT

16.9 NVE Corp.

NVE Corp. - Overview
NVE Corp. - Product / Service
NVE Corp. - Key offerings
SWOT

16.10 NXP Semiconductors NV

NXP Semiconductors NV - Overview
NXP Semiconductors NV - Product / Service
NXP Semiconductors NV - Key offerings
SWOT

16.11 ON Semiconductor Corp.

ON Semiconductor Corp. - Overview
ON Semiconductor Corp. - Business segments
ON Semiconductor Corp. - Key news
ON Semiconductor Corp. - Key offerings
ON Semiconductor Corp. - Segment focus
SWOT

16.12 Renesas Electronics Corp.

Renesas Electronics Corp. - Overview
Renesas Electronics Corp. - Product / Service
Renesas Electronics Corp. - Key offerings
SWOT

16.13 ROHM Co. Ltd.

ROHM Co. Ltd. - Overview
ROHM Co. Ltd. - Business segments
ROHM Co. Ltd. - Key news
ROHM Co. Ltd. - Key offerings
ROHM Co. Ltd. - Segment focus
SWOT

16.14 Skyworks Solutions Inc.

Skyworks Solutions Inc. - Overview
Skyworks Solutions Inc. - Product / Service
Skyworks Solutions Inc. - Key offerings
SWOT

16.15 STMicroelectronics NV

STMicroelectronics NV - Overview
STMicroelectronics NV - Business segments
STMicroelectronics NV - Key news
STMicroelectronics NV - Key offerings
STMicroelectronics NV - Segment focus
SWOT

16.16 Suzhou Novosense Microelectronics Co.Ltd.

Suzhou Novosense Microelectronics Co.Ltd. - Overview
Suzhou Novosense Microelectronics Co.Ltd. - Product / Service
Suzhou Novosense Microelectronics Co.Ltd. - Key offerings
SWOT

16.17 Texas Instruments Inc.

Texas Instruments Inc. - Overview
Texas Instruments Inc. - Business segments
Texas Instruments Inc. - Key offerings
Texas Instruments Inc. - Segment focus
SWOT

16.18 Toshiba Corp.

Toshiba Corp. - Overview
Toshiba Corp. - Business segments
Toshiba Corp. - Key news
Toshiba Corp. - Key offerings
Toshiba Corp. - Segment focus
SWOT

17. Appendix

17.1 Scope of the report

Market definition
Objectives
Notes and caveats

17.2 Inclusions and exclusions checklist

Inclusions checklist
Exclusions checklist

17.3 Currency conversion rates for US$

17.4 Research methodology

17.5 Data procurement

Information sources

17.6 Data validation

17.7 Validation techniques employed for market sizing

17.8 Data synthesis

17.9 360 degree market analysis

17.10 List of abbreviations

Research Methodology

Technavio presents a detailed picture of the market by way of study, synthesis, and summation of data from multiple sources. The analysts have presented the various facets of the market with a particular focus on identifying the key industry influencers. The data thus presented is comprehensive, reliable, and the result of extensive research, both primary and secondary.

INFORMATION SOURCES

Primary sources

  • Manufacturers and suppliers
  • Channel partners
  • Industry experts
  • Strategic decision makers

Secondary sources

  • Industry journals and periodicals
  • Government data
  • Financial reports of key industry players
  • Historical data
  • Press releases

DATA ANALYSIS

Data Synthesis

  • Collation of data
  • Estimation of key figures
  • Analysis of derived insights

Data Validation

  • Triangulation with data models
  • Reference against proprietary databases
  • Corroboration with industry experts

REPORT WRITING

Qualitative

  • Market drivers
  • Market challenges
  • Market trends
  • Five forces analysis

Quantitative

  • Market size and forecast
  • Market segmentation
  • Geographical insights
  • Competitive landscape

Interested in this report?

Get your sample now to see our research methodology and insights!

Download Now

Frequently Asked Questions

Digital Isolator market growth will increase by USD 757.4 million during 2025-2029.

The Digital Isolator market is expected to grow at a CAGR of 6% during 2025-2029.

Digital Isolator market is segmented by Type (Capacitive coupling, Magnetic coupling, Giant magnetoresistive, Others) Technology (Capacitive digital isolator, Inductive digital isolator, Optical digital isolator) Channel (4 channel, 8 channel, 2 channel, 6 channel, Others) End-user (Industrial automation, Automotive, Medical devices, Telecommunications, Others)

Advantech Co. Ltd., Analog Devices Inc., Broadcom Inc., Infineon Technologies AG, Monolithic Power Systems Inc., Murata Manufacturing Co. Ltd., NVE Corp., NXP Semiconductors NV, ON Semiconductor Corp., Renesas Electronics Corp., ROHM Co. Ltd., Skyworks Solutions Inc., STMicroelectronics NV, Suzhou Novosense Microelectronics Co.Ltd., Texas Instruments Inc., Toshiba Corp., Vicor Corp. are a few of the key vendors in the Digital Isolator market.

APAC will register the highest growth rate of 44.3% among the other regions. Therefore, the Digital Isolator market in APAC is expected to garner significant business opportunities for the vendors during the forecast period.

China, Japan, India, South Korea, Australia, Indonesia, US, Canada, Mexico, Germany, UK, Italy, France, The Netherlands, Spain, Brazil, Argentina, Colombia, UAE, Israel, South Africa, Saudi Arabia, Turkey

  • Escalating adoption of electric vehicles and proliferation of advanced automotive electronics is the driving factor this market.

The Digital Isolator market vendors should focus on grabbing business opportunities from the Type segment as it accounted for the largest market share in the base year.