Digital Product Passport Platforms For Manufacturing Market Analysis, Size, and Forecast 2026-2030: Europe (Germany, UK, and France), North America (US, Canada, and Mexico), APAC (China, India, and Japan), Middle East and Africa (Saudi Arabia, UAE, and South Africa), South America (Brazil, Argentina, and Colombia), and Rest of World (ROW)

Digital Product Passport Platforms For Manufacturing Market Analysis, Size, and Forecast 2026-2030:
Europe (Germany, UK, and France), North America (US, Canada, and Mexico), APAC (China, India, and Japan), Middle East and Africa (Saudi Arabia, UAE, and South Africa), South America (Brazil, Argentina, and Colombia), and Rest of World (ROW)

Published: Apr 2026 308 Pages SKU: IRTNTR81391

Market Overview at a Glance

$4.09 B
Market Opportunity
36.1%
CAGR 2025 - 2030
38.1%
Europe Growth
$565.2 Mn
Software segment 2024

Digital Product Passport Platforms For Manufacturing Market Size 2026-2030

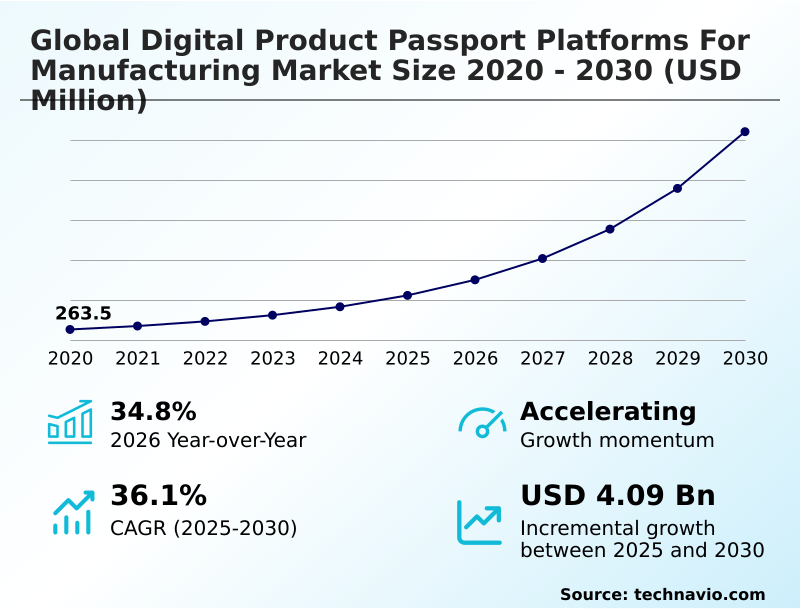
The digital product passport platforms for manufacturing market size is valued to increase by USD 4.09 billion, at a CAGR of 36.1% from 2025 to 2030. Regulatory frameworks and mandates promoting circular economy principles will drive the digital product passport platforms for manufacturing market.

Major Market Trends & Insights

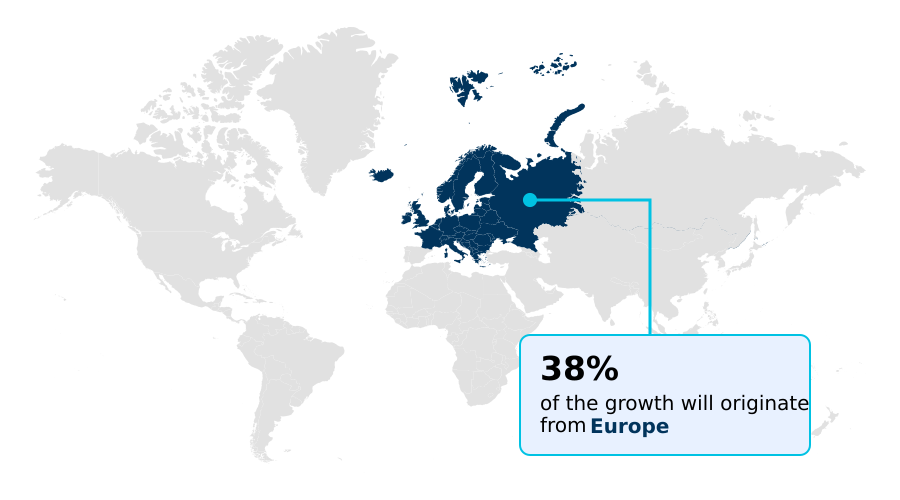
  • Europe dominated the market and accounted for a 38.1% growth during the forecast period.
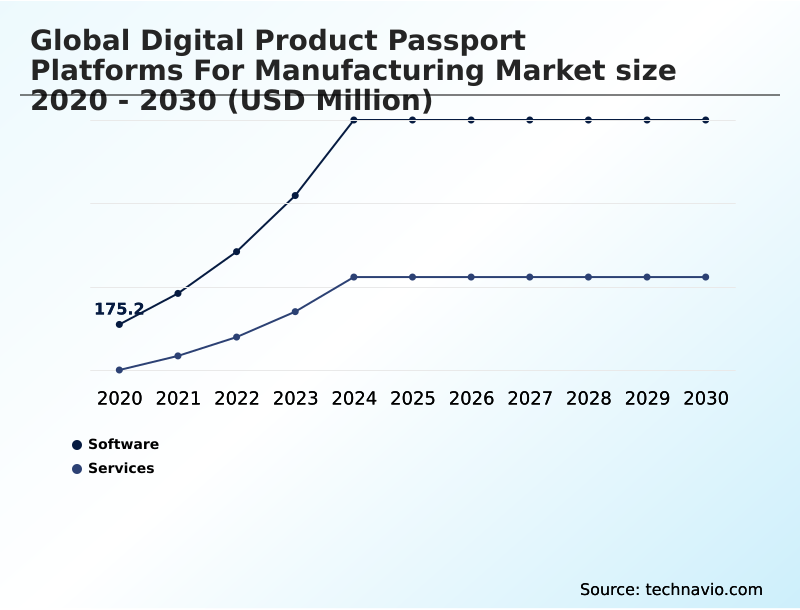
  • By Component - Software segment was valued at USD 565.2 million in 2024
  • By Deployment - Cloud based segment accounted for the largest market revenue share in 2024

Market Size & Forecast

  • Market Opportunities: USD 4.94 billion
  • Market Future Opportunities: USD 4.09 billion
  • CAGR from 2025 to 2030 : 36.1%

Market Summary

  • The digital product passport platforms for manufacturing market is expanding as industries pivot towards sustainable and transparent operations. These platforms are not merely data repositories; they are dynamic ecosystems built on technologies like blockchain for immutable data records and IoT for real-time data collection.
  • The core function is to create a verifiable digital identity for every physical product, detailing its journey from raw material to end-of-life recycling protocols. This enables precise carbon footprint calculation and facilitates regulatory compliance automation, which are now critical business requirements.
  • For instance, an automotive OEM can use a passport platform to track the cobalt in its EV batteries, ensuring ethical sourcing and simplifying compliance with international regulations. The seamless enterprise resource planning (ERP) integration allows for a unified view of operations, improving efficiency.
  • However, the market also faces challenges related to data standardization and the high costs of integrating with legacy systems. The need for cryptographic verification is paramount to protect sensitive intellectual property while sharing necessary sustainability data with consumers and regulators, defining the central challenge for platform providers.

What will be the Size of the Digital Product Passport Platforms For Manufacturing Market during the forecast period?

Get Key Insights on Market Forecast (PDF) Request Free Sample

How is the Digital Product Passport Platforms For Manufacturing Market Segmented?

The digital product passport platforms for manufacturing industry research report provides comprehensive data (region-wise segment analysis), with forecasts and estimates in "USD million" for the period 2026-2030, as well as historical data from 2020-2024 for the following segments.

  • Component
    • Software
    • Services
  • Deployment
    • Cloud based
    • On premises
    • Hybrid
  • End-user
    • Automotive and mobility
    • Electronics and electricals
    • Industrial and chemicals
    • Textile and apparel
    • Food and beverages
  • Geography
    • Europe
      • Germany
      • UK
      • France
    • North America
      • US
      • Canada
      • Mexico
    • APAC
      • China
      • India
      • Japan
    • Middle East and Africa
      • Saudi Arabia
      • UAE
      • South Africa
    • South America
      • Brazil
      • Argentina
      • Colombia
    • Rest of World (ROW)

By Component Insights

The software segment is estimated to witness significant growth during the forecast period.

The software segment is the core of the digital product passport platforms for manufacturing market, providing the essential infrastructure for supply chain transparency and enabling circular economy frameworks.

These solutions leverage decentralized ledger technology and industrial internet of things (IIoT) to create immutable records of material provenance tracking. Functionality extends to product lifecycle management (PLM) and advanced digital twin integration, allowing for predictive analytics.

As ecodesign for sustainable products becomes standard, software must support complex data models, including scope 3 emissions reporting. This enhances supply chain resilience and opens new servitization business models.

Firms using this software report a 15% improvement in identifying supply chain inefficiencies, enabling better remanufacturing and repair cycles and creating opportunities for data monetization strategies.

Request Free Sample

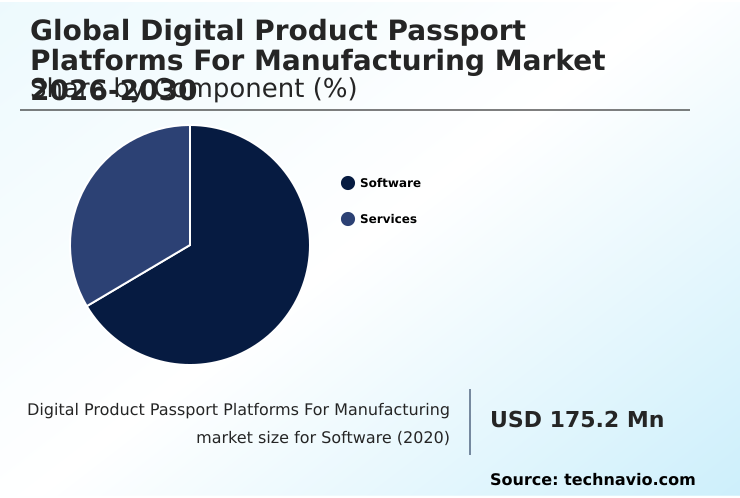
The Software segment was valued at USD 565.2 million in 2024 and showed a gradual increase during the forecast period.

Request Free Sample

Regional Analysis

Europe is estimated to contribute 38.1% to the growth of the global market during the forecast period.Technavio’s analysts have elaborately explained the regional trends and drivers that shape the market during the forecast period.

See How Digital Product Passport Platforms For Manufacturing Market Demand is Rising in Europe Request Free Sample

Europe leads the market, accounting for over 38% of the incremental growth, driven by stringent regulatory reporting automation mandates like the ESPR. This forces a focus on raw material traceability and ethical sourcing verification.

In North America, adoption is motivated by supply chain due diligence and risk mitigation, with a strong focus on component traceability in the automotive and aerospace sectors. Firms in this region achieve a 15% greater efficiency in waste generation monitoring.

APAC is the fastest-growing region, with its manufacturing hubs leveraging circularity data sharing to meet the sustainable procurement strategies of Western partners.

The success of global adoption hinges on creating harmonized data schemas that allow for a consistent material circularity indicator across all regions.

Market Dynamics

Our researchers analyzed the data with 2025 as the base year, along with the key drivers, trends, and challenges. A holistic analysis of drivers will help companies refine their marketing strategies to gain a competitive advantage.

  • Navigating the digital product passport landscape requires a deep understanding of specific use cases. For instance, the demand for blockchain for tracking EV battery materials is driven by regulations mandating transparency in critical mineral supply chains. Similarly, the digital product passport for textile industry compliance is becoming a standard requirement for brands exporting to the EU.
  • The core technology often involves IIoT sensors for real-time emissions monitoring, which feed data into centralized platforms. A key challenge is integrating PLM with digital passport platforms to create a single source of truth for product data. This integration is crucial for securing proprietary data in shared supply chains, a major concern for all manufacturers.
  • The digital twin for industrial equipment lifecycle offers a path to predictive maintenance, while verifying material origin for regulatory reporting is the primary compliance use case. Enterprises are increasingly focused on automating carbon footprint data collection to improve accuracy and reduce manual effort.
  • However, the cost of implementing digital passport systems remains a barrier, forcing a careful analysis of the benefits of cloud vs on-premise DPP. For specific sectors, like the DPP platform for automotive supply chain, interoperability is key. Ultimately, these systems are essential for ESG reporting with digital product passports and enabling circular economy data management for electronics.
  • The industry's success hinges on ensuring data interoperability across DPP platforms and using SSI for secure product credentials to build trust and mitigate risks like greenwashing.
  • The role of AI in analyzing DPP data is expanding, helping to identify patterns in component traceability in aerospace manufacturing, address data privacy challenges in digital passports, and manage the complexities of mitigating greenwashing with verifiable data.

What are the key market drivers leading to the rise in the adoption of Digital Product Passport Platforms For Manufacturing Industry?

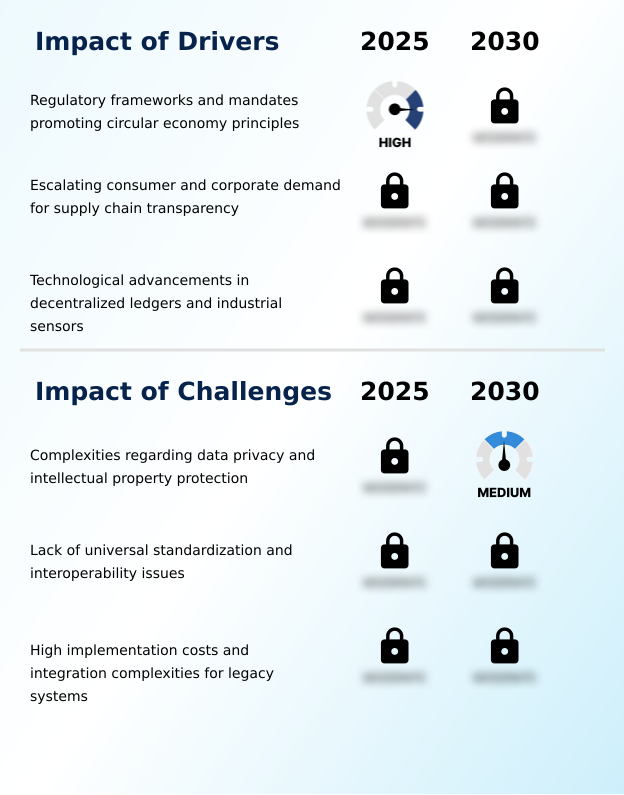
  • The primary market driver is the proliferation of regulatory frameworks and mandates that promote circular economy principles and require supply chain transparency.

  • Regulatory pressure is a primary driver, compelling organizations to adopt platforms for greenhouse gas emissions tracking and detailed lifecycle assessment (LCA).
  • Adherence to smart manufacturing principles is another key factor, with firms reporting up to a 20% improvement in resource utilization optimization after implementation.
  • Escalating consumer demand for transparency drives the need for product authenticity verification, directly impacting brand trust and market share. To manage this effectively, the development of data interoperability standards and cross-industry data protocols is crucial.
  • The technological maturation of smart sensor integration and solutions for legacy system interoperability lowers adoption barriers, with implementation times reduced by 30% in newer platforms.
  • This combination of regulatory mandates and technological readiness creates a compelling case for investment, primarily for compliance risk mitigation.

What are the market trends shaping the Digital Product Passport Platforms For Manufacturing Industry?

  • The integration of digital twins is a key market trend, enabling predictive maintenance and comprehensive lifecycle management for industrial assets.

  • A primary trend is the fusion of digital twins with product passports for advanced asset lifecycle management and to power predictive maintenance models, reducing equipment downtime by up to 25%. This creates a unique digital identity that evolves with the asset.
  • Furthermore, platforms are becoming sophisticated tools for sustainable sourcing verification and automated ESG data reporting, which is critical for brand reputation management. Companies leveraging these systems see a 40% increase in the accuracy of their sustainability claims validation. The integration of consumer engagement platforms directly into the passport allows for enhanced supply chain traceability and direct-to-consumer communication.
  • This facilitates reverse logistics optimization for returns and recycling and fosters trust through transparent multi-stakeholder data sharing, moving beyond simple compliance.

What challenges does the Digital Product Passport Platforms For Manufacturing Industry face during its growth?

  • A key industry challenge is navigating the complexities of data privacy and intellectual property protection while meeting transparency mandates.

  • A significant challenge is ensuring digital thread continuity and total quality assurance across fragmented supply chains. While platforms aim to provide supply chain visibility and calculate product carbon footprint (PCF), achieving this requires trust, which is hindered by concerns over intellectual property protection and data sovereignty management.
  • Implementing robust cybersecurity in supply chains is complex, as a single vulnerability can compromise an entire network. Deploying decentralized identity (SSI) can address some security concerns but adds another layer of technical complexity. Furthermore, while these systems aid in anti-counterfeiting measures, the high cost of implementation can be prohibitive, with initial investments being 50% higher than traditional ERP module add-ons.
  • The use of virtual twin simulation to test data-sharing protocols before live deployment is becoming a necessary, yet expensive, step to mitigate these risks.

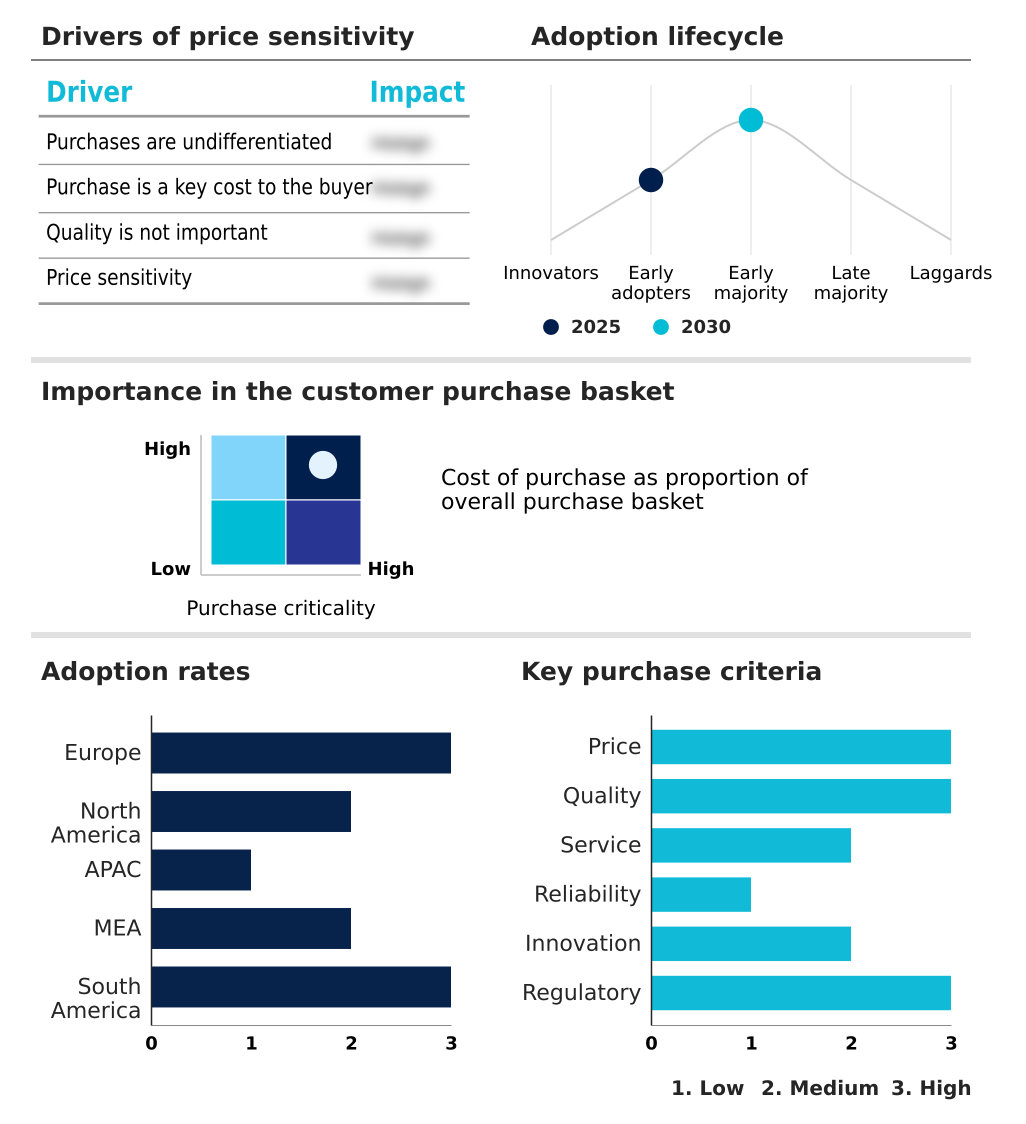
Exclusive Technavio Analysis on Customer Landscape

The digital product passport platforms for manufacturing market forecasting report includes the adoption lifecycle of the market, covering from the innovator’s stage to the laggard’s stage. It focuses on adoption rates in different regions based on penetration. Furthermore, the digital product passport platforms for manufacturing market report also includes key purchase criteria and drivers of price sensitivity to help companies evaluate and develop their market growth analysis strategies.

Customer Landscape of Digital Product Passport Platforms For Manufacturing Industry

Competitive Landscape

Companies are implementing various strategies, such as strategic alliances, digital product passport platforms for manufacturing market forecast, partnerships, mergers and acquisitions, geographical expansion, and product/service launches, to enhance their presence in the industry.

Arianee - Platforms provide end-to-end product lifecycle transparency, utilizing AI and blockchain for secure, verifiable data on material origins, ESG metrics, and carbon footprints across industrial supply chains.

The industry research and growth report includes detailed analyses of the competitive landscape of the market and information about key companies, including:

  • Arianee
  • Authena AG
  • Avery Dennison Corp.
  • BanQu
  • Circularise
  • Circulor
  • Dassault Systemes SE
  • DNV Group AS
  • IBM Corp.
  • iPoint-systems gmbh
  • Kezzler AS
  • Minespider GmbH
  • Protokol B.V.
  • PSQR
  • PTC Inc.
  • SAP SE
  • Siemens AG
  • Spherity GmbH
  • TrusTrace

Qualitative and quantitative analysis of companies has been conducted to help clients understand the wider business environment as well as the strengths and weaknesses of key industry players. Data is qualitatively analyzed to categorize companies as pure play, category-focused, industry-focused, and diversified; it is quantitatively analyzed to categorize companies as dominant, leading, strong, tentative, and weak.

Recent Development and News in Digital product passport platforms for manufacturing market

  • In May, 2025, The Global Circular Economy Forum announced the formation of the 'Interoperable Passport Alliance' (IPA), a cross-industry consortium to establish universal data standards for digital product passports, with founding members from the automotive, electronics, and textile sectors.
  • In March, 2025, Siemens AG completed the acquisition of Altair Engineering Inc., integrating Altair's advanced simulation and AI capabilities into its Xcelerator portfolio to create a comprehensive digital twin and product passport offering for industrial clients.
  • In January, 2025, SAP SE launched its 'Green Track' solution, a new cloud-native platform specifically designed to help manufacturers comply with the EU's Ecodesign for Sustainable Products Regulation (ESPR) by automating carbon footprint tracking and material lifecycle data management.
  • In November, 2024, Circulor announced it had secured USD 50 million in Series C funding to expand its industrial supply chain traceability platform into Asia-Pacific markets and enhance its capabilities for tracking critical minerals in electric vehicle batteries.

Dive into Technavio’s robust research methodology, blending expert interviews, extensive data synthesis, and validated models for unparalleled Digital Product Passport Platforms For Manufacturing Market insights. See full methodology.

Market Scope
Page number 308
Base year 2025
Historic period 2020-2024
Forecast period 2026-2030
Growth momentum & CAGR Accelerate at a CAGR of 36.1%
Market growth 2026-2030 USD 4092.7 million
Market structure Fragmented
YoY growth 2025-2026(%) 34.8%
Key countries Germany, UK, France, Italy, Spain, The Netherlands, US, Canada, Mexico, China, India, Japan, South Korea, Australia, Indonesia, Saudi Arabia, UAE, South Africa, Israel, Turkey, Brazil, Argentina and Colombia
Competitive landscape Leading Companies, Market Positioning of Companies, Competitive Strategies, and Industry Risks

Request Free Sample

Research Analyst Overview

  • The market is rapidly evolving from a niche compliance tool to a cornerstone of smart manufacturing principles. At its core, the technology leverages decentralized ledger technology to ensure immutable data records for complete supply chain traceability. This enhanced supply chain visibility is critical for sustainable sourcing verification and precise product carbon footprint (PCF) tracking.
  • Successful enterprise resource planning (ERP) integration is fundamental, allowing for streamlined regulatory compliance automation and detailed lifecycle assessment (LCA). Boardroom decisions are now directly influenced by ESG data reporting capabilities, with firms using advanced platforms reporting a 20% reduction in compliance auditing costs. The focus is on resource utilization optimization through real-time data collection and asset lifecycle management.
  • Key functionalities include material provenance tracking, component traceability, and end-of-life recycling protocols, all validated through cryptographic verification. Ultimately, these platforms enable circular economy frameworks by providing the data needed for waste generation monitoring and achieving circularity data sharing for raw material traceability and ethical sourcing verification.
  • This is supported by digital twin integration and decentralized identity (SSI) for secure, comprehensive product lifecycle management (PLM) and anti-counterfeiting measures.

What are the Key Data Covered in this Digital Product Passport Platforms For Manufacturing Market Research and Growth Report?

  • What is the expected growth of the Digital Product Passport Platforms For Manufacturing Market between 2026 and 2030?

    • USD 4.09 billion, at a CAGR of 36.1%

  • What segmentation does the market report cover?

    • The report is segmented by Component (Software, and Services), Deployment (Cloud based, On premises, and Hybrid), End-user (Automotive and mobility, Electronics and electricals, Industrial and chemicals, Textile and apparel, and Food and beverages) and Geography (Europe, North America, APAC, Middle East and Africa, South America)

  • Which regions are analyzed in the report?

    • Europe, North America, APAC, Middle East and Africa and South America

  • What are the key growth drivers and market challenges?

    • Regulatory frameworks and mandates promoting circular economy principles, Complexities regarding data privacy and intellectual property protection

  • Who are the major players in the Digital Product Passport Platforms For Manufacturing Market?

    • Arianee, Authena AG, Avery Dennison Corp., BanQu, Circularise, Circulor, Dassault Systemes SE, DNV Group AS, IBM Corp., iPoint-systems gmbh, Kezzler AS, Minespider GmbH, Protokol B.V., PSQR, PTC Inc., SAP SE, Siemens AG, Spherity GmbH and TrusTrace

Market Research Insights

  • The market is defined by a push for deep supply chain due diligence, driven by complex regulations. Adopting harmonized data schemas is critical for value chain optimization, with companies that standardize reporting an 18% improvement in operational efficiency gains.
  • Platforms now focus on sustainable procurement strategies by providing metrics like the material circularity indicator, which is becoming a key performance indicator. The integration of automated tools for asset performance monitoring and regulatory reporting automation is essential for stakeholder trust building. Early adopters of these integrated systems report a 15% reduction in compliance-related costs.
  • This shift transforms platforms from simple tracking tools into strategic assets for enterprise-wide decision-making and risk management.

We can help! Our analysts can customize this digital product passport platforms for manufacturing market research report to meet your requirements.

Get in touch

1. Executive Summary

1.1 Market overview

Executive Summary - Chart on Market Overview
Executive Summary - Data Table on Market Overview
Executive Summary - Chart on Global Market Characteristics
Executive Summary - Chart on Market by Geography
Executive Summary - Chart on Market Segmentation by Component
Executive Summary - Chart on Market Segmentation by Deployment
Executive Summary - Chart on Market Segmentation by End-user
Executive Summary - Chart on Incremental Growth
Executive Summary - Data Table on Incremental Growth
Executive Summary - Chart on Company Market Positioning

2. Technavio Analysis

2.1 Analysis of price sensitivity, lifecycle, customer purchase basket, adoption rates, and purchase criteria

2.2 Criticality of inputs and Factors of differentiation

Chart on Overview on criticality of inputs and factors of differentiation

2.3 Factors of disruption

Chart on Overview on factors of disruption

2.4 Impact of drivers and challenges

Chart on Impact of drivers and challenges in 2025 and 2030

3. Market Landscape

3.1 Market ecosystem

Chart on Parent Market
Data Table on - Parent Market

3.2 Market characteristics

Chart on Market characteristics analysis

3.3 Value chain analysis

Chart on Value chain analysis

4. Market Sizing

4.1 Market definition

Data Table on Offerings of companies included in the market definition

4.2 Market segment analysis

Market segments

4.3 Market size 2025

4.4 Market outlook: Forecast for 2025-2030

Chart on Global - Market size and forecast 2025-2030 ($ million)
Data Table on Global - Market size and forecast 2025-2030 ($ million)
Chart on Global Market: Year-over-year growth 2025-2030 (%)
Data Table on Global Market: Year-over-year growth 2025-2030 (%)

5. Historic Market Size

5.1 Global Digital Product Passport Platforms For Manufacturing Market 2020 - 2024

Historic Market Size - Data Table on Global Digital Product Passport Platforms For Manufacturing Market 2020 - 2024 ($ million)

5.2 Component segment analysis 2020 - 2024

Historic Market Size - Component Segment 2020 - 2024 ($ million)

5.3 Deployment segment analysis 2020 - 2024

Historic Market Size - Deployment Segment 2020 - 2024 ($ million)

5.4 End-user segment analysis 2020 - 2024

Historic Market Size - End-user Segment 2020 - 2024 ($ million)

5.5 Geography segment analysis 2020 - 2024

Historic Market Size - Geography Segment 2020 - 2024 ($ million)

5.6 Country segment analysis 2020 - 2024

Historic Market Size - Country Segment 2020 - 2024 ($ million)

6. Qualitative Analysis

6.1 Impact of AI on Global Digital Product Passport Platforms for Manufacturing Market

6.2 Impact of Geopolitical Conflicts on Global Digital Product Passport Platforms for Manufacturing Market

7. Five Forces Analysis

7.1 Five forces summary

Five forces analysis - Comparison between 2025 and 2030

7.2 Bargaining power of buyers

Bargaining power of buyers - Impact of key factors 2025 and 2030

7.3 Bargaining power of suppliers

Bargaining power of suppliers - Impact of key factors in 2025 and 2030

7.4 Threat of new entrants

Threat of new entrants - Impact of key factors in 2025 and 2030

7.5 Threat of substitutes

Threat of substitutes - Impact of key factors in 2025 and 2030

7.6 Threat of rivalry

Threat of rivalry - Impact of key factors in 2025 and 2030

7.7 Market condition

Chart on Market condition - Five forces 2025 and 2030

8. Market Segmentation by Component

8.1 Market segments

Chart on Component - Market share 2025-2030 (%)
Data Table on Component - Market share 2025-2030 (%)

8.2 Comparison by Component

Chart on Comparison by Component
Data Table on Comparison by Component

8.3 Software - Market size and forecast 2025-2030

Chart on Software - Market size and forecast 2025-2030 ($ million)
Data Table on Software - Market size and forecast 2025-2030 ($ million)
Chart on Software - Year-over-year growth 2025-2030 (%)
Data Table on Software - Year-over-year growth 2025-2030 (%)

8.4 Services - Market size and forecast 2025-2030

Chart on Services - Market size and forecast 2025-2030 ($ million)
Data Table on Services - Market size and forecast 2025-2030 ($ million)
Chart on Services - Year-over-year growth 2025-2030 (%)
Data Table on Services - Year-over-year growth 2025-2030 (%)

8.5 Market opportunity by Component

Market opportunity by Component ($ million)
Data Table on Market opportunity by Component ($ million)

9. Market Segmentation by Deployment

9.1 Market segments

Chart on Deployment - Market share 2025-2030 (%)
Data Table on Deployment - Market share 2025-2030 (%)

9.2 Comparison by Deployment

Chart on Comparison by Deployment
Data Table on Comparison by Deployment

9.3 Cloud based - Market size and forecast 2025-2030

Chart on Cloud based - Market size and forecast 2025-2030 ($ million)
Data Table on Cloud based - Market size and forecast 2025-2030 ($ million)
Chart on Cloud based - Year-over-year growth 2025-2030 (%)
Data Table on Cloud based - Year-over-year growth 2025-2030 (%)

9.4 On premises - Market size and forecast 2025-2030

Chart on On premises - Market size and forecast 2025-2030 ($ million)
Data Table on On premises - Market size and forecast 2025-2030 ($ million)
Chart on On premises - Year-over-year growth 2025-2030 (%)
Data Table on On premises - Year-over-year growth 2025-2030 (%)

9.5 Hybrid - Market size and forecast 2025-2030

Chart on Hybrid - Market size and forecast 2025-2030 ($ million)
Data Table on Hybrid - Market size and forecast 2025-2030 ($ million)
Chart on Hybrid - Year-over-year growth 2025-2030 (%)
Data Table on Hybrid - Year-over-year growth 2025-2030 (%)

9.6 Market opportunity by Deployment

Market opportunity by Deployment ($ million)
Data Table on Market opportunity by Deployment ($ million)

10. Market Segmentation by End-user

10.1 Market segments

Chart on End-user - Market share 2025-2030 (%)
Data Table on End-user - Market share 2025-2030 (%)

10.2 Comparison by End-user

Chart on Comparison by End-user
Data Table on Comparison by End-user

10.3 Automotive and mobility - Market size and forecast 2025-2030

Chart on Automotive and mobility - Market size and forecast 2025-2030 ($ million)
Data Table on Automotive and mobility - Market size and forecast 2025-2030 ($ million)
Chart on Automotive and mobility - Year-over-year growth 2025-2030 (%)
Data Table on Automotive and mobility - Year-over-year growth 2025-2030 (%)

10.4 Electronics and electricals - Market size and forecast 2025-2030

Chart on Electronics and electricals - Market size and forecast 2025-2030 ($ million)
Data Table on Electronics and electricals - Market size and forecast 2025-2030 ($ million)
Chart on Electronics and electricals - Year-over-year growth 2025-2030 (%)
Data Table on Electronics and electricals - Year-over-year growth 2025-2030 (%)

10.5 Industrial and chemicals - Market size and forecast 2025-2030

Chart on Industrial and chemicals - Market size and forecast 2025-2030 ($ million)
Data Table on Industrial and chemicals - Market size and forecast 2025-2030 ($ million)
Chart on Industrial and chemicals - Year-over-year growth 2025-2030 (%)
Data Table on Industrial and chemicals - Year-over-year growth 2025-2030 (%)

10.6 Textile and apparel - Market size and forecast 2025-2030

Chart on Textile and apparel - Market size and forecast 2025-2030 ($ million)
Data Table on Textile and apparel - Market size and forecast 2025-2030 ($ million)
Chart on Textile and apparel - Year-over-year growth 2025-2030 (%)
Data Table on Textile and apparel - Year-over-year growth 2025-2030 (%)

10.7 Food and beverages - Market size and forecast 2025-2030

Chart on Food and beverages - Market size and forecast 2025-2030 ($ million)
Data Table on Food and beverages - Market size and forecast 2025-2030 ($ million)
Chart on Food and beverages - Year-over-year growth 2025-2030 (%)
Data Table on Food and beverages - Year-over-year growth 2025-2030 (%)

10.8 Market opportunity by End-user

Market opportunity by End-user ($ million)
Data Table on Market opportunity by End-user ($ million)

11. Customer Landscape

11.1 Customer landscape overview

Analysis of price sensitivity, lifecycle, customer purchase basket, adoption rates, and purchase criteria

12. Geographic Landscape

12.1 Geographic segmentation

Chart on Market share by geography 2025-2030 (%)
Data Table on Market share by geography 2025-2030 (%)

12.2 Geographic comparison

Chart on Geographic comparison
Data Table on Geographic comparison

12.3 Europe - Market size and forecast 2025-2030

Chart on Europe - Market size and forecast 2025-2030 ($ million)
Data Table on Europe - Market size and forecast 2025-2030 ($ million)
Chart on Europe - Year-over-year growth 2025-2030 (%)
Data Table on Europe - Year-over-year growth 2025-2030 (%)
Chart on Regional Comparison - Europe
Data Table on Regional Comparison - Europe

12.3.1 Germany - Market size and forecast 2025-2030

Chart on Germany - Market size and forecast 2025-2030 ($ million)
Data Table on Germany - Market size and forecast 2025-2030 ($ million)
Chart on Germany - Year-over-year growth 2025-2030 (%)
Data Table on Germany - Year-over-year growth 2025-2030 (%)

12.3.2 UK - Market size and forecast 2025-2030

Chart on UK - Market size and forecast 2025-2030 ($ million)
Data Table on UK - Market size and forecast 2025-2030 ($ million)
Chart on UK - Year-over-year growth 2025-2030 (%)
Data Table on UK - Year-over-year growth 2025-2030 (%)

12.3.3 France - Market size and forecast 2025-2030

Chart on France - Market size and forecast 2025-2030 ($ million)
Data Table on France - Market size and forecast 2025-2030 ($ million)
Chart on France - Year-over-year growth 2025-2030 (%)
Data Table on France - Year-over-year growth 2025-2030 (%)

12.3.4 Italy - Market size and forecast 2025-2030

Chart on Italy - Market size and forecast 2025-2030 ($ million)
Data Table on Italy - Market size and forecast 2025-2030 ($ million)
Chart on Italy - Year-over-year growth 2025-2030 (%)
Data Table on Italy - Year-over-year growth 2025-2030 (%)

12.3.5 Spain - Market size and forecast 2025-2030

Chart on Spain - Market size and forecast 2025-2030 ($ million)
Data Table on Spain - Market size and forecast 2025-2030 ($ million)
Chart on Spain - Year-over-year growth 2025-2030 (%)
Data Table on Spain - Year-over-year growth 2025-2030 (%)

12.3.6 The Netherlands - Market size and forecast 2025-2030

Chart on The Netherlands - Market size and forecast 2025-2030 ($ million)
Data Table on The Netherlands - Market size and forecast 2025-2030 ($ million)
Chart on The Netherlands - Year-over-year growth 2025-2030 (%)
Data Table on The Netherlands - Year-over-year growth 2025-2030 (%)

12.4 North America - Market size and forecast 2025-2030

Chart on North America - Market size and forecast 2025-2030 ($ million)
Data Table on North America - Market size and forecast 2025-2030 ($ million)
Chart on North America - Year-over-year growth 2025-2030 (%)
Data Table on North America - Year-over-year growth 2025-2030 (%)
Chart on Regional Comparison - North America
Data Table on Regional Comparison - North America

12.4.1 US - Market size and forecast 2025-2030

Chart on US - Market size and forecast 2025-2030 ($ million)
Data Table on US - Market size and forecast 2025-2030 ($ million)
Chart on US - Year-over-year growth 2025-2030 (%)
Data Table on US - Year-over-year growth 2025-2030 (%)

12.4.2 Canada - Market size and forecast 2025-2030

Chart on Canada - Market size and forecast 2025-2030 ($ million)
Data Table on Canada - Market size and forecast 2025-2030 ($ million)
Chart on Canada - Year-over-year growth 2025-2030 (%)
Data Table on Canada - Year-over-year growth 2025-2030 (%)

12.4.3 Mexico - Market size and forecast 2025-2030

Chart on Mexico - Market size and forecast 2025-2030 ($ million)
Data Table on Mexico - Market size and forecast 2025-2030 ($ million)
Chart on Mexico - Year-over-year growth 2025-2030 (%)
Data Table on Mexico - Year-over-year growth 2025-2030 (%)

12.5 APAC - Market size and forecast 2025-2030

Chart on APAC - Market size and forecast 2025-2030 ($ million)
Data Table on APAC - Market size and forecast 2025-2030 ($ million)
Chart on APAC - Year-over-year growth 2025-2030 (%)
Data Table on APAC - Year-over-year growth 2025-2030 (%)
Chart on Regional Comparison - APAC
Data Table on Regional Comparison - APAC

12.5.1 China - Market size and forecast 2025-2030

Chart on China - Market size and forecast 2025-2030 ($ million)
Data Table on China - Market size and forecast 2025-2030 ($ million)
Chart on China - Year-over-year growth 2025-2030 (%)
Data Table on China - Year-over-year growth 2025-2030 (%)

12.5.2 India - Market size and forecast 2025-2030

Chart on India - Market size and forecast 2025-2030 ($ million)
Data Table on India - Market size and forecast 2025-2030 ($ million)
Chart on India - Year-over-year growth 2025-2030 (%)
Data Table on India - Year-over-year growth 2025-2030 (%)

12.5.3 Japan - Market size and forecast 2025-2030

Chart on Japan - Market size and forecast 2025-2030 ($ million)
Data Table on Japan - Market size and forecast 2025-2030 ($ million)
Chart on Japan - Year-over-year growth 2025-2030 (%)
Data Table on Japan - Year-over-year growth 2025-2030 (%)

12.5.4 South Korea - Market size and forecast 2025-2030

Chart on South Korea - Market size and forecast 2025-2030 ($ million)
Data Table on South Korea - Market size and forecast 2025-2030 ($ million)
Chart on South Korea - Year-over-year growth 2025-2030 (%)
Data Table on South Korea - Year-over-year growth 2025-2030 (%)

12.5.5 Australia - Market size and forecast 2025-2030

Chart on Australia - Market size and forecast 2025-2030 ($ million)
Data Table on Australia - Market size and forecast 2025-2030 ($ million)
Chart on Australia - Year-over-year growth 2025-2030 (%)
Data Table on Australia - Year-over-year growth 2025-2030 (%)

12.5.6 Indonesia - Market size and forecast 2025-2030

Chart on Indonesia - Market size and forecast 2025-2030 ($ million)
Data Table on Indonesia - Market size and forecast 2025-2030 ($ million)
Chart on Indonesia - Year-over-year growth 2025-2030 (%)
Data Table on Indonesia - Year-over-year growth 2025-2030 (%)

12.6 Middle East and Africa - Market size and forecast 2025-2030

Chart on Middle East and Africa - Market size and forecast 2025-2030 ($ million)
Data Table on Middle East and Africa - Market size and forecast 2025-2030 ($ million)
Chart on Middle East and Africa - Year-over-year growth 2025-2030 (%)
Data Table on Middle East and Africa - Year-over-year growth 2025-2030 (%)
Chart on Regional Comparison - Middle East and Africa
Data Table on Regional Comparison - Middle East and Africa

12.6.1 Saudi Arabia - Market size and forecast 2025-2030

Chart on Saudi Arabia - Market size and forecast 2025-2030 ($ million)
Data Table on Saudi Arabia - Market size and forecast 2025-2030 ($ million)
Chart on Saudi Arabia - Year-over-year growth 2025-2030 (%)
Data Table on Saudi Arabia - Year-over-year growth 2025-2030 (%)

12.6.2 UAE - Market size and forecast 2025-2030

Chart on UAE - Market size and forecast 2025-2030 ($ million)
Data Table on UAE - Market size and forecast 2025-2030 ($ million)
Chart on UAE - Year-over-year growth 2025-2030 (%)
Data Table on UAE - Year-over-year growth 2025-2030 (%)

12.6.3 South Africa - Market size and forecast 2025-2030

Chart on South Africa - Market size and forecast 2025-2030 ($ million)
Data Table on South Africa - Market size and forecast 2025-2030 ($ million)
Chart on South Africa - Year-over-year growth 2025-2030 (%)
Data Table on South Africa - Year-over-year growth 2025-2030 (%)

12.6.4 Israel - Market size and forecast 2025-2030

Chart on Israel - Market size and forecast 2025-2030 ($ million)
Data Table on Israel - Market size and forecast 2025-2030 ($ million)
Chart on Israel - Year-over-year growth 2025-2030 (%)
Data Table on Israel - Year-over-year growth 2025-2030 (%)

12.6.5 Turkey - Market size and forecast 2025-2030

Chart on Turkey - Market size and forecast 2025-2030 ($ million)
Data Table on Turkey - Market size and forecast 2025-2030 ($ million)
Chart on Turkey - Year-over-year growth 2025-2030 (%)
Data Table on Turkey - Year-over-year growth 2025-2030 (%)

12.7 South America - Market size and forecast 2025-2030

Chart on South America - Market size and forecast 2025-2030 ($ million)
Data Table on South America - Market size and forecast 2025-2030 ($ million)
Chart on South America - Year-over-year growth 2025-2030 (%)
Data Table on South America - Year-over-year growth 2025-2030 (%)
Chart on Regional Comparison - South America
Data Table on Regional Comparison - South America

12.7.1 Brazil - Market size and forecast 2025-2030

Chart on Brazil - Market size and forecast 2025-2030 ($ million)
Data Table on Brazil - Market size and forecast 2025-2030 ($ million)
Chart on Brazil - Year-over-year growth 2025-2030 (%)
Data Table on Brazil - Year-over-year growth 2025-2030 (%)

12.7.2 Argentina - Market size and forecast 2025-2030

Chart on Argentina - Market size and forecast 2025-2030 ($ million)
Data Table on Argentina - Market size and forecast 2025-2030 ($ million)
Chart on Argentina - Year-over-year growth 2025-2030 (%)
Data Table on Argentina - Year-over-year growth 2025-2030 (%)

12.7.3 Colombia - Market size and forecast 2025-2030

Chart on Colombia - Market size and forecast 2025-2030 ($ million)
Data Table on Colombia - Market size and forecast 2025-2030 ($ million)
Chart on Colombia - Year-over-year growth 2025-2030 (%)
Data Table on Colombia - Year-over-year growth 2025-2030 (%)

12.8 Market opportunity by geography

Market opportunity by geography ($ million)
Data Tables on Market opportunity by geography ($ million)

13. Drivers, Challenges, and Opportunity

13.1 Market drivers

Regulatory frameworks and mandates promoting circular economy principles
Escalating consumer and corporate demand for supply chain transparency
Technological advancements in decentralized ledgers and industrial sensors

13.2 Market challenges

Complexities regarding data privacy and intellectual property protection
Lack of universal standardization and interoperability issues
High implementation costs and integration complexities for legacy systems

13.3 Impact of drivers and challenges

Impact of drivers and challenges in 2025 and 2030

13.4 Market opportunities

Integration of digital twins for predictive maintenance and lifecycle management
Emergence of cross industry standardization and interoperability protocols
Monetization of product data through servitization models

14. Competitive Landscape

14.1 Overview

14.2

Overview on criticality of inputs and factors of differentiation

14.3 Landscape disruption

Overview on factors of disruption

14.4 Industry risks

Impact of key risks on business

15. Competitive Analysis

15.1 Companies profiled

Companies covered

15.2 Company ranking index

15.3 Market positioning of companies

Matrix on companies position and classification

15.4 Avery Dennison Corp.

Avery Dennison Corp. - Overview
Avery Dennison Corp. - Business segments
Avery Dennison Corp. - Key news
Avery Dennison Corp. - Key offerings
Avery Dennison Corp. - Segment focus
SWOT

15.5 Circularise

Circularise - Overview
Circularise - Product / Service
Circularise - Key offerings
SWOT

15.6 Circulor

Circulor - Overview
Circulor - Product / Service
Circulor - Key offerings
SWOT

15.7 Dassault Systemes SE

Dassault Systemes SE - Overview
Dassault Systemes SE - Business segments
Dassault Systemes SE - Key offerings
Dassault Systemes SE - Segment focus
SWOT

15.8 DNV Group AS

DNV Group AS - Overview
DNV Group AS - Business segments
DNV Group AS - Key offerings
DNV Group AS - Segment focus
SWOT

15.9 IBM Corp.

IBM Corp. - Overview
IBM Corp. - Business segments
IBM Corp. - Key news
IBM Corp. - Key offerings
IBM Corp. - Segment focus
SWOT

15.10 iPoint-systems gmbh

iPoint-systems gmbh - Overview
iPoint-systems gmbh - Product / Service
iPoint-systems gmbh - Key offerings
SWOT

15.11 Kezzler AS

Kezzler AS - Overview
Kezzler AS - Product / Service
Kezzler AS - Key offerings
SWOT

15.12 Minespider GmbH

Minespider GmbH - Overview
Minespider GmbH - Product / Service
Minespider GmbH - Key offerings
SWOT

15.13 Protokol B.V.

Protokol B.V. - Overview
Protokol B.V. - Product / Service
Protokol B.V. - Key offerings
SWOT

15.14 PTC Inc.

PTC Inc. - Overview
PTC Inc. - Business segments
PTC Inc. - Key offerings
PTC Inc. - Segment focus
SWOT

15.15 SAP SE

SAP SE - Overview
SAP SE - Business segments
SAP SE - Key news
SAP SE - Key offerings
SAP SE - Segment focus
SWOT

15.16 Siemens AG

Siemens AG - Overview
Siemens AG - Business segments
Siemens AG - Key news
Siemens AG - Key offerings
Siemens AG - Segment focus
SWOT

15.17 Spherity GmbH

Spherity GmbH - Overview
Spherity GmbH - Product / Service
Spherity GmbH - Key offerings
SWOT

15.18 TrusTrace

TrusTrace - Overview
TrusTrace - Product / Service
TrusTrace - Key offerings
SWOT

16. Appendix

16.1 Scope of the report

Market definition
Objectives
Notes and caveats

16.2 Inclusions and exclusions checklist

Inclusions checklist
Exclusions checklist

16.3 Currency conversion rates for US$

16.4 Research methodology

16.5 Data procurement

Information sources

16.6 Data validation

16.7 Validation techniques employed for market sizing

16.8 Data synthesis

16.9 360 degree market analysis

16.10 List of abbreviations

Research Methodology

Technavio presents a detailed picture of the market by way of study, synthesis, and summation of data from multiple sources. The analysts have presented the various facets of the market with a particular focus on identifying the key industry influencers. The data thus presented is comprehensive, reliable, and the result of extensive research, both primary and secondary.

INFORMATION SOURCES

Primary sources

  • Manufacturers and suppliers
  • Channel partners
  • Industry experts
  • Strategic decision makers

Secondary sources

  • Industry journals and periodicals
  • Government data
  • Financial reports of key industry players
  • Historical data
  • Press releases

DATA ANALYSIS

Data Synthesis

  • Collation of data
  • Estimation of key figures
  • Analysis of derived insights

Data Validation

  • Triangulation with data models
  • Reference against proprietary databases
  • Corroboration with industry experts

REPORT WRITING

Qualitative

  • Market drivers
  • Market challenges
  • Market trends
  • Five forces analysis

Quantitative

  • Market size and forecast
  • Market segmentation
  • Geographical insights
  • Competitive landscape

Interested in this report?

Get your sample now to see our research methodology and insights!

Download Now

Frequently Asked Questions

Digital Product Passport Platforms For Manufacturing market growth will increase by USD 4092.7 million during 2026-2030.

The Digital Product Passport Platforms For Manufacturing market is expected to grow at a CAGR of 36.1% during 2026-2030.

Digital Product Passport Platforms For Manufacturing market is segmented by Component (Software, Services) Deployment (Cloud based, On premises, Hybrid) End-user (Automotive and mobility, Electronics and electricals, Industrial and chemicals, Textile and apparel, Food and beverages)

Arianee, Authena AG, Avery Dennison Corp., BanQu, Circularise, Circulor, Dassault Systemes SE, DNV Group AS, IBM Corp., iPoint-systems gmbh, Kezzler AS, Minespider GmbH, Protokol B.V., PSQR, PTC Inc., SAP SE, Siemens AG, Spherity GmbH, TrusTrace are a few of the key vendors in the Digital Product Passport Platforms For Manufacturing market.

Europe will register the highest growth rate of 38.1% among the other regions. Therefore, the Digital Product Passport Platforms For Manufacturing market in Europe is expected to garner significant business opportunities for the vendors during the forecast period.

Germany, UK, France, Italy, Spain, The Netherlands, US, Canada, Mexico, China, India, Japan, South Korea, Australia, Indonesia, Saudi Arabia, UAE, South Africa, Israel, Turkey, Brazil, Argentina, Colombia

  • Regulatory frameworks and mandates promoting circular economy principles is the driving factor this market.

The Digital Product Passport Platforms For Manufacturing market vendors should focus on grabbing business opportunities from the Component segment as it accounted for the largest market share in the base year.
RIA - Research AI Assistant
Ask RIA