Digital Shipyard Market Analysis, Size, and Forecast 2026-2030: APAC (China, Japan, and South Korea), North America (US, Canada, and Mexico), Europe (Germany, France, and UK), Middle East and Africa (Saudi Arabia, UAE, and South Africa), South America (Brazil, Argentina, and Colombia), and Rest of World (ROW)

Digital Shipyard Market Analysis, Size, and Forecast 2026-2030:
APAC (China, Japan, and South Korea), North America (US, Canada, and Mexico), Europe (Germany, France, and UK), Middle East and Africa (Saudi Arabia, UAE, and South Africa), South America (Brazil, Argentina, and Colombia), and Rest of World (ROW)

Published: Dec 2025 305 Pages SKU: IRTNTR81214

Market Overview at a Glance

$3.13 B
Market Opportunity
18.7%
CAGR 2025 - 2030
34.8%
APAC Growth
$1.10 B
On-premises segment 2024

Digital Shipyard Market Size 2026-2030

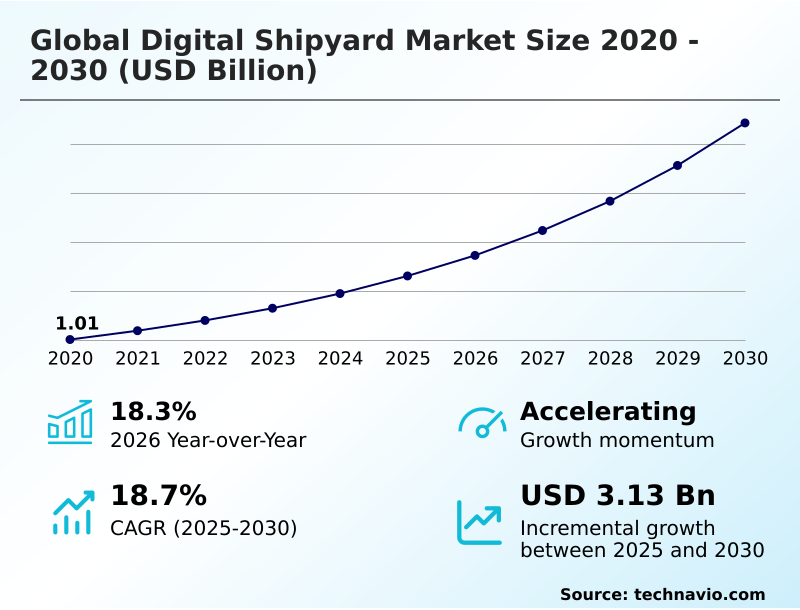
The digital shipyard market size is valued to increase by USD 3.13 billion, at a CAGR of 18.7% from 2025 to 2030. High initial investment and uncertain return on investment will drive the digital shipyard market.

Major Market Trends & Insights

  • APAC dominated the market and accounted for a 34.8% growth during the forecast period.
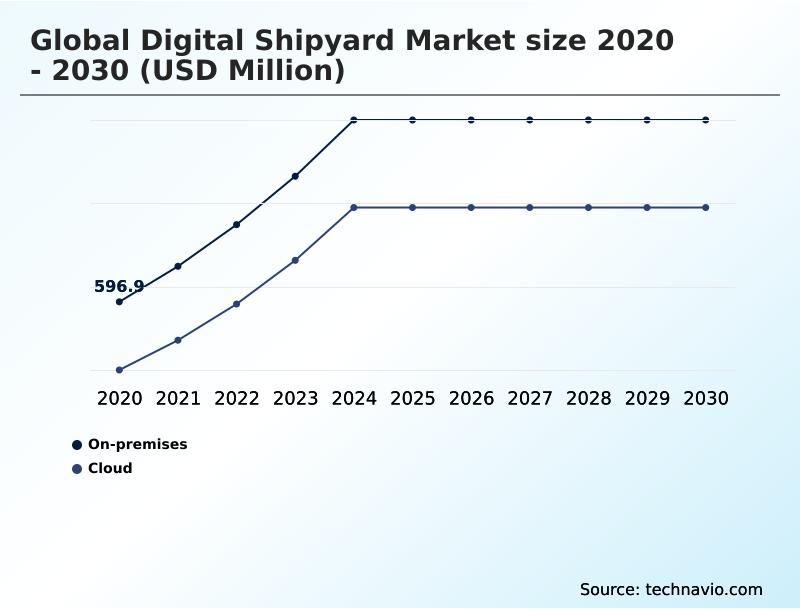
  • By Deployment - On-premises segment was valued at USD 1.10 billion in 2024
  • By Type - Commercial shipyards segment accounted for the largest market revenue share in 2024

Market Size & Forecast

  • Market Opportunities: USD 4.43 billion
  • Market Future Opportunities: USD 3.13 billion
  • CAGR from 2025 to 2030 : 18.7%

Market Summary

  • The digital shipyard market is undergoing a fundamental transformation, shifting from traditional, labor-intensive practices to integrated, data-centric operations. This evolution is driven by the urgent need to manage the increasing complexity of modern vessels, enhance productivity, and mitigate persistent skilled labor shortages.
  • Technologies such as the industrial internet of things (iiot), artificial intelligence, and digital twins are no longer aspirational but are becoming core to a shipyard's competitive strategy.
  • For instance, in the construction of a next-generation naval destroyer, a fully integrated digital thread connects every stage, from initial design simulations to real-time production monitoring on the shop floor and eventual through-life support. This creates a single source of truth, enabling predictive maintenance analytics and significantly reducing the costly rework that arises from data silos.
  • However, the high initial investment for enterprise resource planning (erp) and the challenge of upskilling the existing workforce to leverage these advanced manufacturing processes remain significant considerations for many operators. The market's trajectory is toward creating smart, autonomous ecosystems that improve both efficiency and safety.

What will be the Size of the Digital Shipyard Market during the forecast period?

Get Key Insights on Market Forecast (PDF) Request Free Sample

How is the Digital Shipyard Market Segmented?

The digital shipyard industry research report provides comprehensive data (region-wise segment analysis), with forecasts and estimates in "USD million" for the period 2026-2030, as well as historical data from 2020-2024 for the following segments.

  • Deployment
    • On-premises
    • Cloud
  • Type
    • Commercial shipyards
    • Naval and defense shipyards
    • Specialized shipyards
  • Application
    • Medium shipyards
    • Large shipyards
    • Small shipyards
  • Geography
    • APAC
      • China
      • Japan
      • South Korea
    • North America
      • US
      • Canada
      • Mexico
    • Europe
      • Germany
      • France
      • UK
    • Middle East and Africa
      • Saudi Arabia
      • UAE
      • South Africa
    • South America
      • Brazil
      • Argentina
      • Colombia
    • Rest of World (ROW)

By Deployment Insights

The on-premises segment is estimated to witness significant growth during the forecast period.

The on-premises deployment model remains a critical component of the digital shipyard market, especially for naval and defense applications where data sovereignty and security are non-negotiable.

This approach, which involves hosting all digital infrastructure within the shipyard's physical perimeter, provides absolute control over sensitive assets like proprietary designs and national security data, enabling the use of air-gapped networks.

For mission-critical engineering tasks requiring high-performance computing, such as advanced simulation tools for computational fluid dynamics, an on-premise setup ensures minimal latency.

While requiring significant upfront capital, this model is the most reliable foundation for organizations with strict security obligations and a need for deep integration with legacy systems, ensuring data integrity in over 99% of operations for asset performance management and through-life support optimization.

Request Free Sample

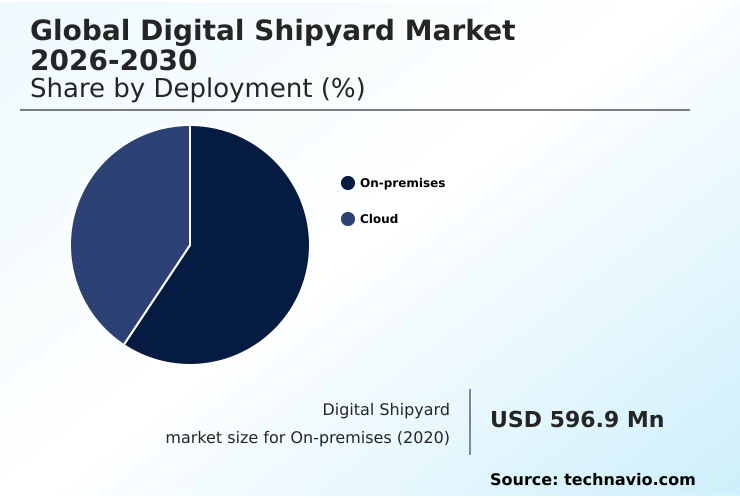
The On-premises segment was valued at USD 1.10 billion in 2024 and showed a gradual increase during the forecast period.

Request Free Sample

Regional Analysis

APAC is estimated to contribute 34.8% to the growth of the global market during the forecast period.Technavio’s analysts have elaborately explained the regional trends and drivers that shape the market during the forecast period.

See How Digital Shipyard Market Demand is Rising in APAC Request Free Sample

The geographic landscape of the digital shipyard market is characterized by distinct regional drivers and adoption patterns.

APAC, which accounts for 34.8% of the market's incremental growth, is defined by large-scale, state-supported initiatives aimed at creating fully autonomous production systems and smart shipyard technologies.

Countries in this region are aggressively pursuing supply chain digitalization to maintain their dominance in commercial shipbuilding. In contrast, North America and Europe are largely driven by strategic national security interests and naval fleet modernization.

Here, the focus is on deploying advanced solutions for naval vessel lifecycle management and through-life support optimization, leveraging model-based systems engineering (mbse) to manage the immense complexity of modern warships and secure the maritime industrial base.

These varied approaches reflect a global industry adapting to unique economic and geopolitical pressures.

Market Dynamics

Our researchers analyzed the data with 2025 as the base year, along with the key drivers, trends, and challenges. A holistic analysis of drivers will help companies refine their marketing strategies to gain a competitive advantage.

  • The modern shipbuilding process is a digitally orchestrated journey, beginning with generative ai for hull form optimization and sustainable ship design using cfd analysis to meet stringent environmental targets. In the naval sector, this progresses to the use of a plm system for warship design integration and mbse for complex naval systems integration, ensuring all systems function seamlessly.
  • On the production floor, ai for shipyard production scheduling optimizes workflows, while automated welding for complex hull structures ensures precision and speed. The human element is enhanced through ar for shipyard technician training and digital work instructions for outfitting, which are proven to improve first-time quality significantly.
  • Throughout the vessel's life, technologies like the digital twin for naval submarine maintenance and iot sensors for predictive vessel maintenance revolutionize upkeep, with some yards using 3d scanning for ship repair assessment to quote jobs faster.
  • This holistic digital approach, which includes optimizing the supply chain with shipyard erp and using iiot for real-time production monitoring, achieves a level of coherence that reduces integration faults by over 60% compared to traditional, siloed methods, fundamentally changing how vessels are built and maintained.

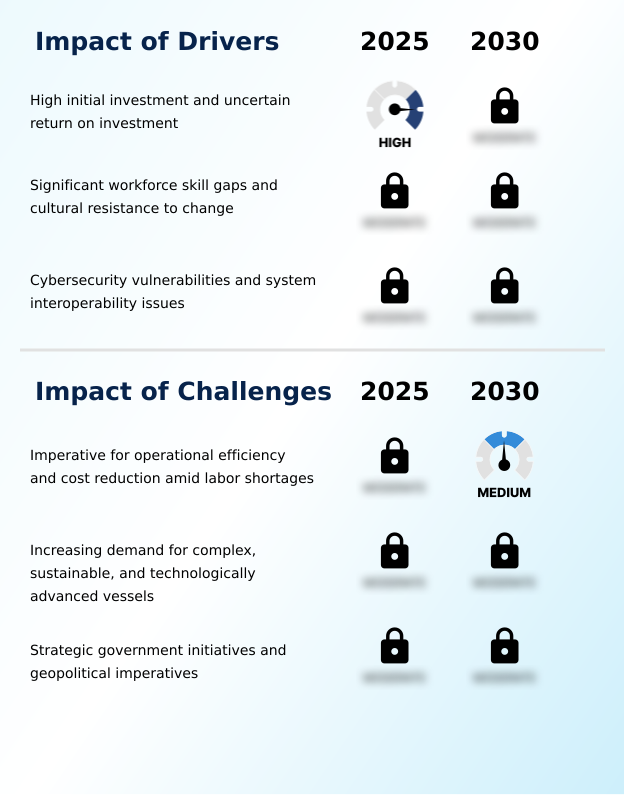
What are the key market drivers leading to the rise in the adoption of Digital Shipyard Industry?

  • The imperative to enhance operational efficiency and reduce production costs in a competitive, labor-constrained environment serves as a primary driver for market growth.

  • The market is propelled by the dual drivers of increasing vessel complexity and the government-backed imperative for naval fleet modernization.
  • The shift toward sustainable ship design, incorporating alternative fuels and advanced energy-saving devices, increases design and integration complexity by over 50% compared to conventional ships, making model-based systems engineering indispensable.
  • Digital tools are essential for the safe integration of these novel systems. Concurrently, strategic government initiatives are funding the development of the maritime industrial base, mandating the use of technologies that support strategic national security objectives.
  • The push for shipbuilding cost reduction is also a major factor, with robotic welding automation boosting productivity in key tasks by as much as 300% over manual methods, directly addressing both labor shortages and efficiency goals.

What are the market trends shaping the Digital Shipyard Industry?

  • The proliferation of digital twin technology and the establishment of an end-to-end digital thread are dominant trends shaping the industry's evolution toward integrated, data-driven operations.

  • A dominant trend in the digital shipyard market is the convergence of digital twin technology with AI-powered analytics, hosted on collaborative, cloud-based shipbuilding platforms. This synergy creates a dynamic virtual replica of a vessel that is continuously updated, enabling advanced lifecycle performance simulation.
  • The proliferation of digital thread integration ensures that data from design, production, and operations flow seamlessly, which is critical for reducing vessel downtime. AI-driven predictive maintenance, a key application, has demonstrated the ability to reduce unexpected equipment failures by up to 40%.
  • Concurrently, the adoption of augmented reality (ar) and virtual reality (vr) for design validation and technician training is accelerating, with some shipyards reporting a 20% reduction in design review cycles. This move toward an integrated digital ecosystem is redefining shipyard operational efficiency and enabling more complex vessel integration.

What challenges does the Digital Shipyard Industry face during its growth?

  • The substantial initial capital expenditure required for a full-scale digital transformation represents a primary challenge affecting widespread market adoption.

  • Significant challenges hinder the widespread adoption of digital shipyard technologies, led by the need for substantial upfront investment and a critical gap in workforce skills. A full-scale digital overhaul can require an investment representing 10-15% of a shipyard's annual revenue, a formidable barrier for many.
  • This is compounded by a shortage of digitally proficient talent, with demand for roles that blend data science with shipbuilding expertise outstripping supply by a ratio of 3:1 in some regions.
  • Furthermore, ensuring maritime cybersecurity solutions are robust enough to protect sensitive design data is a growing concern, as cyber-attacks against industrial targets have risen by over 20% in the last year. Achieving true system interoperability to create a seamless data environment remains a persistent technical hurdle, limiting the full potential of digitalization.

Exclusive Technavio Analysis on Customer Landscape

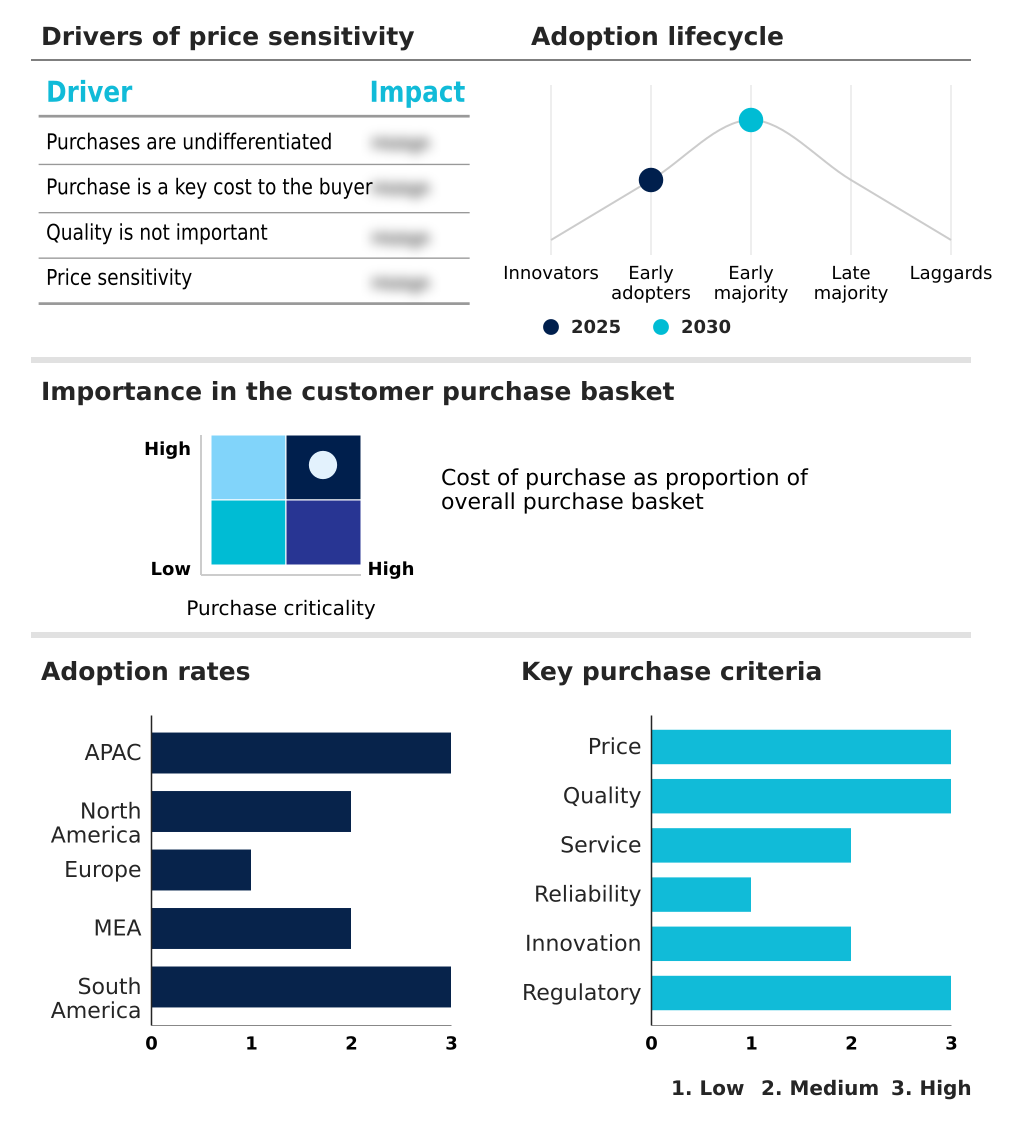
The digital shipyard market forecasting report includes the adoption lifecycle of the market, covering from the innovator’s stage to the laggard’s stage. It focuses on adoption rates in different regions based on penetration. Furthermore, the digital shipyard market report also includes key purchase criteria and drivers of price sensitivity to help companies evaluate and develop their market growth analysis strategies.

Customer Landscape of Digital Shipyard Industry

Competitive Landscape

Companies are implementing various strategies, such as strategic alliances, digital shipyard market forecast, partnerships, mergers and acquisitions, geographical expansion, and product/service launches, to enhance their presence in the industry.

ABB Ltd. - The company offers collaborative operations and marine software, enabling predictive maintenance and smart shipbuilding integration for enhanced efficiency.

The industry research and growth report includes detailed analyses of the competitive landscape of the market and information about key companies, including:

  • ABB Ltd.
  • Accenture PLC
  • Altair Engineering Inc.
  • Aras Corp.
  • BAE Systems Plc
  • Bentley Systems Inc.
  • Damen Shipyards Group
  • Dassault Systemes SE
  • Emerson Electric Co.
  • Hexagon AB
  • Honeywell International Inc.
  • IFS World Operations AB
  • Inmarsat Global Ltd.
  • Navantia SA
  • Rockwell Automation Inc.
  • Schneider Electric SE
  • Siemens AG
  • Wartsila Corp.

Qualitative and quantitative analysis of companies has been conducted to help clients understand the wider business environment as well as the strengths and weaknesses of key industry players. Data is qualitatively analyzed to categorize companies as pure play, category-focused, industry-focused, and diversified; it is quantitatively analyzed to categorize companies as dominant, leading, strong, tentative, and weak.

Recent Development and News in Digital shipyard market

  • In May, 2025, a major Japanese consortium involving leading shipbuilders and owners completed advanced pilot trials for a collaborative digital twin platform designed to enable the secure exchange of 3D design models and operational data.
  • In August, 2025, major European shipbuilder Navantia commenced operations at a new highly automated workshop in its San Fernando facility, leveraging technologies like hybrid laser welding to significantly cut construction times and costs.
  • In April, 2025, a leading global container line placed a landmark order for a new fleet of ammonia-ready vessels, with the contract stipulating that the shipyard must utilize a comprehensive digital twin for virtual prototyping and lifecycle simulation.
  • In July, 2025, the US Department of the Navy allocated a new tranche of funding specifically for the digital modernization of its public shipyards, with a focus on implementing digital twin technologies to reduce maintenance periods for submarines and aircraft carriers.

Dive into Technavio’s robust research methodology, blending expert interviews, extensive data synthesis, and validated models for unparalleled Digital Shipyard Market insights. See full methodology.

Market Scope
Page number 305
Base year 2025
Historic period 2020-2024
Forecast period 2026-2030
Growth momentum & CAGR Accelerate at a CAGR of 18.7%
Market growth 2026-2030 USD 3129.2 million
Market structure Fragmented
YoY growth 2025-2026(%) 18.3%
Key countries China, Japan, South Korea, India, Australia, Indonesia, US, Canada, Mexico, Germany, France, UK, Italy, The Netherlands, Spain, Saudi Arabia, UAE, South Africa, Israel, Turkey, Brazil, Argentina and Colombia
Competitive landscape Leading Companies, Market Positioning of Companies, Competitive Strategies, and Industry Risks

Request Free Sample

Research Analyst Overview

  • The digital shipyard market represents a paradigm shift from conventional manufacturing to a fully integrated, data-driven ecosystem. The adoption of digital twin technology, product lifecycle management (plm), and the internet of things (iot) is becoming a baseline requirement for competitiveness.
  • This transition necessitates boardroom-level strategic decisions regarding capital expenditure on foundational technologies like high-performance computing, enterprise resource planning (erp), and robotic welding automation. The implementation of a comprehensive digital thread integration creates an unbroken data flow from concept to decommissioning.
  • This facilitates the use of virtual reality (vr), augmented reality (ar), and advanced simulation tools for virtual prototyping, which has been shown to reduce physical rework and design-related errors by over 30%. Technologies such as additive manufacturing and 3d laser scanning are further transforming maintenance and repair.
  • This evolution is not merely about adopting isolated smart shipyard technologies; it is about leveraging an entire suite of tools—from ai-powered foundation models to real-time data analysis—to achieve new levels of precision and productivity in a complex industry.

What are the Key Data Covered in this Digital Shipyard Market Research and Growth Report?

  • What is the expected growth of the Digital Shipyard Market between 2026 and 2030?

    • USD 3.13 billion, at a CAGR of 18.7%

  • What segmentation does the market report cover?

    • The report is segmented by Deployment (On-premises, and Cloud), Type (Commercial shipyards, Naval and defense shipyards, and Specialized shipyards), Application (Medium shipyards, Large shipyards, and Small shipyards) and Geography (APAC, North America, Europe, Middle East and Africa, South America)

  • Which regions are analyzed in the report?

    • APAC, North America, Europe, Middle East and Africa and South America

  • What are the key growth drivers and market challenges?

    • High initial investment and uncertain return on investment, Imperative for operational efficiency and cost reduction amid labor shortages

  • Who are the major players in the Digital Shipyard Market?

    • ABB Ltd., Accenture PLC, Altair Engineering Inc., Aras Corp., BAE Systems Plc, Bentley Systems Inc., Damen Shipyards Group, Dassault Systemes SE, Emerson Electric Co., Hexagon AB, Honeywell International Inc., IFS World Operations AB, Inmarsat Global Ltd., Navantia SA, Rockwell Automation Inc., Schneider Electric SE, Siemens AG and Wartsila Corp.

Market Research Insights

  • The dynamics of the digital shipyard market are driven by a strategic push toward greater operational resilience and competitiveness. The imperative for shipbuilding cost reduction is compelling shipyards to adopt digital platform collaboration to streamline workflows, with early adopters reporting up to a 20% acceleration in project timelines.
  • Concurrently, government-led naval fleet modernization programs are accelerating the integration of technologies for complex vessel integration, which are critical for national security. Advanced simulation tools for sustainable ship design have also demonstrated a capacity to reduce material waste by over 15%, aligning with green shipbuilding initiatives.
  • This digital shift addresses the need for shipyard operational efficiency while also building a more resilient maritime industrial base capable of meeting future demands with enhanced productivity and quality.

We can help! Our analysts can customize this digital shipyard market research report to meet your requirements.

Get in touch

1. Executive Summary

1.1 Market overview

Executive Summary - Chart on Market Overview
Executive Summary - Data Table on Market Overview
Executive Summary - Chart on Global Market Characteristics
Executive Summary - Chart on Market by Geography
Executive Summary - Chart on Market Segmentation by Deployment
Executive Summary - Chart on Market Segmentation by Type
Executive Summary - Chart on Market Segmentation by Application
Executive Summary - Chart on Incremental Growth
Executive Summary - Data Table on Incremental Growth
Executive Summary - Chart on Company Market Positioning

2. Technavio Analysis

2.1 Analysis of price sensitivity, lifecycle, customer purchase basket, adoption rates, and purchase criteria

2.2 Criticality of inputs and Factors of differentiation

Chart on Overview on criticality of inputs and factors of differentiation

2.3 Factors of disruption

Chart on Overview on factors of disruption

2.4 Impact of drivers and challenges

Chart on Impact of drivers and challenges in 2025 and 2030

3. Market Landscape

3.1 Market ecosystem

Chart on Parent Market
Data Table on - Parent Market

3.2 Market characteristics

Chart on Market characteristics analysis

3.3 Value chain analysis

Chart on Value chain analysis

4. Market Sizing

4.1 Market definition

Data Table on Offerings of companies included in the market definition

4.2 Market segment analysis

Market segments

4.3 Market size 2025

4.4 Market outlook: Forecast for 2025-2030

Chart on Global - Market size and forecast 2025-2030 ($ million)
Data Table on Global - Market size and forecast 2025-2030 ($ million)
Chart on Global Market: Year-over-year growth 2025-2030 (%)
Data Table on Global Market: Year-over-year growth 2025-2030 (%)

5. Historic Market Size

5.1 Global Digital Shipyard Market 2020 - 2024

Historic Market Size - Data Table on Global Digital Shipyard Market 2020 - 2024 ($ million)

5.2 Deployment segment analysis 2020 - 2024

Historic Market Size - Deployment Segment 2020 - 2024 ($ million)

5.3 Type segment analysis 2020 - 2024

Historic Market Size - Type Segment 2020 - 2024 ($ million)

5.4 Application segment analysis 2020 - 2024

Historic Market Size - Application Segment 2020 - 2024 ($ million)

5.5 Geography segment analysis 2020 - 2024

Historic Market Size - Geography Segment 2020 - 2024 ($ million)

5.6 Country segment analysis 2020 - 2024

Historic Market Size - Country Segment 2020 - 2024 ($ million)

6. Qualitative Analysis

6.1 The AI impact on global digital shipyard market

7. Five Forces Analysis

7.1 Five forces summary

Five forces analysis - Comparison between 2025 and 2030

7.2 Bargaining power of buyers

Bargaining power of buyers - Impact of key factors 2025 and 2030

7.3 Bargaining power of suppliers

Bargaining power of suppliers - Impact of key factors in 2025 and 2030

7.4 Threat of new entrants

Threat of new entrants - Impact of key factors in 2025 and 2030

7.5 Threat of substitutes

Threat of substitutes - Impact of key factors in 2025 and 2030

7.6 Threat of rivalry

Threat of rivalry - Impact of key factors in 2025 and 2030

7.7 Market condition

Chart on Market condition - Five forces 2025 and 2030

8. Market Segmentation by Deployment

8.1 Market segments

Chart on Deployment - Market share 2025-2030 (%)
Data Table on Deployment - Market share 2025-2030 (%)

8.2 Comparison by Deployment

Chart on Comparison by Deployment
Data Table on Comparison by Deployment

8.3 On-premises - Market size and forecast 2025-2030

Chart on On-premises - Market size and forecast 2025-2030 ($ million)
Data Table on On-premises - Market size and forecast 2025-2030 ($ million)
Chart on On-premises - Year-over-year growth 2025-2030 (%)
Data Table on On-premises - Year-over-year growth 2025-2030 (%)

8.4 Cloud - Market size and forecast 2025-2030

Chart on Cloud - Market size and forecast 2025-2030 ($ million)
Data Table on Cloud - Market size and forecast 2025-2030 ($ million)
Chart on Cloud - Year-over-year growth 2025-2030 (%)
Data Table on Cloud - Year-over-year growth 2025-2030 (%)

8.5 Market opportunity by Deployment

Market opportunity by Deployment ($ million)
Data Table on Market opportunity by Deployment ($ million)

9. Market Segmentation by Type

9.1 Market segments

Chart on Type - Market share 2025-2030 (%)
Data Table on Type - Market share 2025-2030 (%)

9.2 Comparison by Type

Chart on Comparison by Type
Data Table on Comparison by Type

9.3 Commercial shipyards - Market size and forecast 2025-2030

Chart on Commercial shipyards - Market size and forecast 2025-2030 ($ million)
Data Table on Commercial shipyards - Market size and forecast 2025-2030 ($ million)
Chart on Commercial shipyards - Year-over-year growth 2025-2030 (%)
Data Table on Commercial shipyards - Year-over-year growth 2025-2030 (%)

9.4 Naval and defense shipyards - Market size and forecast 2025-2030

Chart on Naval and defense shipyards - Market size and forecast 2025-2030 ($ million)
Data Table on Naval and defense shipyards - Market size and forecast 2025-2030 ($ million)
Chart on Naval and defense shipyards - Year-over-year growth 2025-2030 (%)
Data Table on Naval and defense shipyards - Year-over-year growth 2025-2030 (%)

9.5 Specialized shipyards - Market size and forecast 2025-2030

Chart on Specialized shipyards - Market size and forecast 2025-2030 ($ million)
Data Table on Specialized shipyards - Market size and forecast 2025-2030 ($ million)
Chart on Specialized shipyards - Year-over-year growth 2025-2030 (%)
Data Table on Specialized shipyards - Year-over-year growth 2025-2030 (%)

9.6 Market opportunity by Type

Market opportunity by Type ($ million)
Data Table on Market opportunity by Type ($ million)

10. Market Segmentation by Application

10.1 Market segments

Chart on Application - Market share 2025-2030 (%)
Data Table on Application - Market share 2025-2030 (%)

10.2 Comparison by Application

Chart on Comparison by Application
Data Table on Comparison by Application

10.3 Medium shipyards - Market size and forecast 2025-2030

Chart on Medium shipyards - Market size and forecast 2025-2030 ($ million)
Data Table on Medium shipyards - Market size and forecast 2025-2030 ($ million)
Chart on Medium shipyards - Year-over-year growth 2025-2030 (%)
Data Table on Medium shipyards - Year-over-year growth 2025-2030 (%)

10.4 Large shipyards - Market size and forecast 2025-2030

Chart on Large shipyards - Market size and forecast 2025-2030 ($ million)
Data Table on Large shipyards - Market size and forecast 2025-2030 ($ million)
Chart on Large shipyards - Year-over-year growth 2025-2030 (%)
Data Table on Large shipyards - Year-over-year growth 2025-2030 (%)

10.5 Small shipyards - Market size and forecast 2025-2030

Chart on Small shipyards - Market size and forecast 2025-2030 ($ million)
Data Table on Small shipyards - Market size and forecast 2025-2030 ($ million)
Chart on Small shipyards - Year-over-year growth 2025-2030 (%)
Data Table on Small shipyards - Year-over-year growth 2025-2030 (%)

10.6 Market opportunity by Application

Market opportunity by Application ($ million)
Data Table on Market opportunity by Application ($ million)

11. Customer Landscape

11.1 Customer landscape overview

Analysis of price sensitivity, lifecycle, customer purchase basket, adoption rates, and purchase criteria

12. Geographic Landscape

12.1 Geographic segmentation

Chart on Market share by geography 2025-2030 (%)
Data Table on Market share by geography 2025-2030 (%)

12.2 Geographic comparison

Chart on Geographic comparison
Data Table on Geographic comparison

12.3 APAC - Market size and forecast 2025-2030

Chart on APAC - Market size and forecast 2025-2030 ($ million)
Data Table on APAC - Market size and forecast 2025-2030 ($ million)
Chart on APAC - Year-over-year growth 2025-2030 (%)
Data Table on APAC - Year-over-year growth 2025-2030 (%)
Chart on Regional Comparison - APAC
Data Table on Regional Comparison - APAC

12.3.1 China - Market size and forecast 2025-2030

Chart on China - Market size and forecast 2025-2030 ($ million)
Data Table on China - Market size and forecast 2025-2030 ($ million)
Chart on China - Year-over-year growth 2025-2030 (%)
Data Table on China - Year-over-year growth 2025-2030 (%)

12.3.2 Japan - Market size and forecast 2025-2030

Chart on Japan - Market size and forecast 2025-2030 ($ million)
Data Table on Japan - Market size and forecast 2025-2030 ($ million)
Chart on Japan - Year-over-year growth 2025-2030 (%)
Data Table on Japan - Year-over-year growth 2025-2030 (%)

12.3.3 South Korea - Market size and forecast 2025-2030

Chart on South Korea - Market size and forecast 2025-2030 ($ million)
Data Table on South Korea - Market size and forecast 2025-2030 ($ million)
Chart on South Korea - Year-over-year growth 2025-2030 (%)
Data Table on South Korea - Year-over-year growth 2025-2030 (%)

12.3.4 India - Market size and forecast 2025-2030

Chart on India - Market size and forecast 2025-2030 ($ million)
Data Table on India - Market size and forecast 2025-2030 ($ million)
Chart on India - Year-over-year growth 2025-2030 (%)
Data Table on India - Year-over-year growth 2025-2030 (%)

12.3.5 Australia - Market size and forecast 2025-2030

Chart on Australia - Market size and forecast 2025-2030 ($ million)
Data Table on Australia - Market size and forecast 2025-2030 ($ million)
Chart on Australia - Year-over-year growth 2025-2030 (%)
Data Table on Australia - Year-over-year growth 2025-2030 (%)

12.3.6 Indonesia - Market size and forecast 2025-2030

Chart on Indonesia - Market size and forecast 2025-2030 ($ million)
Data Table on Indonesia - Market size and forecast 2025-2030 ($ million)
Chart on Indonesia - Year-over-year growth 2025-2030 (%)
Data Table on Indonesia - Year-over-year growth 2025-2030 (%)

12.4 North America - Market size and forecast 2025-2030

Chart on North America - Market size and forecast 2025-2030 ($ million)
Data Table on North America - Market size and forecast 2025-2030 ($ million)
Chart on North America - Year-over-year growth 2025-2030 (%)
Data Table on North America - Year-over-year growth 2025-2030 (%)
Chart on Regional Comparison - North America
Data Table on Regional Comparison - North America

12.4.1 US - Market size and forecast 2025-2030

Chart on US - Market size and forecast 2025-2030 ($ million)
Data Table on US - Market size and forecast 2025-2030 ($ million)
Chart on US - Year-over-year growth 2025-2030 (%)
Data Table on US - Year-over-year growth 2025-2030 (%)

12.4.2 Canada - Market size and forecast 2025-2030

Chart on Canada - Market size and forecast 2025-2030 ($ million)
Data Table on Canada - Market size and forecast 2025-2030 ($ million)
Chart on Canada - Year-over-year growth 2025-2030 (%)
Data Table on Canada - Year-over-year growth 2025-2030 (%)

12.4.3 Mexico - Market size and forecast 2025-2030

Chart on Mexico - Market size and forecast 2025-2030 ($ million)
Data Table on Mexico - Market size and forecast 2025-2030 ($ million)
Chart on Mexico - Year-over-year growth 2025-2030 (%)
Data Table on Mexico - Year-over-year growth 2025-2030 (%)

12.5 Europe - Market size and forecast 2025-2030

Chart on Europe - Market size and forecast 2025-2030 ($ million)
Data Table on Europe - Market size and forecast 2025-2030 ($ million)
Chart on Europe - Year-over-year growth 2025-2030 (%)
Data Table on Europe - Year-over-year growth 2025-2030 (%)
Chart on Regional Comparison - Europe
Data Table on Regional Comparison - Europe

12.5.1 Germany - Market size and forecast 2025-2030

Chart on Germany - Market size and forecast 2025-2030 ($ million)
Data Table on Germany - Market size and forecast 2025-2030 ($ million)
Chart on Germany - Year-over-year growth 2025-2030 (%)
Data Table on Germany - Year-over-year growth 2025-2030 (%)

12.5.2 France - Market size and forecast 2025-2030

Chart on France - Market size and forecast 2025-2030 ($ million)
Data Table on France - Market size and forecast 2025-2030 ($ million)
Chart on France - Year-over-year growth 2025-2030 (%)
Data Table on France - Year-over-year growth 2025-2030 (%)

12.5.3 UK - Market size and forecast 2025-2030

Chart on UK - Market size and forecast 2025-2030 ($ million)
Data Table on UK - Market size and forecast 2025-2030 ($ million)
Chart on UK - Year-over-year growth 2025-2030 (%)
Data Table on UK - Year-over-year growth 2025-2030 (%)

12.5.4 Italy - Market size and forecast 2025-2030

Chart on Italy - Market size and forecast 2025-2030 ($ million)
Data Table on Italy - Market size and forecast 2025-2030 ($ million)
Chart on Italy - Year-over-year growth 2025-2030 (%)
Data Table on Italy - Year-over-year growth 2025-2030 (%)

12.5.5 The Netherlands - Market size and forecast 2025-2030

Chart on The Netherlands - Market size and forecast 2025-2030 ($ million)
Data Table on The Netherlands - Market size and forecast 2025-2030 ($ million)
Chart on The Netherlands - Year-over-year growth 2025-2030 (%)
Data Table on The Netherlands - Year-over-year growth 2025-2030 (%)

12.5.6 Spain - Market size and forecast 2025-2030

Chart on Spain - Market size and forecast 2025-2030 ($ million)
Data Table on Spain - Market size and forecast 2025-2030 ($ million)
Chart on Spain - Year-over-year growth 2025-2030 (%)
Data Table on Spain - Year-over-year growth 2025-2030 (%)

12.6 Middle East and Africa - Market size and forecast 2025-2030

Chart on Middle East and Africa - Market size and forecast 2025-2030 ($ million)
Data Table on Middle East and Africa - Market size and forecast 2025-2030 ($ million)
Chart on Middle East and Africa - Year-over-year growth 2025-2030 (%)
Data Table on Middle East and Africa - Year-over-year growth 2025-2030 (%)
Chart on Regional Comparison - Middle East and Africa
Data Table on Regional Comparison - Middle East and Africa

12.6.1 Saudi Arabia - Market size and forecast 2025-2030

Chart on Saudi Arabia - Market size and forecast 2025-2030 ($ million)
Data Table on Saudi Arabia - Market size and forecast 2025-2030 ($ million)
Chart on Saudi Arabia - Year-over-year growth 2025-2030 (%)
Data Table on Saudi Arabia - Year-over-year growth 2025-2030 (%)

12.6.2 UAE - Market size and forecast 2025-2030

Chart on UAE - Market size and forecast 2025-2030 ($ million)
Data Table on UAE - Market size and forecast 2025-2030 ($ million)
Chart on UAE - Year-over-year growth 2025-2030 (%)
Data Table on UAE - Year-over-year growth 2025-2030 (%)

12.6.3 South Africa - Market size and forecast 2025-2030

Chart on South Africa - Market size and forecast 2025-2030 ($ million)
Data Table on South Africa - Market size and forecast 2025-2030 ($ million)
Chart on South Africa - Year-over-year growth 2025-2030 (%)
Data Table on South Africa - Year-over-year growth 2025-2030 (%)

12.6.4 Israel - Market size and forecast 2025-2030

Chart on Israel - Market size and forecast 2025-2030 ($ million)
Data Table on Israel - Market size and forecast 2025-2030 ($ million)
Chart on Israel - Year-over-year growth 2025-2030 (%)
Data Table on Israel - Year-over-year growth 2025-2030 (%)

12.6.5 Turkey - Market size and forecast 2025-2030

Chart on Turkey - Market size and forecast 2025-2030 ($ million)
Data Table on Turkey - Market size and forecast 2025-2030 ($ million)
Chart on Turkey - Year-over-year growth 2025-2030 (%)
Data Table on Turkey - Year-over-year growth 2025-2030 (%)

12.7 South America - Market size and forecast 2025-2030

Chart on South America - Market size and forecast 2025-2030 ($ million)
Data Table on South America - Market size and forecast 2025-2030 ($ million)
Chart on South America - Year-over-year growth 2025-2030 (%)
Data Table on South America - Year-over-year growth 2025-2030 (%)
Chart on Regional Comparison - South America
Data Table on Regional Comparison - South America

12.7.1 Brazil - Market size and forecast 2025-2030

Chart on Brazil - Market size and forecast 2025-2030 ($ million)
Data Table on Brazil - Market size and forecast 2025-2030 ($ million)
Chart on Brazil - Year-over-year growth 2025-2030 (%)
Data Table on Brazil - Year-over-year growth 2025-2030 (%)

12.7.2 Argentina - Market size and forecast 2025-2030

Chart on Argentina - Market size and forecast 2025-2030 ($ million)
Data Table on Argentina - Market size and forecast 2025-2030 ($ million)
Chart on Argentina - Year-over-year growth 2025-2030 (%)
Data Table on Argentina - Year-over-year growth 2025-2030 (%)

12.7.3 Colombia - Market size and forecast 2025-2030

Chart on Colombia - Market size and forecast 2025-2030 ($ million)
Data Table on Colombia - Market size and forecast 2025-2030 ($ million)
Chart on Colombia - Year-over-year growth 2025-2030 (%)
Data Table on Colombia - Year-over-year growth 2025-2030 (%)

12.8 Market opportunity by geography

Market opportunity by geography ($ million)
Data Tables on Market opportunity by geography ($ million)

13. Drivers, Challenges, and Opportunity

13.1 Market drivers

High initial investment and uncertain return on investment
Significant workforce skill gaps and cultural resistance to change
Cybersecurity vulnerabilities and system interoperability issues

13.2 Market challenges

Imperative for operational efficiency and cost reduction amid labor shortages
Increasing demand for complex, sustainable, and technologically advanced vessels
Strategic government initiatives and geopolitical imperatives

13.3 Impact of drivers and challenges

Impact of drivers and challenges in 2025 and 2030

13.4 Market opportunities

Proliferation of digital twin and end to end digital thread
Ascendancy of artificial intelligence and advanced robotic automation
Shift towards cloud platforms and collaborative digital ecosystems

14. Competitive Landscape

14.1 Overview

14.2

Overview on criticality of inputs and factors of differentiation

14.3 Landscape disruption

Overview on factors of disruption

14.4 Industry risks

Impact of key risks on business

15. Competitive Analysis

15.1 Companies profiled

Companies covered

15.2 Company ranking index

15.3 Market positioning of companies

Matrix on companies position and classification

15.4 ABB Ltd.

ABB Ltd. - Overview
ABB Ltd. - Business segments
ABB Ltd. - Key news
ABB Ltd. - Key offerings
ABB Ltd. - Segment focus
SWOT

15.5 Accenture PLC

Accenture PLC - Overview
Accenture PLC - Business segments
Accenture PLC - Key news
Accenture PLC - Key offerings
Accenture PLC - Segment focus
SWOT

15.6 Altair Engineering Inc.

Altair Engineering Inc. - Overview
Altair Engineering Inc. - Business segments
Altair Engineering Inc. - Key news
Altair Engineering Inc. - Key offerings
Altair Engineering Inc. - Segment focus
SWOT

15.7 BAE Systems Plc

BAE Systems Plc - Overview
BAE Systems Plc - Business segments
BAE Systems Plc - Key news
BAE Systems Plc - Key offerings
BAE Systems Plc - Segment focus
SWOT

15.8 Bentley Systems Inc.

Bentley Systems Inc. - Overview
Bentley Systems Inc. - Business segments
Bentley Systems Inc. - Key news
Bentley Systems Inc. - Key offerings
Bentley Systems Inc. - Segment focus
SWOT

15.9 Dassault Systemes SE

Dassault Systemes SE - Overview
Dassault Systemes SE - Business segments
Dassault Systemes SE - Key news
Dassault Systemes SE - Key offerings
Dassault Systemes SE - Segment focus
SWOT

15.10 Emerson Electric Co.

Emerson Electric Co. - Overview
Emerson Electric Co. - Business segments
Emerson Electric Co. - Key news
Emerson Electric Co. - Key offerings
Emerson Electric Co. - Segment focus
SWOT

15.11 Hexagon AB

Hexagon AB - Overview
Hexagon AB - Business segments
Hexagon AB - Key news
Hexagon AB - Key offerings
Hexagon AB - Segment focus
SWOT

15.12 Honeywell International Inc.

Honeywell International Inc. - Overview
Honeywell International Inc. - Business segments
Honeywell International Inc. - Key news
Honeywell International Inc. - Key offerings
Honeywell International Inc. - Segment focus
SWOT

15.13 IFS World Operations AB

IFS World Operations AB - Overview
IFS World Operations AB - Product / Service
IFS World Operations AB - Key offerings
SWOT

15.14 Inmarsat Global Ltd.

Inmarsat Global Ltd. - Overview
Inmarsat Global Ltd. - Product / Service
Inmarsat Global Ltd. - Key news
Inmarsat Global Ltd. - Key offerings
SWOT

15.15 Rockwell Automation Inc.

Rockwell Automation Inc. - Overview
Rockwell Automation Inc. - Business segments
Rockwell Automation Inc. - Key news
Rockwell Automation Inc. - Key offerings
Rockwell Automation Inc. - Segment focus
SWOT

15.16 Schneider Electric SE

Schneider Electric SE - Overview
Schneider Electric SE - Business segments
Schneider Electric SE - Key news
Schneider Electric SE - Key offerings
Schneider Electric SE - Segment focus
SWOT

15.17 Siemens AG

Siemens AG - Overview
Siemens AG - Business segments
Siemens AG - Key news
Siemens AG - Key offerings
Siemens AG - Segment focus
SWOT

15.18 Wartsila Corp.

Wartsila Corp. - Overview
Wartsila Corp. - Business segments
Wartsila Corp. - Key news
Wartsila Corp. - Key offerings
Wartsila Corp. - Segment focus
SWOT

16. Appendix

16.1 Scope of the report

Market definition
Objectives
Notes and caveats

16.2 Inclusions and exclusions checklist

Inclusions checklist
Exclusions checklist

16.3 Currency conversion rates for US$

16.4 Research methodology

16.5 Data procurement

Information sources

16.6 Data validation

16.7 Validation techniques employed for market sizing

16.8 Data synthesis

16.9 360 degree market analysis

16.10 List of abbreviations

Research Methodology

Technavio presents a detailed picture of the market by way of study, synthesis, and summation of data from multiple sources. The analysts have presented the various facets of the market with a particular focus on identifying the key industry influencers. The data thus presented is comprehensive, reliable, and the result of extensive research, both primary and secondary.

INFORMATION SOURCES

Primary sources

  • Manufacturers and suppliers
  • Channel partners
  • Industry experts
  • Strategic decision makers

Secondary sources

  • Industry journals and periodicals
  • Government data
  • Financial reports of key industry players
  • Historical data
  • Press releases

DATA ANALYSIS

Data Synthesis

  • Collation of data
  • Estimation of key figures
  • Analysis of derived insights

Data Validation

  • Triangulation with data models
  • Reference against proprietary databases
  • Corroboration with industry experts

REPORT WRITING

Qualitative

  • Market drivers
  • Market challenges
  • Market trends
  • Five forces analysis

Quantitative

  • Market size and forecast
  • Market segmentation
  • Geographical insights
  • Competitive landscape

Interested in this report?

Get your sample now to see our research methodology and insights!

Download Now

Frequently Asked Questions

Digital Shipyard market growth will increase by USD 3129.2 million during 2026-2030 .

The Digital Shipyard market is expected to grow at a CAGR of 18.7% during 2026-2030 .

Digital Shipyard market is segmented by Deployment (On-premises, Cloud) Type (Commercial shipyards, Naval and defense shipyards, Specialized shipyards) Application (Medium shipyards, Large shipyards, Small shipyards)

ABB Ltd., Accenture PLC, Altair Engineering Inc., Aras Corp., BAE Systems Plc, Bentley Systems Inc., Damen Shipyards Group, Dassault Systemes SE, Emerson Electric Co., Hexagon AB, Honeywell International Inc., IFS World Operations AB, Inmarsat Global Ltd., Navantia SA, Rockwell Automation Inc., Schneider Electric SE, Siemens AG, Wartsila Corp. are a few of the key vendors in the Digital Shipyard market.

APAC will register the highest growth rate of 34.8% among the other regions. Therefore, the Digital Shipyard market in APAC is expected to garner significant business opportunities for the vendors during the forecast period.

China, Japan, South Korea, India, Australia, Indonesia, US, Canada, Mexico, Germany, France, UK, Italy, The Netherlands, Spain, Saudi Arabia, UAE, South Africa, Israel, Turkey, Brazil, Argentina, Colombia

  • High initial investment and uncertain return on investment is the driving factor this market.

The Digital Shipyard market vendors should focus on grabbing business opportunities from the Deployment segment as it accounted for the largest market share in the base year.