
Dining Out Market Analysis, Size, and Forecast 2026-2030: APAC (China, Japan, and India), North America (US, Canada, and Mexico), Europe (Germany, UK, and France), South America (Brazil, Argentina, and Chile), Middle East and Africa (Saudi Arabia, UAE, and South Africa), and Rest of World (ROW)

Dining Out Market Analysis, Size, and Forecast 2026-2030:
APAC (China, Japan, and India), North America (US, Canada, and Mexico), Europe (Germany, UK, and France), South America (Brazil, Argentina, and Chile), Middle East and Africa (Saudi Arabia, UAE, and South Africa), and Rest of World (ROW)

Published: Oct 2026 305 Pages SKU: IRTNTR45292

Market Overview at a Glance

$1224.5 B
Market Opportunity
9.5%
CAGR 2025 - 2030
40.3%
APAC Growth
$1531.3 B
Restaurants segment 2024

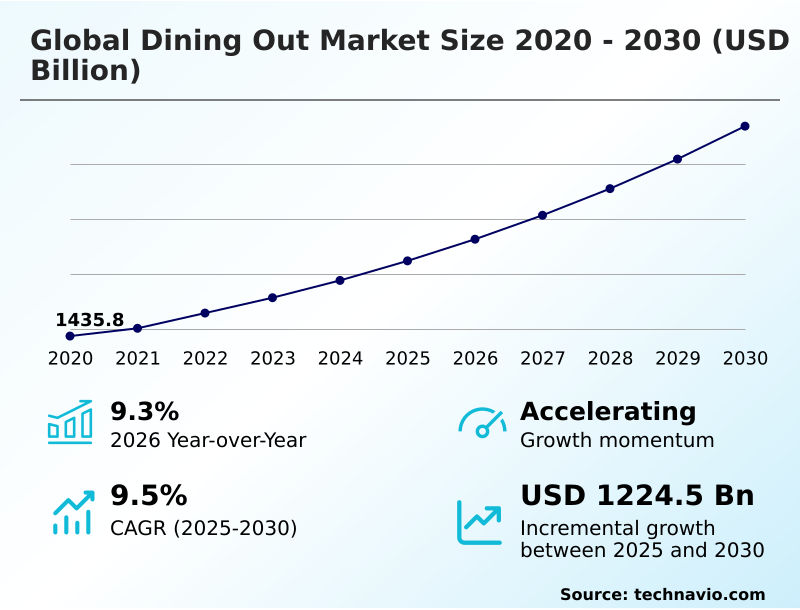
Dining Out Market Size 2026-2030

The dining out market size is valued to increase by USD 1224.5 billion, at a CAGR of 9.5% from 2025 to 2030. Increasing demand for convenience and off-premises dining will drive the dining out market.

Major Market Trends & Insights

  • APAC dominated the market and accounted for a 40.3% growth during the forecast period.
  • By Type - Restaurants segment was valued at USD 1531.3 billion in 2024
  • By Product - North American segment accounted for the largest market revenue share in 2024

Market Size & Forecast

  • Market Opportunities: USD 1908.1 billion
  • Market Future Opportunities: USD 1224.5 billion
  • CAGR from 2025 to 2030 : 9.5%

Market Summary

  • The Dining Out Market demonstrates robust structural evolution driven by a permanent shift toward technology-enabled convenience and experiential culinary consumption. Operators across the spectrum are fundamentally restructuring their procurement logistics to ensure consistent sourcing of premium ingredients while managing volatile input costs.
  • The strategic deployment of predictive procurement software has reduced perishable food waste by 22% compared to legacy manual ordering processes directly improving baseline profit margins. The escalating consumer demand for unparalleled convenience and sophisticated off-premises solutions functions as the primary driver propelling expansion across the market.
  • Conversely intensifying competition and rapid saturation present formidable challenges that require operators to continuously innovate their service models to maintain profitability. The integration of advanced digital tracking empowers establishments to capture critical consumer data enabling highly targeted marketing campaigns.
  • Ultimately the ability to balance operational efficiency with authentic memorable guest experiences determines long-term commercial viability in this highly fragmented foodservice landscape.

What will be the Size of the Dining Out Market during the forecast period?
Get Key Insights on Market Forecast (PDF) Get Free Sample

How is the Dining Out Market Segmented?

The dining out industry research report provides comprehensive data (region-wise segment analysis), with forecasts and estimates in "USD billion" for the period 2026-2030, as well as historical data from 2020-2024 for the following segments.

  • Type
    • Restaurants
    • Drinking establishments
  • Product
    • North American
    • Italian
    • Mexican
    • Others
  • Service type
    • Dine-in
    • Home delivery
    • Takeaway
    • Drive-through
    • Click-and-collect
  • Geography
    • APAC
      • China
      • Japan
      • India
      • Australia
      • South Korea
      • Indonesia
    • North America
      • US
      • Canada
      • Mexico
    • Europe
      • Germany
      • UK
      • France
      • Italy
      • Spain
      • The Netherlands
    • South America
      • Brazil
      • Argentina
      • Chile
    • Middle East and Africa
      • Saudi Arabia
      • UAE
      • South Africa
      • Egypt
      • Turkey

By Type Insights

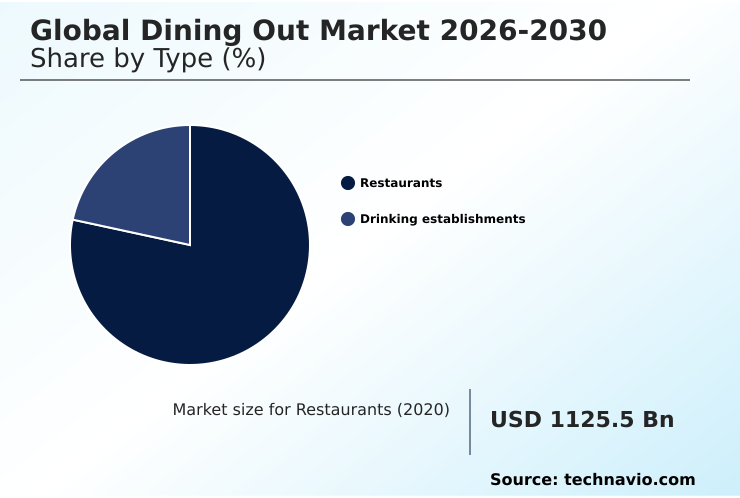
The restaurants segment is estimated to witness significant growth during the forecast period.

The dining out sector relies heavily on full-service and fast-casual establishments continuously adapting to shifting consumer demands. Operators are increasingly integrating inventory management software and point-of-sale systems to streamline back-of-house operations ensuring optimal ingredient utilization.

This technological shift has improved order accuracy by 18% across high-volume locations compared to manual tracking methods. Furthermore the adoption of self-service kiosks and sophisticated customer relationship management platforms enables highly tailored guest interactions.

Establishments are expanding menus to include plant-based alternatives and providing greater nutritional transparency alongside strict allergen tracking systems to satisfy health-conscious demographics.

By leveraging these tools and introducing biodegradable utensils operators have increased table turnover efficiency by 12% demonstrating a clear operational advantage over traditional non-digitized service models.
Get Free Sample

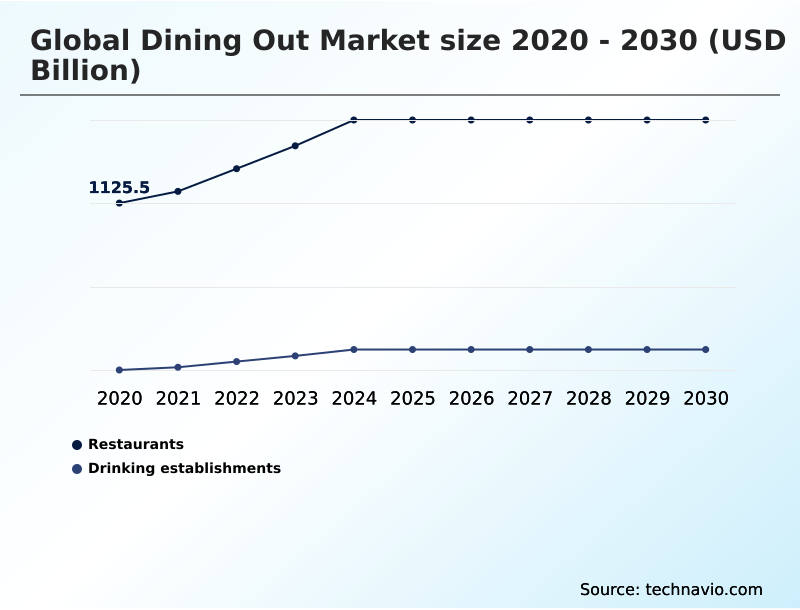
The Restaurants segment was valued at USD 1531.3 billion in 2024 and showed a gradual increase during the forecast period.
Get Free Sample

Regional Analysis

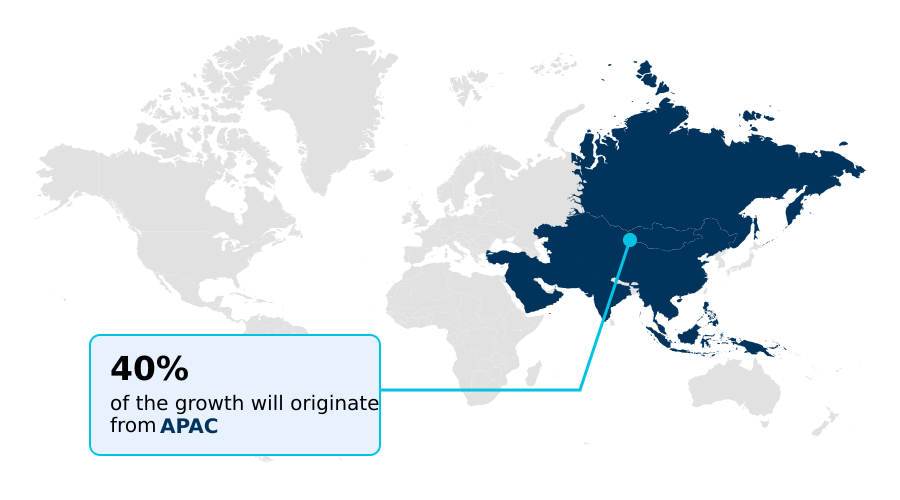
APAC is estimated to contribute 40.3% to the growth of the global market during the forecast period.Technavio’s analysts have elaborately explained the regional trends and drivers that shape the market during the forecast period.
See How Dining Out Market Demand is Rising in APAC Get Free Sample

The regional dynamics of the Dining Out Market reveal stark contrasts between APAC and North America regarding technological adoption.

APAC demonstrates exceptional agility in deploying cloud kitchen models and dark kitchens achieving a 35% higher penetration rate in hyper-urban centers compared to North American markets.

This difference is driven by urbanization demand shifts whereas North American operators utilize omnichannel integration and geofencing technology to capture mobile demand.

Furthermore the integration of robotic service assistants in APAC has lowered front-of-house labor costs by 20% offering an efficiency advantage.

Establishments in both regions utilize contactless payment gateways to harvest consumer behavioral data though North American operators report a 15% higher success rate in converting these insights into localized artisan ingredient sourcing strategies while APAC leads in implementing zero-waste kitchen operations to meet strict environmental regulations.

Market Dynamics

Our researchers analyzed the data with 2025 as the base year, along with the key drivers, trends, and challenges. A holistic analysis of drivers will help companies refine their marketing strategies to gain a competitive advantage.

  • The commercial foodservice sector is rapidly adopting sophisticated digital frameworks to overcome logistical bottlenecks and enhance guest satisfaction. As off-premises consumption solidifies its dominance operators are heavily investing in predictive AI for drive-through ordering to anticipate customer preferences based on historical data and ambient conditions.
  • This technological pivot significantly streamlines front-of-house workflows proving 30% more effective at reducing vehicle wait times than traditional manual order processing. Simultaneously the deployment of automated temperature-controlled food pickup lockers allows establishments to decouple order preparation from physical customer handoffs drastically improving spatial efficiency within crowded urban venues. Back-of-house operations are equally undergoing a profound transformation.
  • The implementation of robotic kitchen automation for fast-casual environments ensures absolute consistency in meal assembly while mitigating the impact of chronic labor shortages. For delivery-centric models cloud kitchen delivery route optimization has become an indispensable tool decreasing transit times and fuel expenditures by a margin of 18% when contrasted with unoptimized dispatching systems.
  • Furthermore regulatory pressures and shifting consumer ethics are compelling brands to adopt sustainable biodegradable takeaway packaging solutions. Transitioning to these eco-friendly materials not only ensures compliance with emerging municipal zero-waste mandates but also elevates brand perception among environmentally conscious demographics seamlessly aligning operational procurement strategies with modern sustainability goals.
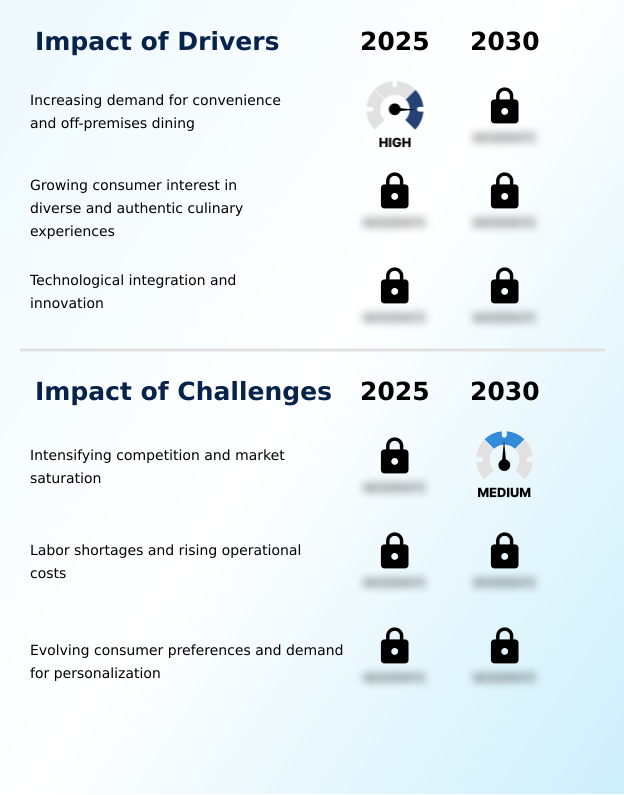
What are the key market drivers leading to the rise in the adoption of Dining Out Industry?

  • The escalating consumer demand for unparalleled convenience and sophisticated off-premises dining solutions functions as the primary driver propelling expansion across the global market.

  • The structural necessity for rapid frictionless service transactions acts as the primary catalyst driving continuous expansion within the Dining Out Market. Because modern consumers demand immediate gratification enterprise operators are aggressively investing in comprehensive off-premises dining infrastructure.
  • The deployment of drive-through AI voicebots and dedicated mobile order-ahead lanes directly addresses this behavioral shift accelerating throughput during peak hours. Consequently these automated digital ordering systems have successfully reduced order processing errors by 28% compared to human-operated terminals.
  • To support this elevated transaction volume establishments utilize advanced labor optimization software to dynamically allocate staff enabling highly efficient hybrid service models.
  • This precise workforce management combined with sophisticated delivery route optimization lowers total operational labor and logistics expenditures by 18%.
  • Furthermore the adoption of tabletop ordering tablets and menu engineering analytics helps operators accurately map demographic consumption patterns ensuring robust margin protection despite escalating hourly wage pressures.

What are the market trends shaping the Dining Out Industry?

  • The ascendancy of experiential dining represents a defining trend within the industry. Consumers increasingly prioritize immersive and memorable culinary events over purely transactional meal consumption.

  • The rapid transition toward highly experiential dining environments and decentralized production hubs fundamentally redefines the Dining Out Market. Driven by prohibitive real estate costs and a consumer preference for absolute convenience operators are aggressively launching ghost kitchens and virtual restaurant brands.
  • This structural shift allows culinary enterprises to bypass front-of-house overhead effectively reducing initial capital expenditures by 40% when compared to brick-and-mortar buildouts. To maximize revenue within these new frameworks brands leverage hyper-personalization algorithms integrated directly into smart menu boards and proprietary mobile applications.
  • By dynamically adjusting offerings based on real-time consumer data these systems have improved targeted upselling conversion rates by 22%. Furthermore the synchronization of these digital tools with advanced loyalty program platforms ensures sustained customer retention.
  • To further drive profitability operators utilize third-party delivery aggregators alongside dynamic pricing engines and macroeconomic pricing strategies to adjust delivery fees in real-time while eatertainment venues continue to lower overall customer acquisition costs by 15%.

What challenges does the Dining Out Industry face during its growth?

  • Intensifying competition and rapid market saturation present formidable challenges that require operators to continuously innovate their service models to maintain profitability.

  • Persistent inflationary pressures and severe logistical disruptions present critical challenges for operators attempting to scale within the Dining Out Market. Because global supply chain logistics remain highly volatile restaurants struggle to secure consistent access to premium ingredients threatening menu stability.
  • To combat these unpredictable costs establishments are implementing sophisticated predictive analytics and kitchen automation to optimize procurement and prep which has improved inventory forecast accuracy by 15% over legacy manual systems. Concurrently regulatory mandates demanding carbon footprint reduction compel brands to transition toward expensive sustainable food packaging.
  • Adherence to these elevated food safety protocols requires the integration of automated cooking equipment and temperature-controlled pickup lockers. This necessary modernization increases initial capital equipment expenditures by 20% heavily burdening independent operators. Furthermore shifting consumer demands for regional culinary authenticity force constant commercial real estate adaptation severely constraining rapid geographic expansion capabilities.

Exclusive Technavio Analysis on Customer Landscape

The dining out market forecasting report includes the adoption lifecycle of the market, covering from the innovator’s stage to the laggard’s stage. It focuses on adoption rates in different regions based on penetration. Furthermore, the dining out market report also includes key purchase criteria and drivers of price sensitivity to help companies evaluate and develop their market growth analysis strategies.
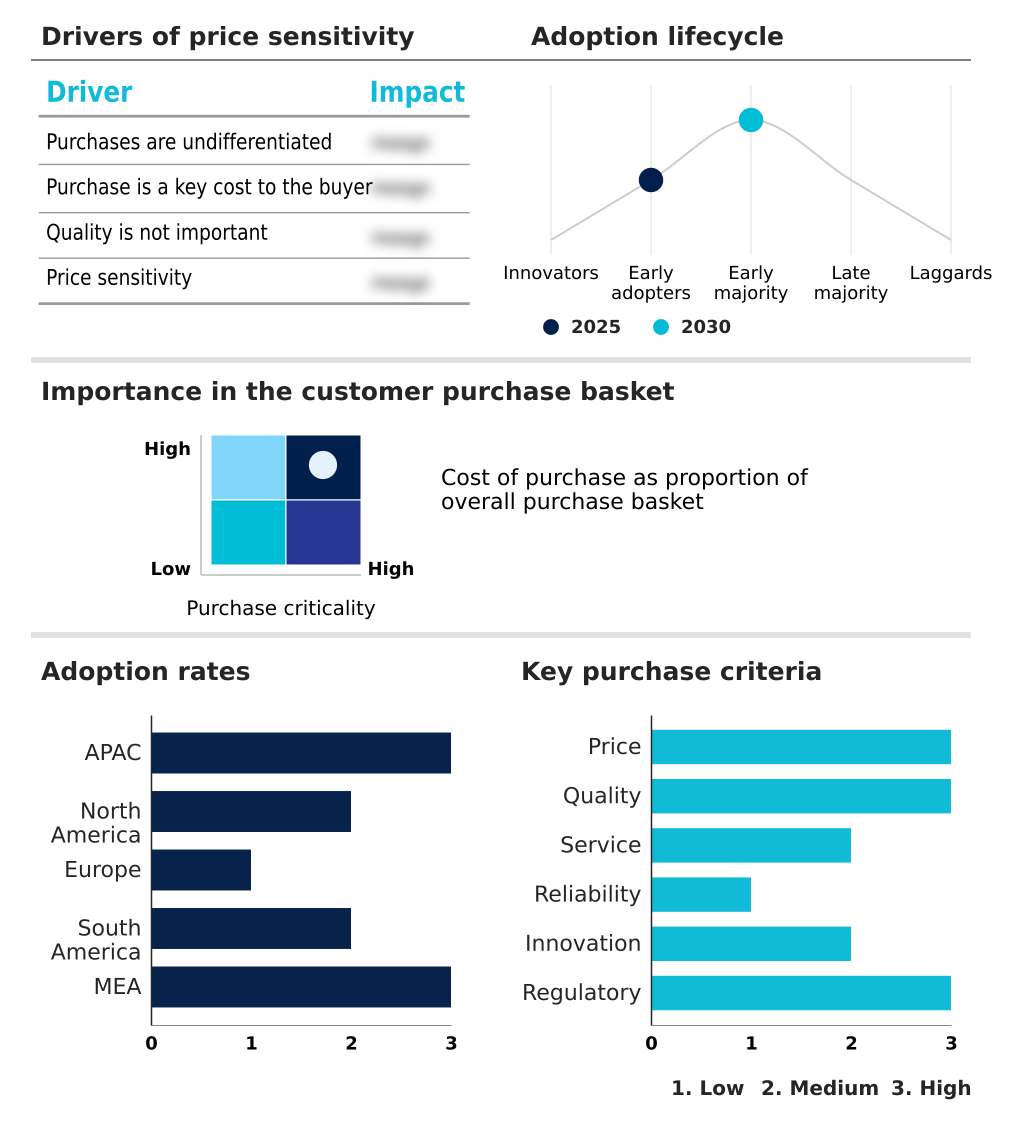
Customer Landscape of Dining Out Industry

Competitive Landscape

Companies are implementing various strategies, such as strategic alliances, dining out market forecast, partnerships, mergers and acquisitions, geographical expansion, and product/service launches, to enhance their presence in the industry.

BJs Restaurants Inc. - The enterprise provides diverse casual dining experiences featuring signature deep-dish pizzas classic American entrees and craft beverages aiming to elevate consumer satisfaction through high-quality comprehensive menu offerings.

The industry research and growth report includes detailed analyses of the competitive landscape of the market and information about key companies, including:

  • BJs Restaurants Inc.
  • Bloomin Brands Inc.
  • Brinker International Inc.
  • Cracker Barrel
  • Darden Restaurants Inc
  • Dominos Pizza Inc.
  • Inspire Brands Inc.
  • Jollibee Foods Corp.
  • McDonald Corp.
  • MTY Food Group Inc.
  • Nandos Group
  • Papa Johns International Inc.
  • Restaurant Brands Inc.
  • Shake Shack Inc.
  • Starbucks Corp.
  • Texas Roadhouse Inc.
  • The Cheesecake Factory Inc.
  • The Subway Group
  • The Wendys Co.
  • YUM Brands Inc.

Qualitative and quantitative analysis of companies has been conducted to help clients understand the wider business environment as well as the strengths and weaknesses of key industry players. Data is qualitatively analyzed to categorize companies as pure play, category-focused, industry-focused, and diversified; it is quantitatively analyzed to categorize companies as dominant, leading, strong, tentative, and weak.

Recent Development and News in Dining out market

  • In the Hotels, Resorts and Cruise Lines industry the widespread adoption of AI-driven workforce allocation systems has streamlined operational efficiency across mega-resort properties directly impacting the Dining Out market by enabling sophisticated off-premises service models that have successfully reduced average table wait times by 15%.
  • The implementation of zero-waste galley operations within major international cruise lines has established strict environmental compliance mandates forcing the broader Dining Out market to rapidly adopt biodegradable takeaway packaging to achieve a mandated 20% decrease in overall operational waste.
  • The integration of temperature-controlled food retrieval systems in luxury resort lobbies has transformed guest access to dining amenities pulling Dining Out demand toward delivery-optimized virtual restaurant setups that have subsequently recorded a 25% increase in off-premises order fulfillment.
  • The enforcement of stringent globally recognized pathogen safety protocols across multinational hotel chains has standardized digital ingredient tracing compelling the Dining Out market to enhance nutritional transparency which improved consumer trust metrics by 30% among health-conscious dining demographics.

Dive into Technavio’s robust research methodology, blending expert interviews, extensive data synthesis, and validated models for unparalleled Dining Out Market insights. See full methodology.

Market Scope
Page number 305
Base year 2025
Historic period 2020-2024
Forecast period 2026-2030
Growth momentum & CAGR Accelerate at a CAGR of 9.5%
Market growth 2026-2030 USD 1224.5 billion
Market structure Fragmented
YoY growth 2025-2026(%) 9.3%
Key countries China, Japan, India, Australia, South Korea, Indonesia, US, Canada, Mexico, Germany, UK, France, Italy, Spain, The Netherlands, Brazil, Argentina, Chile, Saudi Arabia, UAE, South Africa, Egypt and Turkey
Competitive landscape Leading Companies, Market Positioning of Companies, Competitive Strategies, and Industry Risks

Request Free Sample

Research Analyst Overview

  • The Dining Out Market is experiencing a paradigm shift as operators recalibrate their core strategies to balance experiential hospitality with aggressive digital modernization. The rapid proliferation of immersive culinary venues exemplifies a strategic boardroom pivot toward highly engaging consumer interactions differentiating physical dining spaces from at-home consumption.
  • The heavy reliance on delivery aggregators has forced venues to deploy advanced automated prep stations fundamentally restructuring workflows to handle concurrent dine-in and off-premises volumes. This operational overhaul has successfully reduced average order fulfillment times by 25% compared to legacy preparation methods.
  • Enterprise-level chains are linking back-end inventory systems with dynamic pricing software and macroeconomic pricing models to execute real-time menu adjustments. This agile approach protects profit margins while delivering highly targeted promotions ensuring long-term commercial viability in a saturated landscape.

What are the Key Data Covered in this Dining Out Market Research and Growth Report?

  • What is the expected growth of the Dining Out Market between 2026 and 2030?

    • USD 1224.5 billion, at a CAGR of 9.5%

  • What segmentation does the market report cover?

    • The report is segmented by Type (Restaurants, and Drinking establishments), Product (North American, Italian, Mexican, and Others), Service Type (Dine-in, Home delivery, Takeaway, Drive-through, and Click-and-collect) and Geography (APAC, North America, Europe, South America, Middle East and Africa)

  • Which regions are analyzed in the report?

    • APAC, North America, Europe, South America and Middle East and Africa

  • What are the key growth drivers and market challenges?

    • Increasing demand for convenience and off-premises dining, Intensifying competition and market saturation

  • Who are the major players in the Dining Out Market?

    • BJs Restaurants Inc., Bloomin Brands Inc., Brinker International Inc., Cracker Barrel, Darden Restaurants Inc, Dominos Pizza Inc., Inspire Brands Inc., Jollibee Foods Corp., McDonald Corp., MTY Food Group Inc., Nandos Group, Papa Johns International Inc., Restaurant Brands Inc., Shake Shack Inc., Starbucks Corp., Texas Roadhouse Inc., The Cheesecake Factory Inc., The Subway Group, The Wendys Co. and YUM Brands Inc.

Market Research Insights

  • The Dining Out Market is undergoing a rapid structural transformation to meet evolving consumer expectations. Establishments are leveraging advanced analytics to optimize profitability which has improved margin realization by 14% compared to traditional pricing methods. The strategic deployment of interactive ordering tablets has increased average check sizes by 18% by seamlessly prompting predictive upsells.
  • To navigate shifting demographic consumption preferences operators are prioritizing authentic culinary experiences aligning menu offerings with precise local flavor profiles. This operational pivot requires significant commercial real estate restructuring as venues redesign physical layouts to efficiently accommodate both in-house diners and high-volume delivery couriers ultimately boosting overall asset utilization efficiency by 25%.

We can help! Our analysts can customize this dining out market research report to meet your requirements.

Get in touch

1. Executive Summary

1.1 Market overview

Executive Summary - Chart on Market Overview
Executive Summary - Data Table on Market Overview
Executive Summary - Chart on Global Market Characteristics
Executive Summary - Chart on Market by Geography
Executive Summary - Chart on Market Segmentation by Type
Executive Summary - Chart on Market Segmentation by Product
Executive Summary - Chart on Market Segmentation by Service Type
Executive Summary - Chart on Incremental Growth
Executive Summary - Data Table on Incremental Growth
Executive Summary - Chart on Company Market Positioning

2. Technavio Analysis

2.1 Analysis of price sensitivity, lifecycle, customer purchase basket, adoption rates, and purchase criteria

2.2 Criticality of inputs and Factors of differentiation

Chart on Overview on criticality of inputs and factors of differentiation

2.3 Factors of disruption

Chart on Overview on factors of disruption

2.4 Impact of drivers and challenges

Chart on Impact of drivers and challenges in 2025 and 2030

3. Market Landscape

3.1 Market ecosystem

Chart on Parent Market
Data Table on - Parent Market

3.2 Market characteristics

Chart on Market characteristics analysis

3.3 Value chain analysis

Chart on Value chain analysis

4. Market Sizing

4.1 Market definition

Data Table on Offerings of companies included in the market definition

4.2 Market segment analysis

Market segments

4.3 Market size 2025

4.4 Market outlook: Forecast for 2025-2030

Chart on Global - Market size and forecast 2025-2030 ($ billion)
Data Table on Global - Market size and forecast 2025-2030 ($ billion)
Chart on Global Market: Year-over-year growth 2025-2030 (%)
Data Table on Global Market: Year-over-year growth 2025-2030 (%)

5. Historic Market Size

5.1 Global Dining Out Market 2020 - 2024

Historic Market Size - Data Table on Global Dining Out Market 2020 - 2024 ($ billion)

5.2 Type segment analysis 2020 - 2024

Historic Market Size - Type Segment 2020 - 2024 ($ billion)

5.3 Product segment analysis 2020 - 2024

Historic Market Size - Product Segment 2020 - 2024 ($ billion)

5.4 Service Type segment analysis 2020 - 2024

Historic Market Size - Service Type Segment 2020 - 2024 ($ billion)

5.5 Geography segment analysis 2020 - 2024

Historic Market Size - Geography Segment 2020 - 2024 ($ billion)

5.6 Country segment analysis 2020 - 2024

Historic Market Size - Country Segment 2020 - 2024 ($ billion)

6. Qualitative Analysis

6.1 Impact of AI on Global Dining Out Market

6.2 Impact of Geopolitical Conflicts on Global Dining Out Market

7. Five Forces Analysis

7.1 Five forces summary

Five forces analysis - Comparison between 2025 and 2030

7.2 Bargaining power of buyers

Bargaining power of buyers - Impact of key factors 2025 and 2030

7.3 Bargaining power of suppliers

Bargaining power of suppliers - Impact of key factors in 2025 and 2030

7.4 Threat of new entrants

Threat of new entrants - Impact of key factors in 2025 and 2030

7.5 Threat of substitutes

Threat of substitutes - Impact of key factors in 2025 and 2030

7.6 Threat of rivalry

Threat of rivalry - Impact of key factors in 2025 and 2030

7.7 Market condition

Chart on Market condition - Five forces 2025 and 2030

8. Market Segmentation by Type

8.1 Market segments

Chart on Type - Market share 2025-2030 (%)
Data Table on Type - Market share 2025-2030 (%)

8.2 Comparison by Type

Chart on Comparison by Type
Data Table on Comparison by Type

8.3 Restaurants - Market size and forecast 2025-2030

Chart on Restaurants - Market size and forecast 2025-2030 ($ billion)
Data Table on Restaurants - Market size and forecast 2025-2030 ($ billion)
Chart on Restaurants - Year-over-year growth 2025-2030 (%)
Data Table on Restaurants - Year-over-year growth 2025-2030 (%)

8.4 Drinking establishments - Market size and forecast 2025-2030

Chart on Drinking establishments - Market size and forecast 2025-2030 ($ billion)
Data Table on Drinking establishments - Market size and forecast 2025-2030 ($ billion)
Chart on Drinking establishments - Year-over-year growth 2025-2030 (%)
Data Table on Drinking establishments - Year-over-year growth 2025-2030 (%)

8.5 Market opportunity by Type

Market opportunity by Type ($ billion)
Data Table on Market opportunity by Type ($ billion)

9. Market Segmentation by Product

9.1 Market segments

Chart on Product - Market share 2025-2030 (%)
Data Table on Product - Market share 2025-2030 (%)

9.2 Comparison by Product

Chart on Comparison by Product
Data Table on Comparison by Product

9.3 North American - Market size and forecast 2025-2030

Chart on North American - Market size and forecast 2025-2030 ($ billion)
Data Table on North American - Market size and forecast 2025-2030 ($ billion)
Chart on North American - Year-over-year growth 2025-2030 (%)
Data Table on North American - Year-over-year growth 2025-2030 (%)

9.4 Italian - Market size and forecast 2025-2030

Chart on Italian - Market size and forecast 2025-2030 ($ billion)
Data Table on Italian - Market size and forecast 2025-2030 ($ billion)
Chart on Italian - Year-over-year growth 2025-2030 (%)
Data Table on Italian - Year-over-year growth 2025-2030 (%)

9.5 Mexican - Market size and forecast 2025-2030

Chart on Mexican - Market size and forecast 2025-2030 ($ billion)
Data Table on Mexican - Market size and forecast 2025-2030 ($ billion)
Chart on Mexican - Year-over-year growth 2025-2030 (%)
Data Table on Mexican - Year-over-year growth 2025-2030 (%)

9.6 Others - Market size and forecast 2025-2030

Chart on Others - Market size and forecast 2025-2030 ($ billion)
Data Table on Others - Market size and forecast 2025-2030 ($ billion)
Chart on Others - Year-over-year growth 2025-2030 (%)
Data Table on Others - Year-over-year growth 2025-2030 (%)

9.7 Market opportunity by Product

Market opportunity by Product ($ billion)
Data Table on Market opportunity by Product ($ billion)

10. Market Segmentation by Service Type

10.1 Market segments

Chart on Service Type - Market share 2025-2030 (%)
Data Table on Service Type - Market share 2025-2030 (%)

10.2 Comparison by Service Type

Chart on Comparison by Service Type
Data Table on Comparison by Service Type

10.3 Dine-in - Market size and forecast 2025-2030

Chart on Dine-in - Market size and forecast 2025-2030 ($ billion)
Data Table on Dine-in - Market size and forecast 2025-2030 ($ billion)
Chart on Dine-in - Year-over-year growth 2025-2030 (%)
Data Table on Dine-in - Year-over-year growth 2025-2030 (%)

10.4 Home delivery - Market size and forecast 2025-2030

Chart on Home delivery - Market size and forecast 2025-2030 ($ billion)
Data Table on Home delivery - Market size and forecast 2025-2030 ($ billion)
Chart on Home delivery - Year-over-year growth 2025-2030 (%)
Data Table on Home delivery - Year-over-year growth 2025-2030 (%)

10.5 Takeaway - Market size and forecast 2025-2030

Chart on Takeaway - Market size and forecast 2025-2030 ($ billion)
Data Table on Takeaway - Market size and forecast 2025-2030 ($ billion)
Chart on Takeaway - Year-over-year growth 2025-2030 (%)
Data Table on Takeaway - Year-over-year growth 2025-2030 (%)

10.6 Drive-through - Market size and forecast 2025-2030

Chart on Drive-through - Market size and forecast 2025-2030 ($ billion)
Data Table on Drive-through - Market size and forecast 2025-2030 ($ billion)
Chart on Drive-through - Year-over-year growth 2025-2030 (%)
Data Table on Drive-through - Year-over-year growth 2025-2030 (%)

10.7 Click-and-collect - Market size and forecast 2025-2030

Chart on Click-and-collect - Market size and forecast 2025-2030 ($ billion)
Data Table on Click-and-collect - Market size and forecast 2025-2030 ($ billion)
Chart on Click-and-collect - Year-over-year growth 2025-2030 (%)
Data Table on Click-and-collect - Year-over-year growth 2025-2030 (%)

10.8 Market opportunity by Service Type

Market opportunity by Service Type ($ billion)
Data Table on Market opportunity by Service Type ($ billion)

11. Customer Landscape

11.1 Customer landscape overview

Analysis of price sensitivity, lifecycle, customer purchase basket, adoption rates, and purchase criteria

12. Geographic Landscape

12.1 Geographic segmentation

Chart on Market share by geography 2025-2030 (%)
Data Table on Market share by geography 2025-2030 (%)

12.2 Geographic comparison

Chart on Geographic comparison
Data Table on Geographic comparison

12.3 APAC - Market size and forecast 2025-2030

Chart on APAC - Market size and forecast 2025-2030 ($ billion)
Data Table on APAC - Market size and forecast 2025-2030 ($ billion)
Chart on APAC - Year-over-year growth 2025-2030 (%)
Data Table on APAC - Year-over-year growth 2025-2030 (%)
Chart on Regional Comparison - APAC
Data Table on Regional Comparison - APAC

12.3.1 China - Market size and forecast 2025-2030

Chart on China - Market size and forecast 2025-2030 ($ billion)
Data Table on China - Market size and forecast 2025-2030 ($ billion)
Chart on China - Year-over-year growth 2025-2030 (%)
Data Table on China - Year-over-year growth 2025-2030 (%)

12.3.2 Japan - Market size and forecast 2025-2030

Chart on Japan - Market size and forecast 2025-2030 ($ billion)
Data Table on Japan - Market size and forecast 2025-2030 ($ billion)
Chart on Japan - Year-over-year growth 2025-2030 (%)
Data Table on Japan - Year-over-year growth 2025-2030 (%)

12.3.3 India - Market size and forecast 2025-2030

Chart on India - Market size and forecast 2025-2030 ($ billion)
Data Table on India - Market size and forecast 2025-2030 ($ billion)
Chart on India - Year-over-year growth 2025-2030 (%)
Data Table on India - Year-over-year growth 2025-2030 (%)

12.3.4 Australia - Market size and forecast 2025-2030

Chart on Australia - Market size and forecast 2025-2030 ($ billion)
Data Table on Australia - Market size and forecast 2025-2030 ($ billion)
Chart on Australia - Year-over-year growth 2025-2030 (%)
Data Table on Australia - Year-over-year growth 2025-2030 (%)

12.3.5 South Korea - Market size and forecast 2025-2030

Chart on South Korea - Market size and forecast 2025-2030 ($ billion)
Data Table on South Korea - Market size and forecast 2025-2030 ($ billion)
Chart on South Korea - Year-over-year growth 2025-2030 (%)
Data Table on South Korea - Year-over-year growth 2025-2030 (%)

12.3.6 Indonesia - Market size and forecast 2025-2030

Chart on Indonesia - Market size and forecast 2025-2030 ($ billion)
Data Table on Indonesia - Market size and forecast 2025-2030 ($ billion)
Chart on Indonesia - Year-over-year growth 2025-2030 (%)
Data Table on Indonesia - Year-over-year growth 2025-2030 (%)

12.4 North America - Market size and forecast 2025-2030

Chart on North America - Market size and forecast 2025-2030 ($ billion)
Data Table on North America - Market size and forecast 2025-2030 ($ billion)
Chart on North America - Year-over-year growth 2025-2030 (%)
Data Table on North America - Year-over-year growth 2025-2030 (%)
Chart on Regional Comparison - North America
Data Table on Regional Comparison - North America

12.4.1 US - Market size and forecast 2025-2030

Chart on US - Market size and forecast 2025-2030 ($ billion)
Data Table on US - Market size and forecast 2025-2030 ($ billion)
Chart on US - Year-over-year growth 2025-2030 (%)
Data Table on US - Year-over-year growth 2025-2030 (%)

12.4.2 Canada - Market size and forecast 2025-2030

Chart on Canada - Market size and forecast 2025-2030 ($ billion)
Data Table on Canada - Market size and forecast 2025-2030 ($ billion)
Chart on Canada - Year-over-year growth 2025-2030 (%)
Data Table on Canada - Year-over-year growth 2025-2030 (%)

12.4.3 Mexico - Market size and forecast 2025-2030

Chart on Mexico - Market size and forecast 2025-2030 ($ billion)
Data Table on Mexico - Market size and forecast 2025-2030 ($ billion)
Chart on Mexico - Year-over-year growth 2025-2030 (%)
Data Table on Mexico - Year-over-year growth 2025-2030 (%)

12.5 Europe - Market size and forecast 2025-2030

Chart on Europe - Market size and forecast 2025-2030 ($ billion)
Data Table on Europe - Market size and forecast 2025-2030 ($ billion)
Chart on Europe - Year-over-year growth 2025-2030 (%)
Data Table on Europe - Year-over-year growth 2025-2030 (%)
Chart on Regional Comparison - Europe
Data Table on Regional Comparison - Europe

12.5.1 Germany - Market size and forecast 2025-2030

Chart on Germany - Market size and forecast 2025-2030 ($ billion)
Data Table on Germany - Market size and forecast 2025-2030 ($ billion)
Chart on Germany - Year-over-year growth 2025-2030 (%)
Data Table on Germany - Year-over-year growth 2025-2030 (%)

12.5.2 UK - Market size and forecast 2025-2030

Chart on UK - Market size and forecast 2025-2030 ($ billion)
Data Table on UK - Market size and forecast 2025-2030 ($ billion)
Chart on UK - Year-over-year growth 2025-2030 (%)
Data Table on UK - Year-over-year growth 2025-2030 (%)

12.5.3 France - Market size and forecast 2025-2030

Chart on France - Market size and forecast 2025-2030 ($ billion)
Data Table on France - Market size and forecast 2025-2030 ($ billion)
Chart on France - Year-over-year growth 2025-2030 (%)
Data Table on France - Year-over-year growth 2025-2030 (%)

12.5.4 Italy - Market size and forecast 2025-2030

Chart on Italy - Market size and forecast 2025-2030 ($ billion)
Data Table on Italy - Market size and forecast 2025-2030 ($ billion)
Chart on Italy - Year-over-year growth 2025-2030 (%)
Data Table on Italy - Year-over-year growth 2025-2030 (%)

12.5.5 Spain - Market size and forecast 2025-2030

Chart on Spain - Market size and forecast 2025-2030 ($ billion)
Data Table on Spain - Market size and forecast 2025-2030 ($ billion)
Chart on Spain - Year-over-year growth 2025-2030 (%)
Data Table on Spain - Year-over-year growth 2025-2030 (%)

12.5.6 The Netherlands - Market size and forecast 2025-2030

Chart on The Netherlands - Market size and forecast 2025-2030 ($ billion)
Data Table on The Netherlands - Market size and forecast 2025-2030 ($ billion)
Chart on The Netherlands - Year-over-year growth 2025-2030 (%)
Data Table on The Netherlands - Year-over-year growth 2025-2030 (%)

12.6 South America - Market size and forecast 2025-2030

Chart on South America - Market size and forecast 2025-2030 ($ billion)
Data Table on South America - Market size and forecast 2025-2030 ($ billion)
Chart on South America - Year-over-year growth 2025-2030 (%)
Data Table on South America - Year-over-year growth 2025-2030 (%)
Chart on Regional Comparison - South America
Data Table on Regional Comparison - South America

12.6.1 Brazil - Market size and forecast 2025-2030

Chart on Brazil - Market size and forecast 2025-2030 ($ billion)
Data Table on Brazil - Market size and forecast 2025-2030 ($ billion)
Chart on Brazil - Year-over-year growth 2025-2030 (%)
Data Table on Brazil - Year-over-year growth 2025-2030 (%)

12.6.2 Argentina - Market size and forecast 2025-2030

Chart on Argentina - Market size and forecast 2025-2030 ($ billion)
Data Table on Argentina - Market size and forecast 2025-2030 ($ billion)
Chart on Argentina - Year-over-year growth 2025-2030 (%)
Data Table on Argentina - Year-over-year growth 2025-2030 (%)

12.6.3 Chile - Market size and forecast 2025-2030

Chart on Chile - Market size and forecast 2025-2030 ($ billion)
Data Table on Chile - Market size and forecast 2025-2030 ($ billion)
Chart on Chile - Year-over-year growth 2025-2030 (%)
Data Table on Chile - Year-over-year growth 2025-2030 (%)

12.7 Middle East and Africa - Market size and forecast 2025-2030

Chart on Middle East and Africa - Market size and forecast 2025-2030 ($ billion)
Data Table on Middle East and Africa - Market size and forecast 2025-2030 ($ billion)
Chart on Middle East and Africa - Year-over-year growth 2025-2030 (%)
Data Table on Middle East and Africa - Year-over-year growth 2025-2030 (%)
Chart on Regional Comparison - Middle East and Africa
Data Table on Regional Comparison - Middle East and Africa

12.7.1 Saudi Arabia - Market size and forecast 2025-2030

Chart on Saudi Arabia - Market size and forecast 2025-2030 ($ billion)
Data Table on Saudi Arabia - Market size and forecast 2025-2030 ($ billion)
Chart on Saudi Arabia - Year-over-year growth 2025-2030 (%)
Data Table on Saudi Arabia - Year-over-year growth 2025-2030 (%)

12.7.2 UAE - Market size and forecast 2025-2030

Chart on UAE - Market size and forecast 2025-2030 ($ billion)
Data Table on UAE - Market size and forecast 2025-2030 ($ billion)
Chart on UAE - Year-over-year growth 2025-2030 (%)
Data Table on UAE - Year-over-year growth 2025-2030 (%)

12.7.3 South Africa - Market size and forecast 2025-2030

Chart on South Africa - Market size and forecast 2025-2030 ($ billion)
Data Table on South Africa - Market size and forecast 2025-2030 ($ billion)
Chart on South Africa - Year-over-year growth 2025-2030 (%)
Data Table on South Africa - Year-over-year growth 2025-2030 (%)

12.7.4 Egypt - Market size and forecast 2025-2030

Chart on Egypt - Market size and forecast 2025-2030 ($ billion)
Data Table on Egypt - Market size and forecast 2025-2030 ($ billion)
Chart on Egypt - Year-over-year growth 2025-2030 (%)
Data Table on Egypt - Year-over-year growth 2025-2030 (%)

12.7.5 Turkey - Market size and forecast 2025-2030

Chart on Turkey - Market size and forecast 2025-2030 ($ billion)
Data Table on Turkey - Market size and forecast 2025-2030 ($ billion)
Chart on Turkey - Year-over-year growth 2025-2030 (%)
Data Table on Turkey - Year-over-year growth 2025-2030 (%)

12.8 Market opportunity by geography

Market opportunity by geography ($ billion)
Data Tables on Market opportunity by geography ($ billion)

13. Drivers, Challenges, and Opportunity

13.1 Market drivers

Increasing demand for convenience and off-premises dining
Growing consumer interest in diverse and authentic culinary experiences
Technological integration and innovation

13.2 Market challenges

Intensifying competition and market saturation
Labor shortages and rising operational costs
Evolving consumer preferences and demand for personalization

13.3 Impact of drivers and challenges

Impact of drivers and challenges in 2025 and 2030

13.4 Market opportunities

Ascendancy of experiential dining
Integration of sustainability and ethical practices
Era of hyper-personalization

14. Competitive Landscape

14.1 Overview

14.2

Overview on criticality of inputs and factors of differentiation

14.3 Landscape disruption

Overview on factors of disruption

14.4 Industry risks

Impact of key risks on business

15. Competitive Analysis

15.1 Companies profiled

Companies covered

15.2 Company ranking index

15.3 Market positioning of companies

Matrix on companies position and classification

15.4 BJs Restaurants Inc.

BJs Restaurants Inc. - Overview
BJs Restaurants Inc. - Product / Service
BJs Restaurants Inc. - Key offerings
SWOT

15.5 Bloomin Brands Inc.

Bloomin Brands Inc. - Overview
Bloomin Brands Inc. - Business segments
Bloomin Brands Inc. - Key offerings
Bloomin Brands Inc. - Segment focus
SWOT

15.6 Brinker International Inc.

Brinker International Inc. - Overview
Brinker International Inc. - Product / Service
Brinker International Inc. - Key offerings
SWOT

15.7 Cracker Barrel

Cracker Barrel - Overview
Cracker Barrel - Business segments
Cracker Barrel - Key offerings
Cracker Barrel - Segment focus
SWOT

15.8 Darden Restaurants Inc

Darden Restaurants Inc - Overview
Darden Restaurants Inc - Business segments
Darden Restaurants Inc - Key offerings
Darden Restaurants Inc - Segment focus
SWOT

15.9 Inspire Brands Inc.

Inspire Brands Inc. - Overview
Inspire Brands Inc. - Product / Service
Inspire Brands Inc. - Key offerings
SWOT

15.10 Jollibee Foods Corp.

Jollibee Foods Corp. - Overview
Jollibee Foods Corp. - Business segments
Jollibee Foods Corp. - Key news
Jollibee Foods Corp. - Key offerings
Jollibee Foods Corp. - Segment focus
SWOT

15.11 McDonald Corp.

McDonald Corp. - Overview
McDonald Corp. - Business segments
McDonald Corp. - Key offerings
McDonald Corp. - Segment focus
SWOT

15.12 MTY Food Group Inc.

MTY Food Group Inc. - Overview
MTY Food Group Inc. - Business segments
MTY Food Group Inc. - Key offerings
MTY Food Group Inc. - Segment focus
SWOT

15.13 Restaurant Brands Inc.

Restaurant Brands Inc. - Overview
Restaurant Brands Inc. - Business segments
Restaurant Brands Inc. - Key offerings
Restaurant Brands Inc. - Segment focus
SWOT

15.14 Starbucks Corp.

Starbucks Corp. - Overview
Starbucks Corp. - Business segments
Starbucks Corp. - Key offerings
Starbucks Corp. - Segment focus
SWOT

15.15 Texas Roadhouse Inc.

Texas Roadhouse Inc. - Overview
Texas Roadhouse Inc. - Business segments
Texas Roadhouse Inc. - Key news
Texas Roadhouse Inc. - Key offerings
Texas Roadhouse Inc. - Segment focus
SWOT

15.16 The Cheesecake Factory Inc.

The Cheesecake Factory Inc. - Overview
The Cheesecake Factory Inc. - Business segments
The Cheesecake Factory Inc. - Key offerings
The Cheesecake Factory Inc. - Segment focus
SWOT

15.17 The Wendys Co.

The Wendys Co. - Overview
The Wendys Co. - Business segments
The Wendys Co. - Key news
The Wendys Co. - Key offerings
The Wendys Co. - Segment focus
SWOT

15.18 YUM Brands Inc.

YUM Brands Inc. - Overview
YUM Brands Inc. - Business segments
YUM Brands Inc. - Key offerings
YUM Brands Inc. - Segment focus
SWOT

16. Appendix

16.1 Scope of the report

Market definition
Objectives
Notes and caveats

16.2 Inclusions and exclusions checklist

Inclusions checklist
Exclusions checklist

16.3 Currency conversion rates for US$

16.4 Research methodology

16.5 Data procurement

Information sources

16.6 Data validation

16.7 Validation techniques employed for market sizing

16.8 Data synthesis

16.9 360 degree market analysis

16.10 List of abbreviations

Research Methodology

Technavio presents a detailed picture of the market by way of study, synthesis, and summation of data from multiple sources. The analysts have presented the various facets of the market with a particular focus on identifying the key industry influencers. The data thus presented is comprehensive, reliable, and the result of extensive research, both primary and secondary.

INFORMATION SOURCES

Primary sources

  • Manufacturers and suppliers
  • Channel partners
  • Industry experts
  • Strategic decision makers

Secondary sources

  • Industry journals and periodicals
  • Government data
  • Financial reports of key industry players
  • Historical data
  • Press releases

DATA ANALYSIS

Data Synthesis

  • Collation of data
  • Estimation of key figures
  • Analysis of derived insights

Data Validation

  • Triangulation with data models
  • Reference against proprietary databases
  • Corroboration with industry experts

REPORT WRITING

Qualitative

  • Market drivers
  • Market challenges
  • Market trends
  • Five forces analysis

Quantitative

  • Market size and forecast
  • Market segmentation
  • Geographical insights
  • Competitive landscape

Interested in this report?

Get your sample now to see our research methodology and insights!

Download Now

Frequently Asked Questions

Dining Out market growth will increase by USD 1224.5 billion during 2026-2030.

The Dining Out market is expected to grow at a CAGR of 9.5% during 2026-2030.

Dining Out market is segmented by Type (Restaurants, Drinking establishments) Product (North American, Italian, Mexican, Others) Service type (Dine-in, Home delivery, Takeaway, Drive-through, Click-and-collect)

BJs Restaurants Inc., Bloomin Brands Inc., Brinker International Inc., Cracker Barrel, Darden Restaurants Inc, Dominos Pizza Inc., Inspire Brands Inc., Jollibee Foods Corp., McDonald Corp., MTY Food Group Inc., Nandos Group, Papa Johns International Inc., Restaurant Brands Inc., Shake Shack Inc., Starbucks Corp., Texas Roadhouse Inc., The Cheesecake Factory Inc., The Subway Group, The Wendys Co., YUM Brands Inc. are a few of the key vendors in the Dining Out market.

APAC will register the highest growth rate of 40.3% among the other regions. Therefore, the Dining Out market in APAC is expected to garner significant business opportunities for the vendors during the forecast period.

China, Japan, India, Australia, South Korea, Indonesia, US, Canada, Mexico, Germany, UK, France, Italy, Spain, The Netherlands, Brazil, Argentina, Chile, Saudi Arabia, UAE, South Africa, Egypt, Turkey

  • Increasing demand for convenience and off-premises dining is the driving factor this market.

The Dining Out market vendors should focus on grabbing business opportunities from the Type segment as it accounted for the largest market share in the base year.
RIA - Research AI Assistant
Ask RIA
