Display Port Market Analysis APAC, North America, Europe, South America, Middle East and Africa - US, China, Germany, UK, Japan - Size and Forecast 2024-2028

Display Port Market Analysis APAC, North America, Europe, South America, Middle East and Africa - US, China, Germany, UK, Japan - Size and Forecast 2024-2028

Published: Jul 2024 140 Pages SKU: IRTNTR73922

Market Overview at a Glance

$556.2 Mn
Market Opportunity
4.44%
CAGR
4.1
YoY growth 2023-2024(%)

Display Port Market Size 2024-2028 

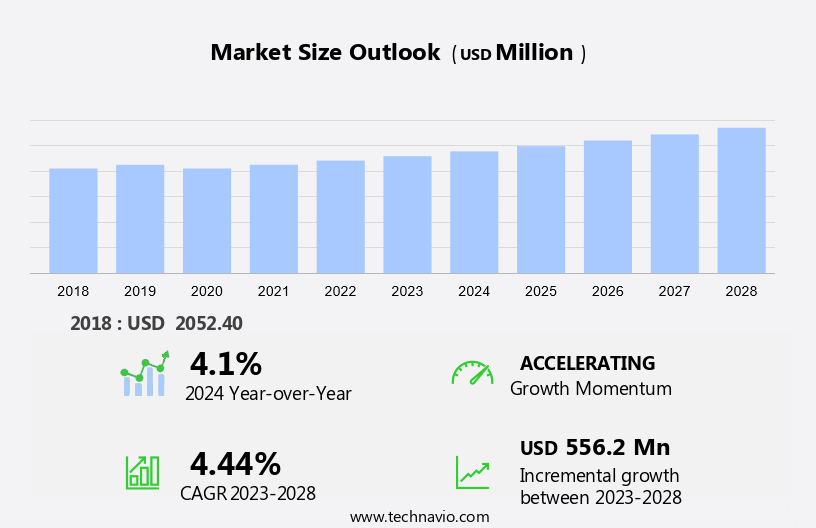
The display port market size is forecast to increase by USD 556.2 million and is estimated to grow at a CAGR of 4.44% between 2023 and 2028. The proliferation of smart devices, such as virtual reality (VR) headsets, augmented reality (AR) glasses, and personal theatres, has led to an increased demand for high-performance display ports. These ports offer several advantages, including the ability to connect to PCs and gaming consoles for seamless integration of visual and audio content. Moreover, the popularity of VR, AR, and personal theatre technologies relies heavily on the quality of the display, making display ports an essential component. With their ability to support high resolutions, refresh rates, and color depth, display ports enable users to enjoy immersive and visually stunning experiences across various applications.

What will be the Size of the Market During the Forecast Period?

Display Port Market Size

For More Highlights About this Report, Request Free Sample

Market Dynamic and Customer Landscape

The DisplayPort market is witnessing significant growth due to the increasing demand for high-definition visual experiences. Replacing older technologies like HDMI, DVI, and VGA, DisplayPort has become a preferred choice for connecting devices to displays, particularly in Virtual Reality (VR) and Augmented Reality (AR) applications. Chip manufacturers are continuously innovating to support advanced features like 4K resolution, HDR, and compatibility with various devices. DisplayPort 2.0, the latest version, offers double the bandwidth of its predecessor, enabling support for 8K resolution and beyond. The market is also expanding into new sectors like automotive applications, where Wireless DisplayPort and Internal DisplayPort are gaining traction. VESA's Compatibility Program ensures seamless integration of DisplayPort into various devices, including Televisions, Home theatres, PC Monitors, Laptops, and Commercial and Residential applications. Despite the advantages, compatibility issues with older devices remain a challenge for the market. Overall, the DisplayPort market is poised for continued growth, driven by the demand for high-quality visual experiences and the evolution of new technologies. Our researchers analyzed the data with 2023 as the base year, along with the key drivers, trends, and challenges. A holistic analysis of drivers will help companies refine their marketing strategies to gain a competitive advantage.

Key Market Driver

Increasing penetration of smart devices is notably driving market growth. The expanding usage of intelligent devices, including smartphones, tablets, laptops, and smart TVs, is projected to boost the demand for compatible display ports in various applications such as Televisions, Home theatres, PC Monitors, and Laptops, during the forecast period.

Moreover, developing regions, particularly Asia Pacific, Middle East, and South America, are witnessing substantial growth in the adoption of these devices. Factors such as economic growth, increasing literacy rates, and rising purchasing power are fueling the demand for smartphones and other devices in these regions. Thus, such factors are driving the growth of the market during the forecast period.

Significant Market Trends

Surge in automotive applications is the key trend in the market. The DisplayPort market is witnessing significant growth due to its ability to transport high-bandwidth display streams between various sub-systems, making it an ideal choice for various applications, including Televisions, Home theatres, PC Monitors, and Laptops.

Moreover, in the commercial and residential sectors, DisplayPort's compatibility with High Dynamic Range (HDR) technology and its support for 4K and 8K resolutions are major driving factors. The automotive industry is also adopting DisplayPort technology due to its benefits such as increased data speeds, reduced power consumption, and decreased wire counts. Thus, such trends will shape the growth of the market during the forecast period.

Major Market Challenge

Presence of counterfeit products is the major challenge that affects the growth of the market. The Display Port market is witnessing significant growth due to its increasing adoption in various applications such as Televisions, Home theatres, PC Monitors, and Laptops. In the commercial and residential sectors, the demand for Display Port technology is escalating, leading to its expansion beyond traditional computer applications.

However, the market faces compatibility issues, particularly with High Dynamic Range (HDR) technology, which can limit its widespread adoption. Counterfeit Display Port products, including Mini DisplayPort, have emerged as a challenge in the market. These counterfeit goods, commonly found in developing regions like India and Indonesia, are manufactured using substandard materials and have reduced durability. Hence, the above factors will impede the growth of the market during the forecast period.

Exclusive Customer Landscape

The market forecasting report includes the adoption lifecycle of the market, covering from the innovator’s stage to the laggard’s stage. It focuses on adoption rates in different regions based on penetration. Furthermore, the report also includes key purchase criteria and drivers of price sensitivity to help companies evaluate and develop their market growth analysis strategies.
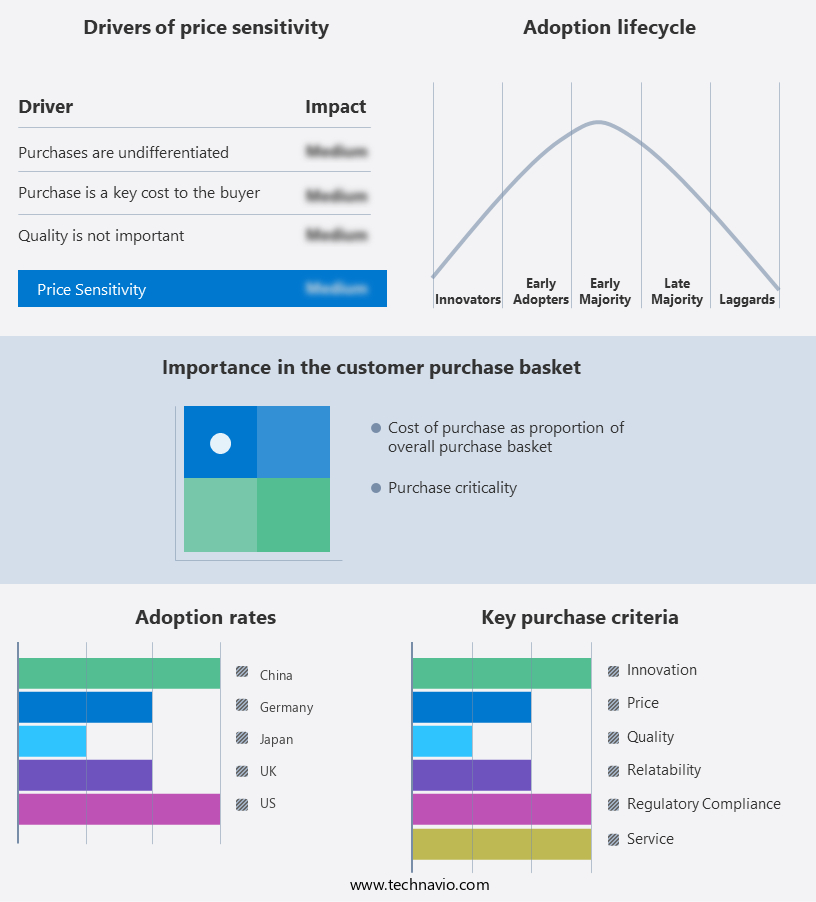
Display Port Market Share by Geography

 Customer Landscape

Key Companies & Market Insights

Companies are implementing various strategies, such as strategic alliances, partnerships, mergers and acquisitions, geographical expansion, and product/service launches, to enhance their presence in the market.

Advanced Micro Devices Inc: The company offers display port that support the higher bandwidth capabilities of the backward-compatible spec.

The market research and growth report also includes detailed analyses of the competitive landscape of the market and information about key companies, including:

  • Analogix Semiconductor Inc.
  • BlackCat India Pvt. Ltd.
  • BlueRigger Retail Pvt. Ltd.
  • Dell Technologies Inc.
  • Hewlett Packard Enterprise Co.
  • Infinite Cables Inc.
  • Intel Corp.
  • Japan Aviation Electronics Industry Ltd.
  • Lattice Semiconductor Corp.
  • Lenovo Group Ltd.
  • Molex LLC
  • NXP Semiconductors NV
  • PureLink GmbH
  • Shree Krishna Infotech
  • STMicroelectronics International N.V.
  • TE Connectivity Ltd.
  • Texas Instruments Inc.
  • Tragant Handels und Beteiligungs GmbH

Qualitative and quantitative analysis of companies has been conducted to help clients understand the wider business environment as well as the strengths and weaknesses of key market players. Data is qualitatively analyzed to categorize companies as pure play, category-focused, industry-focused, and diversified; it is quantitatively analyzed to categorize companies as dominant, leading, strong, tentative, and weak.

Market Segmentation

By Application 

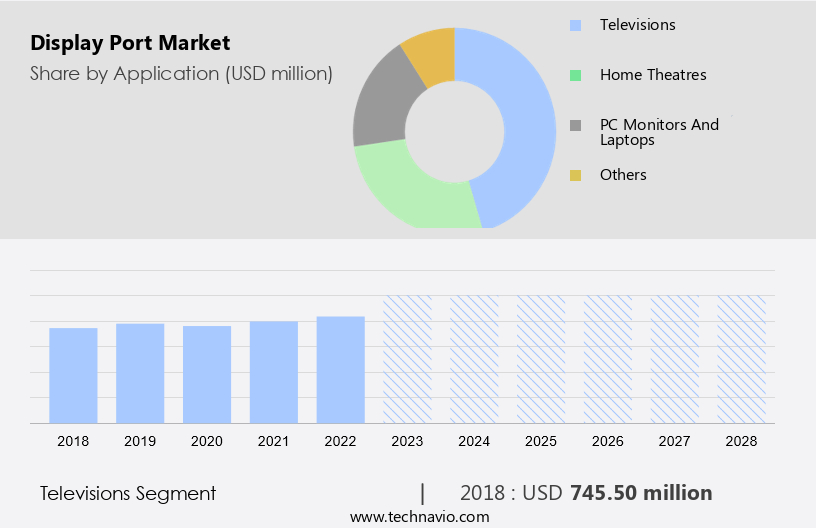
The televisions segment is estimated to witness significant growth during the forecast period. The market encompasses various advanced display technologies, including HDMI, DVI, VGA, and Mini display ports. These display interfaces cater to diverse applications, such as Virtual Reality (VR) and Augmented Reality (AR) in TVs, computers, monitors, consumer electronics, healthcare, gaming, and automotive industries.

Display Port Market Size

Get a glance at the market share of various regions Download the PDF Sample


The televisions segment was the largest segment and valued at USD 745.50 million in 2018. Chip manufacturers continually innovate to enhance DisplayPort's capabilities, leading to improvements in data rates, video compression, power efficiency, and greater flexibility for high-speed data transfer. DisplayPort 2.0, introduced by Video Electronics Standards Association (VESA), offers backward compatibility, video bandwidth performance, and advanced features like DP tunneling protocol. Hence, such factors are fuelling the growth of this segment during the forecast period.

Regional Analysis

Display Port Market Share by Geography

For more insights on the market share of various regions Download PDF Sample now!

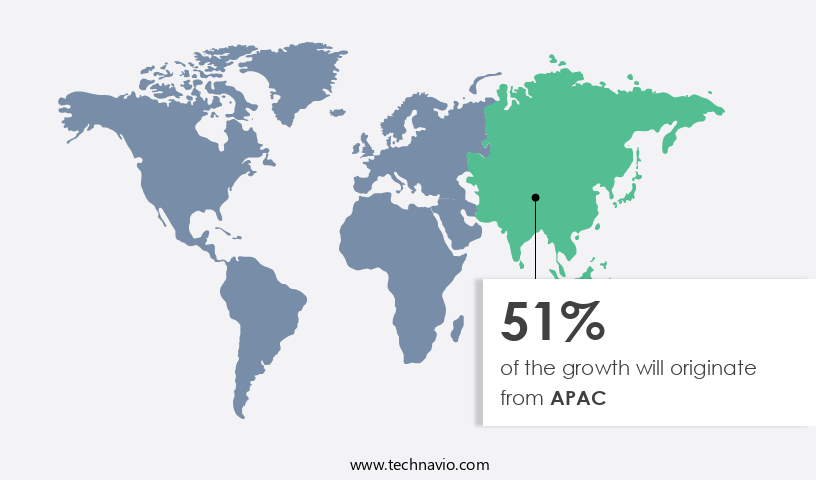
APAC is estimated to contribute 51% to the growth of the global market during the forecast period. Technavio’s analysts have elaborately explained the regional trends and drivers that shape the market during the forecast period. The DisplayPort market is a significant segment of the digital display ecosystem, offering high-speed data transfer, greater flexibility, and backward compatibility with various display technologies such as HDMI, DVI, and VGA. Chip manufacturers, including Intel, Texas Instruments, and Samsung, are driving the market's growth by integrating DisplayPort technology into consumer electronics, computers, monitors, and digital signage. Advanced display technologies like Virtual Reality (VR) and Augmented Reality (AR) are also adopting DisplayPort for their high-bandwidth requirements. Hence, such factors are driving the market in APAC during the forecast period.

Segment Overview

The market research report provides comprehensive data (region wise segment analysis), with forecasts and estimates in "USD Billion" for the period 2024 to 2028, as well as historical data from 2018 to 2022 for the following segments

  • Application Outlook
    • Televisions
    • Home theatres
    • PC monitors and laptops
    • Others
  • Region Outlook
    • North America
      • The U.S.
      • Canada
    • Europe
      • U.K.
      • Germany
      • France
      • Rest of Europe
    • APAC
      • China
      • India
    • Middle East & Africa
      • Saudi Arabia
      • South Africa
      • Rest of the Middle East & Africa

You may also interested in below market reports:

Ports and Terminal Operations Market Analysis APAC, Europe, North America, Middle East and Africa, South America - China, Japan, Singapore, Greece, Germany - Size and Forecast

HDMI Cable Market Analysis APAC, North America, Europe, South America, Middle East and Africa - China, US, Japan, Germany, UK - Size and Forecast

Computer Monitor Market Analysis APAC,North America,Europe,Middle East and Africa,South America - US,China,Japan,UK,Germany - Size and Forecast

Market Analyst Overview

DisplayPort is a digital display interface developed by the Video Electronics Standards Association (VESA) for transmitting video and audio signals between devices. It has gained significant popularity in the market due to its high-speed data transfer capabilities, greater flexibility, and backward compatibility with older display technologies like HDMI, DVI, and VGA. DisplayPort supports 4K resolution and higher, making it an ideal choice for TVs, computers, monitors, and consumer electronics. Chip manufacturers have integrated DisplayPort into various devices, including VR and AR headsets, automotive applications, and digital signage. The market is driven by the growing demand for advanced display technologies in various industries, such as healthcare, gaming, and multimedia content creation. The market is expected to grow significantly due to the increasing adoption of DisplayPort 2, which offers higher data rates, power efficiency, and video compression capabilities.

Moreover, the DisplayPort ecosystem includes various display technologies like Embedded DisplayPort, Wireless DisplayPort, Internal DisplayPort, Micro DisplayPort, and MyDP/SlimPort. The technology's ability to support high-speed data transfer and advanced display technologies makes it a crucial component of the digital display industry's global supply chains. DisplayPort's DP tunneling protocol ensures secure and reliable data transfer, making it an ideal choice for multimedia and digital content applications. The technology's power efficiency and high-speed capabilities make it an attractive option for consumer electronics, computers, and monitors. The market landscape depends on the TV, Video Electronics Standard Association, Multi-monitor setups, Display technology, Growth in gaming and multimedia. In summary, DisplayPort is a versatile display interface that offers high-speed data transfer, power efficiency, and backward compatibility, making it a crucial component of the digital display ecosystem. Its applications span across various industries, including consumer electronics, healthcare, gaming, and multimedia content creation. The market for DisplayPort is expected to grow significantly due to the increasing demand for advanced display technologies and the adoption of DisplayPort 2.

Market Scope

Report Coverage

Details

Page number

140

Base year

2023

Historic period

2018-2022

Forecast period

2024-2028

Growth momentum & CAGR

Accelerate at a CAGR of 4.44%

Market growth 2024-2028

USD 556.2 million

Market structure

Fragmented

YoY growth 2023-2024(%)

4.1

Regional analysis

APAC, North America, Europe, South America, and Middle East and Africa

Performing market contribution

APAC at 51%

Key countries

US, China, Germany, UK, and Japan

Competitive landscape

Leading Companies, Market Positioning of Companies, Competitive Strategies, and Industry Risks

Key companies profiled

Advanced Micro Devices Inc., Analogix Semiconductor Inc., BlackCat India Pvt. Ltd., BlueRigger Retail Pvt. Ltd., Dell Technologies Inc., Hewlett Packard Enterprise Co., Infinite Cables Inc., Intel Corp., Japan Aviation Electronics Industry Ltd., Lattice Semiconductor Corp., Lenovo Group Ltd., Molex LLC, NXP Semiconductors NV, PureLink GmbH, Shree Krishna Infotech, STMicroelectronics International N.V., TE Connectivity Ltd., Texas Instruments Inc., and Tragant Handels und Beteiligungs GmbH

Market dynamics

Parent market analysis, market forecast, market report, Market growth inducers and obstacles, Fast-growing and slow-growing segment analysis, COVID-19 impact and recovery analysis and future consumer dynamics, Market condition analysis for forecast period

Customization purview

If our report has not included the data that you are looking for, you can reach out to our analysts and get segments customized.

Download PDF Sample

What are the Key Data Covered in this Market Research Report?

  • CAGR of the market during the forecast period
  • Detailed information on factors that will drive the market growth and forecasting between 2024 and 2028
  • Precise estimation of the size of the market  and its contribution of the market in focus to the parent market
  • Accurate predictions about upcoming market growth and trends and changes in consumer behaviour
  • Growth of the market across APAC, North America, Europe, South America, and Middle East and Africa
  • Thorough analysis of the market’s competitive landscape and detailed information about companies
  • Comprehensive analysis of factors that will challenge the growth of market companies

1 Executive Summary

  • 1.1 Market overview
    • Executive Summary - Chart on Market Overview
    • Executive Summary - Data Table on Market Overview
    • Executive Summary - Chart on Global Market Characteristics
    • Executive Summary - Chart on Market by Geography
    • Executive Summary - Chart on Market Segmentation by Application
    • Executive Summary - Chart on Incremental Growth
    • Executive Summary - Data Table on Incremental Growth
    • Executive Summary - Chart on Company Market Positioning

2 Market Landscape

  • 2.1 Market ecosystem
    • Parent Market
    • Data Table on - Parent Market
  • 2.2 Market characteristics
    • Market characteristics analysis
  • 2.3 Value chain analysis
    • Value Chain Analysis

3 Market Sizing

  • 3.1 Market definition
    • Offerings of companies included in the market definition
  • 3.2 Market segment analysis
    • Market segments
  • 3.3 Market size 2023
    • 3.4 Market outlook: Forecast for 2023-2028
      • Chart on Global - Market size and forecast 2023-2028 ($ million)
      • Data Table on Global - Market size and forecast 2023-2028 ($ million)
      • Chart on Global Market: Year-over-year growth 2023-2028 (%)
      • Data Table on Global Market: Year-over-year growth 2023-2028 (%)

    4 Historic Market Size

    • 4.1 Global Display Port Market 2018 - 2022
      • Historic Market Size - Data Table on Global Display Port Market 2018 - 2022 ($ million)
    • 4.2 Application segment analysis 2018 - 2022
      • Historic Market Size - Application Segment 2018 - 2022 ($ million)
    • 4.3 Geography segment analysis 2018 - 2022
      • Historic Market Size - Geography Segment 2018 - 2022 ($ million)
    • 4.4 Country segment analysis 2018 - 2022
      • Historic Market Size - Country Segment 2018 - 2022 ($ million)

    5 Five Forces Analysis

    • 5.1 Five forces summary
      • Five forces analysis - Comparison between 2023 and 2028
    • 5.2 Bargaining power of buyers
      • Bargaining power of buyers - Impact of key factors 2023 and 2028
    • 5.3 Bargaining power of suppliers
      • Bargaining power of suppliers - Impact of key factors in 2023 and 2028
    • 5.4 Threat of new entrants
      • Threat of new entrants - Impact of key factors in 2023 and 2028
    • 5.5 Threat of substitutes
      • Threat of substitutes - Impact of key factors in 2023 and 2028
    • 5.6 Threat of rivalry
      • Threat of rivalry - Impact of key factors in 2023 and 2028
    • 5.7 Market condition
      • Chart on Market condition - Five forces 2023 and 2028

    6 Market Segmentation by Application

    • 6.1 Market segments
      • Chart on Application - Market share 2023-2028 (%)
      • Data Table on Application - Market share 2023-2028 (%)
    • 6.2 Comparison by Application
      • Chart on Comparison by Application
      • Data Table on Comparison by Application
    • 6.3 Televisions - Market size and forecast 2023-2028
      • Chart on Televisions - Market size and forecast 2023-2028 ($ million)
      • Data Table on Televisions - Market size and forecast 2023-2028 ($ million)
      • Chart on Televisions - Year-over-year growth 2023-2028 (%)
      • Data Table on Televisions - Year-over-year growth 2023-2028 (%)
    • 6.4 Home theatres - Market size and forecast 2023-2028
      • Chart on Home theatres - Market size and forecast 2023-2028 ($ million)
      • Data Table on Home theatres - Market size and forecast 2023-2028 ($ million)
      • Chart on Home theatres - Year-over-year growth 2023-2028 (%)
      • Data Table on Home theatres - Year-over-year growth 2023-2028 (%)
    • 6.5 PC monitors and laptops - Market size and forecast 2023-2028
      • Chart on PC monitors and laptops - Market size and forecast 2023-2028 ($ million)
      • Data Table on PC monitors and laptops - Market size and forecast 2023-2028 ($ million)
      • Chart on PC monitors and laptops - Year-over-year growth 2023-2028 (%)
      • Data Table on PC monitors and laptops - Year-over-year growth 2023-2028 (%)
    • 6.6 Others - Market size and forecast 2023-2028
      • Chart on Others - Market size and forecast 2023-2028 ($ million)
      • Data Table on Others - Market size and forecast 2023-2028 ($ million)
      • Chart on Others - Year-over-year growth 2023-2028 (%)
      • Data Table on Others - Year-over-year growth 2023-2028 (%)
    • 6.7 Market opportunity by Application
      • Market opportunity by Application ($ million)
      • Data Table on Market opportunity by Application ($ million)

    7 Customer Landscape

    • 7.1 Customer landscape overview
      • Analysis of price sensitivity, lifecycle, customer purchase basket, adoption rates, and purchase criteria

    8 Geographic Landscape

    • 8.1 Geographic segmentation
      • Chart on Market share by geography 2023-2028 (%)
      • Data Table on Market share by geography 2023-2028 (%)
    • 8.2 Geographic comparison
      • Chart on Geographic comparison
      • Data Table on Geographic comparison
    • 8.3 APAC - Market size and forecast 2023-2028
      • Chart on APAC - Market size and forecast 2023-2028 ($ million)
      • Data Table on APAC - Market size and forecast 2023-2028 ($ million)
      • Chart on APAC - Year-over-year growth 2023-2028 (%)
      • Data Table on APAC - Year-over-year growth 2023-2028 (%)
    • 8.4 North America - Market size and forecast 2023-2028
      • Chart on North America - Market size and forecast 2023-2028 ($ million)
      • Data Table on North America - Market size and forecast 2023-2028 ($ million)
      • Chart on North America - Year-over-year growth 2023-2028 (%)
      • Data Table on North America - Year-over-year growth 2023-2028 (%)
    • 8.5 Europe - Market size and forecast 2023-2028
      • Chart on Europe - Market size and forecast 2023-2028 ($ million)
      • Data Table on Europe - Market size and forecast 2023-2028 ($ million)
      • Chart on Europe - Year-over-year growth 2023-2028 (%)
      • Data Table on Europe - Year-over-year growth 2023-2028 (%)
    • 8.6 South America - Market size and forecast 2023-2028
      • Chart on South America - Market size and forecast 2023-2028 ($ million)
      • Data Table on South America - Market size and forecast 2023-2028 ($ million)
      • Chart on South America - Year-over-year growth 2023-2028 (%)
      • Data Table on South America - Year-over-year growth 2023-2028 (%)
    • 8.7 Middle East and Africa - Market size and forecast 2023-2028
      • Chart on Middle East and Africa - Market size and forecast 2023-2028 ($ million)
      • Data Table on Middle East and Africa - Market size and forecast 2023-2028 ($ million)
      • Chart on Middle East and Africa - Year-over-year growth 2023-2028 (%)
      • Data Table on Middle East and Africa - Year-over-year growth 2023-2028 (%)
    • 8.8 US - Market size and forecast 2023-2028
      • Chart on US - Market size and forecast 2023-2028 ($ million)
      • Data Table on US - Market size and forecast 2023-2028 ($ million)
      • Chart on US - Year-over-year growth 2023-2028 (%)
      • Data Table on US - Year-over-year growth 2023-2028 (%)
    • 8.9 China - Market size and forecast 2023-2028
      • Chart on China - Market size and forecast 2023-2028 ($ million)
      • Data Table on China - Market size and forecast 2023-2028 ($ million)
      • Chart on China - Year-over-year growth 2023-2028 (%)
      • Data Table on China - Year-over-year growth 2023-2028 (%)
    • 8.10 Germany - Market size and forecast 2023-2028
      • Chart on Germany - Market size and forecast 2023-2028 ($ million)
      • Data Table on Germany - Market size and forecast 2023-2028 ($ million)
      • Chart on Germany - Year-over-year growth 2023-2028 (%)
      • Data Table on Germany - Year-over-year growth 2023-2028 (%)
    • 8.11 UK - Market size and forecast 2023-2028
      • Chart on UK - Market size and forecast 2023-2028 ($ million)
      • Data Table on UK - Market size and forecast 2023-2028 ($ million)
      • Chart on UK - Year-over-year growth 2023-2028 (%)
      • Data Table on UK - Year-over-year growth 2023-2028 (%)
    • 8.12 Japan - Market size and forecast 2023-2028
      • Chart on Japan - Market size and forecast 2023-2028 ($ million)
      • Data Table on Japan - Market size and forecast 2023-2028 ($ million)
      • Chart on Japan - Year-over-year growth 2023-2028 (%)
      • Data Table on Japan - Year-over-year growth 2023-2028 (%)
    • 8.13 Market opportunity by geography
      • Market opportunity by geography ($ million)
      • Data Tables on Market opportunity by geography ($ million)

    9 Drivers, Challenges, and Opportunity/Restraints

    • 9.1 Market drivers
      • 9.2 Market challenges
        • 9.3 Impact of drivers and challenges
          • Impact of drivers and challenges in 2023 and 2028
        • 9.4 Market opportunities/restraints

          10 Competitive Landscape

          • 10.1 Overview
            • 10.2 Competitive Landscape
              • Overview on criticality of inputs and factors of differentiation
            • 10.3 Landscape disruption
              • Overview on factors of disruption
            • 10.4 Industry risks
              • Impact of key risks on business

            11 Competitive Analysis

            • 11.1 Companies profiled
              • Companies covered
            • 11.2 Market positioning of companies
              • Matrix on companies position and classification
            • 11.3 Advanced Micro Devices Inc.
              • Advanced Micro Devices Inc. - Overview
              • Advanced Micro Devices Inc. - Business segments
              • Advanced Micro Devices Inc. - Key news
              • Advanced Micro Devices Inc. - Key offerings
              • Advanced Micro Devices Inc. - Segment focus
            • 11.4 Analogix Semiconductor Inc.
              • Analogix Semiconductor Inc. - Overview
              • Analogix Semiconductor Inc. - Product / Service
              • Analogix Semiconductor Inc. - Key offerings
            • 11.5 Dell Technologies Inc.
              • Dell Technologies Inc. - Overview
              • Dell Technologies Inc. - Business segments
              • Dell Technologies Inc. - Key news
              • Dell Technologies Inc. - Key offerings
              • Dell Technologies Inc. - Segment focus
            • 11.6 Hewlett Packard Enterprise Co.
              • Hewlett Packard Enterprise Co. - Overview
              • Hewlett Packard Enterprise Co. - Business segments
              • Hewlett Packard Enterprise Co. - Key news
              • Hewlett Packard Enterprise Co. - Key offerings
              • Hewlett Packard Enterprise Co. - Segment focus
            • 11.7 Intel Corp.
              • Intel Corp. - Overview
              • Intel Corp. - Business segments
              • Intel Corp. - Key news
              • Intel Corp. - Key offerings
              • Intel Corp. - Segment focus
            • 11.8 Lattice Semiconductor Corp.
              • Lattice Semiconductor Corp. - Overview
              • Lattice Semiconductor Corp. - Product / Service
              • Lattice Semiconductor Corp. - Key offerings
            • 11.9 Lenovo Group Ltd.
              • Lenovo Group Ltd. - Overview
              • Lenovo Group Ltd. - Business segments
              • Lenovo Group Ltd. - Key news
              • Lenovo Group Ltd. - Key offerings
              • Lenovo Group Ltd. - Segment focus
            • 11.10 Molex LLC
              • Molex LLC - Overview
              • Molex LLC - Product / Service
              • Molex LLC - Key offerings
            • 11.11 NXP Semiconductors NV
              • NXP Semiconductors NV - Overview
              • NXP Semiconductors NV - Product / Service
              • NXP Semiconductors NV - Key news
              • NXP Semiconductors NV - Key offerings
            • 11.12 Texas Instruments Inc.
              • Texas Instruments Inc. - Overview
              • Texas Instruments Inc. - Business segments
              • Texas Instruments Inc. - Key news
              • Texas Instruments Inc. - Key offerings
              • Texas Instruments Inc. - Segment focus

            12 Appendix

            • 12.1 Scope of the report
              • 12.2 Inclusions and exclusions checklist
                • Inclusions checklist
                • Exclusions checklist
              • 12.3 Currency conversion rates for US$
                • Currency conversion rates for US$
              • 12.4 Research methodology
                • Research methodology
              • 12.5 Data procurement
                • Information sources
              • 12.6 Data validation
                • Data validation
              • 12.7 Validation techniques employed for market sizing
                • Validation techniques employed for market sizing
              • 12.8 Data synthesis
                • Data synthesis
              • 12.9 360 degree market analysis
                • 360 degree market analysis
              • 12.10 List of abbreviations
                • List of abbreviations

              Research Methodology

              Technavio presents a detailed picture of the market by way of study, synthesis, and summation of data from multiple sources. The analysts have presented the various facets of the market with a particular focus on identifying the key industry influencers. The data thus presented is comprehensive, reliable, and the result of extensive research, both primary and secondary.

              INFORMATION SOURCES

              Primary sources

              • Manufacturers and suppliers
              • Channel partners
              • Industry experts
              • Strategic decision makers

              Secondary sources

              • Industry journals and periodicals
              • Government data
              • Financial reports of key industry players
              • Historical data
              • Press releases

              DATA ANALYSIS

              Data Synthesis

              • Collation of data
              • Estimation of key figures
              • Analysis of derived insights

              Data Validation

              • Triangulation with data models
              • Reference against proprietary databases
              • Corroboration with industry experts

              REPORT WRITING

              Qualitative

              • Market drivers
              • Market challenges
              • Market trends
              • Five forces analysis

              Quantitative

              • Market size and forecast
              • Market segmentation
              • Geographical insights
              • Competitive landscape

              Interested in this report?

              Get your sample now to see our research methodology and insights!

              Download Now

              Frequently Asked Questions

              Display Port market growth will increase by $ 556.2 mn during 2024-2028.

              The Display Port market is expected to grow at a CAGR of 4.44% during 2024-2028.

              Display Port market is segmented by Application( Televisions, Home theatres, PC monitors and laptops, Others)

              Advanced Micro Devices Inc., Analogix Semiconductor Inc., BlackCat India Pvt. Ltd., BlueRigger Retail Pvt. Ltd., Dell Technologies Inc., Hewlett Packard Enterprise Co., Infinite Cables Inc., Intel Corp., Japan Aviation Electronics Industry Ltd., Lattice Semiconductor Corp., Lenovo Group Ltd., Molex LLC, NXP Semiconductors NV, PureLink GmbH, Shree Krishna Infotech, STMicroelectronics International N.V., TE Connectivity Ltd., Texas Instruments Inc., Tragant Handels und Beteiligungs GmbH are a few of the key vendors in the Display Port market.

              APAC will register the highest growth rate of 51% among the other regions. Therefore, the Display Port market in APAC is expected to garner significant business opportunities for the vendors during the forecast period.

              US, China, Germany, UK, Japan

              • Increasing penetration of smart devicesThe growing penetration of smart devices is the driving factor this market.
              • such as smartphones is the driving factor this market.
              • tablets is the driving factor this market.
              • laptops is the driving factor this market.
              • smart TVs is the driving factor this market.
              • streaming media players is the driving factor this market.
              • and other multimedia devices is the driving factor this market.
              • is expected to drive the demand for supporting accessories is the driving factor this market.
              • such as display ports is the driving factor this market.
              • during the forecast period. Developing regions such as APAC is the driving factor this market.
              • MEA is the driving factor this market.
              • and South America are observing significant growth in the penetration of smart devices. Economic growth is the driving factor this market.
              • increasing literacy rate is the driving factor this market.
              • and rising purchasing power are some factors that are boosting the demand for smartphones and other devices. China and India are the largest markets for smartphones in APAC and are experiencing rapid growth. Africa has shown a noteworthy increase in the demand for smartphones over the last few years. Advances in cellular technology is the driving factor this market.
              • such as third-generation (3G) and fourth-generation (4G) is the driving factor this market.
              • have also fueled the adoption of smart devices. The demand for smart devices is mainly increasing in urban and semi-urban areas. Smartphone vendors are also largely focused on these areas to increase their market share. Therefore is the driving factor this market.
              • the increase in the sales of smart devices is expected to propel the demand for display ports during the forecast period. is the driving factor this market.

              The Display Port market vendors should focus on grabbing business opportunities from the Televisions segment as it accounted for the largest market share in the base year.