Computer Monitor Market Analysis APAC,North America,Europe,Middle East and Africa,South America - US,China,Japan,UK,Germany - Size and Forecast 2024-2028

Computer Monitor Market Analysis APAC,North America,Europe,Middle East and Africa,South America - US,China,Japan,UK,Germany - Size and Forecast 2024-2028

Published: Dec 2023 167 Pages SKU: IRTNTR76954

Market Overview at a Glance

$22.83 B
Market Opportunity
8.64%
CAGR
7.78
YoY growth 2023-2024(%)

Computer Monitor Market Size 2024-2028

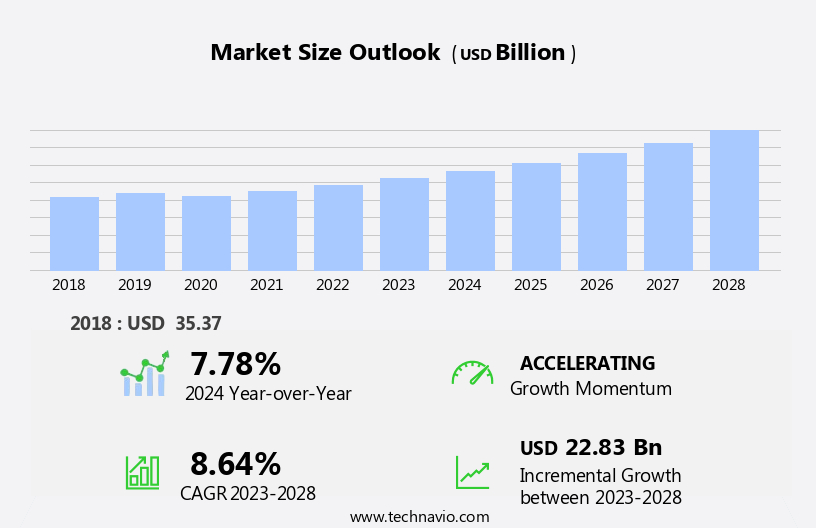
The computer monitor market size is forecast to increase by USD 22.83 billion at a CAGR of 8.64% between 2023 and 2028.

  • The market is experiencing significant growth, driven by several key trends. One of the most notable trends is the increasing demand for high-resolution displays, as users seek to enhance their visual experience when working with visual content or playing games. Another trend is the growing adoption of curved monitors, which offer a more immersive viewing experience and can help save desk space, or real estate, in a home or office setting. Additionally, wireless connectivity is becoming increasingly important, allowing users to easily connect their monitors to their computers, smartphones, printers, docks, and even televisions without the need for cables. Furthermore, environmental concerns and sustainability are catalysts for innovation In the market, with LED monitors becoming increasingly popular due to their energy efficiency.
  • Apple's shift towards larger monitors for its MacBook Pro lineup is also expected to fuel demand for larger, high-resolution monitors In the US and North American markets.
  • What will be the Size of the Computer Monitor Market During the Forecast Period?

    Computer Monitor Market Size

     Request Free Sample

  • The PC monitor market, a crucial segment of the output device industry, continues to evolve with advancements in visual display technology. Traditional Cathode-Ray Tube (CRT) monitors have largely been replaced by flat-panel displays, including TFT-LCD and LED screens. These modern monitors offer improved energy efficiency, sleeker designs with minimal casing, and various connectivity options such as LVDS, Thunderbolt G4 dock, and HDMI. LED backlighting and CCFL backlighting are two prominent lighting technologies, each offering distinct advantages. LED screens provide better energy efficiency and longer lifespan, while CCFL backlighting offers cost-effectiveness and broader availability. The market dynamics are influenced by various factors, including increasing demand for high-resolution displays, the proliferation of smartphones and other mobile devices, and the convergence of entertainment, communication, and home-office activities.
  • Brands like BenQ, Samsung Electronics, and others continue to innovate, introducing smart monitors, curved displays, and advanced features tailored to specific user needs. Additionally, the emergence of smart monitors and the integration of technologies like Thunderbolt G4 dock, smartphones, and other peripherals have expanded the monitor's role beyond a mere output device. This evolution is driven by the growing need for versatile and multifunctional devices in today's interconnected world. In summary, the PC monitor market is characterized by continuous innovation and diversification, driven by advancements in display technology, user needs, and market trends.
  • How is this Computer Monitor Industry segmented and which is the largest segment?

    The computer monitor industry research report provides comprehensive data (region-wise segment analysis), with forecasts and estimates in "USD billion" for the period 2024-2028, as well as historical data from 2018-2022 for the following segments.
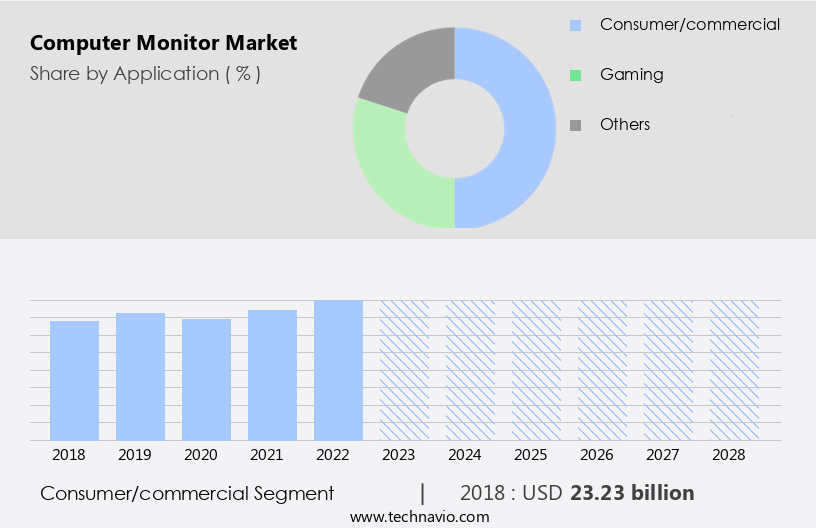
    • Application
      • Consumer/commercial
      • Gaming
      • Others
    • Type
      • LCD monitor
      • LED monitor
      • CRT
      • Others
    • Geography
      • APAC
        • China
        • Japan
      • North America
        • US
      • Europe
        • Germany
        • UK
      • Middle East and Africa
        • South America

        By Application Insights

        • The consumer/commercial segment is estimated to witness significant growth during the forecast period.

        The market caters to the demand for visual displays used in personal and business applications. This market segment includes monitors for gaming, multimedia, and office work. Factors driving market growth include the increasing digitization of industries, advancements in display technologies, and the rising preference for visual content. Consequently, there is a significant demand for computer monitors in both the consumer and commercial sectors. Notable manufacturers in this industry include Samsung Electronics and BenQ, producing LCD and LED monitors for various applications. The market's expansion is influenced by factors such as increasing consumer spending, household penetration, and the consumer price index.

        The S-curve function and trend smoothing indicate a steady growth trajectory, with potential integration of 5G technology further enhancing market potential. The market serves a wide range of electronic devices, including smartphones, printers, copiers, and telecommunication equipment.

        Computer Monitor Market Size

        Get a glance at the  Computer Monitor Industry report of share of various segments Request Free Sample

        The Consumer/commercial segment was valued at USD 23.23 billion in 2018 and showed a gradual increase during the forecast period.

        Regional Analysis

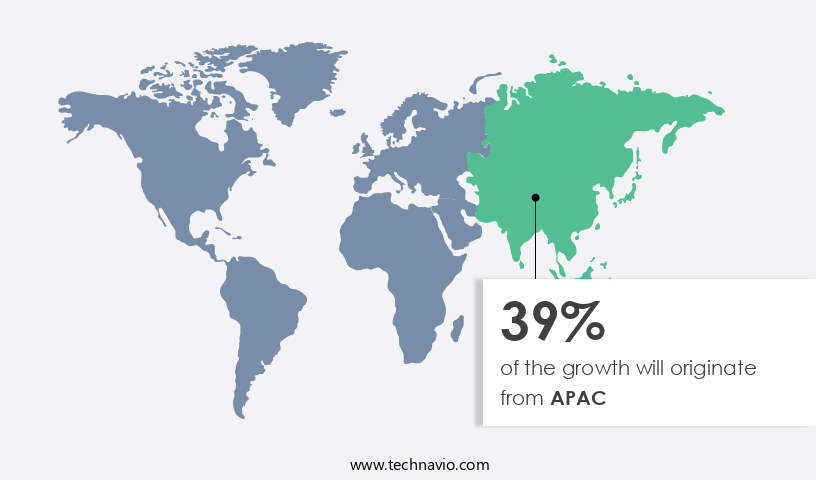
        • APAC is estimated to contribute 39% to the growth of the global market during the forecast period.

        Technavio’s analysts have elaborately explained the regional trends and drivers that shape the market during the forecast period.

        Computer Monitor Market Share by Geography

        For more insights on the market share of various regions, Request Free Sample

        The APAC market represents a substantial portion of the global computer monitor industry, driven by the region's large population and increasing technology adoption. Key countries, including China, Japan, India, South Korea, and Southeast Asian nations, exhibit growing demand for computer monitors. This market is influenced by both local and international monitor manufacturers, with notable brands like Samsung, LG, Acer, Asus, Dell, and AOC leading the way. These companies provide a diverse selection of monitors, catering to various consumer requirements through different specifications and price points. For instance, BenQ, a renowned global brand in digital lifestyle products and pioneer in professional display technology, launched the newest generation of PhotoVue professional photography monitors, the SW272U and SW272Q, in February 2023.

        Computer monitors in APAC are available in various types, such as TFT-LCD, LED backlit, CCFL backlit, Cathode-ray tube, Plasma display, OLED, and sizes ranging from small LCD monitors to large LED displays. Connectivity options include VGA, HDMI, DisplayPort, USB-C, LVDS, LCD, CRT, and more. These monitors are utilized in various applications, including commercial, gaming, virtual gaming, smartphones, B2C enterprises, electronic devices, digital devices, entertainment, televisions, game consoles, smart speakers, communication, telephones, home-office activities, printers, copiers, and more. The user penetration, consumer spending, and household numbers continue to increase, influencing the market's growth. The consumer price index, S-curve function, trend smoothing, and 5G penetration rate are essential factors impacting the market's development.

        Market Dynamics

        Our  researchers analyzed the data with 2023 as the base year, along with the key drivers, trends, and challenges. A holistic analysis of drivers will help companies refine their marketing strategies to gain a competitive advantage.

        What are the key market drivers leading to the rise In the adoption of Computer Monitor Industry?

        Rising demand for high-resolution displays is the key driver of the market.

      • The market In the US has witnessed notable expansion, fueled by the increasing preference for high-resolution displays. As technology progresses and becomes more affordable, there is a growing trend towards high-definition visuals and immersive experiences in computing devices. This shift is evident in various sectors such as gaming, design, entertainment, and productivity. The primary catalyst for this trend is the escalating consumption of visual content. With the emergence of high-definition videos, 4K streaming, and multimedia applications, users are increasingly seeking monitors that offer sharper images, vivid colors, and superior detail. Two primary technologies driving the high-resolution monitor market are TFT-LCD and LED backlighting.
      • TFT-LCD (Thin Film Transistor Liquid Crystal Display) monitors offer excellent image quality and response time, making them popular choices for professional use. On the other hand, LED backlighting provides energy efficiency and longer lifespan compared to traditional CCFL (Cold Cathode Fluorescent Lamp) backlighting. The market caters to diverse user needs, with offerings ranging from LCD monitors for home-office activities to LED monitors for commercial applications. The market also includes specialized monitors for gaming, virtual gaming, and smart monitors that offer advanced features such as Thunderbolt G4 dock connectivity and USB-C compatibility. The market size for computer monitors is estimated to grow significantly, driven by consumer spending and the increasing household number.
      • The consumer price index and S-curve function indicate a steady trend In the adoption of computer monitors, with 5G penetration rate expected to further fuel growth. The market research firms, including Vantage Market Research, Juniper Research, and Statista, provide valuable insights into the market dynamics and future trends. The market serves a wide range of electronic devices, including PCs, televisions, game consoles, smartphones, smart speakers, printers, copiers, and communication devices. As digital devices become increasingly integrated into our daily lives, the demand for high-quality visual displays is expected to continue growing.
      • What are the market trends shaping the Computer Monitor Industry?

        Growing adoption of curved monitors is the upcoming market trend.

      • The market In the US is witnessing significant growth due to the increasing demand for advanced visual display technologies. Output devices, such as PC monitors, play a crucial role in enhancing the user experience of electronic devices, including digital devices like smartphones and computers. The market is witnessing a shift towards advanced display technologies like TFT-LCD, LED backlighting, and OLED. These displays offer superior image quality, energy efficiency, and sleek designs. The casing and circuitry of computer monitors have also evolved, with a focus on reducing size and increasing functionality. Power supply systems have become more efficient, enabling larger and more powerful displays.
      • Connectivity options, such as VGA, HDMI, DisplayPort, USB-C, LVDS, and LCD, have expanded to cater to various user needs. Size is a significant factor In the market, with LCD monitors and LED monitors dominating the landscape. Commercial applications, such as gaming and virtual gaming, are driving the demand for larger displays. LED displays offer enhanced brightness, contrast, and energy efficiency, making them a popular choice for both commercial and consumer applications. Estimations suggest that consumer spending on computer monitors will continue to grow, driven by increasing household numbers and the consumer price index. The S-curve function and trend smoothing indicate a steady growth trajectory for the market, with a potential impact from the 5G penetration rate.
      • The market dynamics are influenced by various factors, including user penetration, size, and connectivity options. The market is a dynamic and competitive landscape, with various players offering innovative solutions to cater to diverse user needs. From BenQ's Smart Monitors to Samsung Electronics' advanced displays, the market is brimming with options for consumers and businesses alike. The market is expected to continue evolving, driven by advancements in technology and changing user preferences.
      • What challenges does the Computer Monitor Industry face during its growth?

        Environmental concerns and sustainability is a key challenge affecting the industry growth.

      • The market is witnessing significant attention due to the evolving needs of consumers and businesses for advanced visual display solutions. As output devices, monitors play a crucial role in enhancing the user experience of digital devices such as PCs, smartphones, and game consoles. The market encompasses various display technologies including TFT-LCD, LED backlighting, CCFL backlighting, Cathode-ray tube (CRT), Plasma display, OLED, and Size variants like LCD monitors and LED monitors. Manufacturers continue to innovate with technologies such as VGA, HDMI, DisplayPort, USB-C, LVDS, LCD, and CRT connectivity options. With the increasing demand for smart devices and home-office activities, the market is witnessing a surge In the adoption of LED displays.
      • Estimations suggest that the market will continue to grow, driven by consumer spending and the household number of digital devices. Environmental concerns have emerged as a critical challenge In the market. With the rapid turnover rate of monitors and the subsequent disposal of electronic waste, there is a growing need for sustainable practices. The UN estimates that 53.5 million metric tonnes of e-waste were generated in 2019. To mitigate this, manufacturers are implementing recycling programs and responsible disposal methods. Market dynamics include user penetration, consumer spending, and the introduction of new technologies like 5G penetration rate and trend smoothing.
      • Major players In the electronic devices industry, such as BenQ, Samsung Electronics, and B2C enterprises, are investing in research and development to cater to the commercial, gaming, virtual gaming, and entertainment sectors. In conclusion, the market is a dynamic and evolving landscape, driven by technological advancements and consumer demand for sustainable and environmentally friendly solutions. The market is expected to continue growing, with a focus on LED displays, advanced connectivity options, and eco-friendly practices.
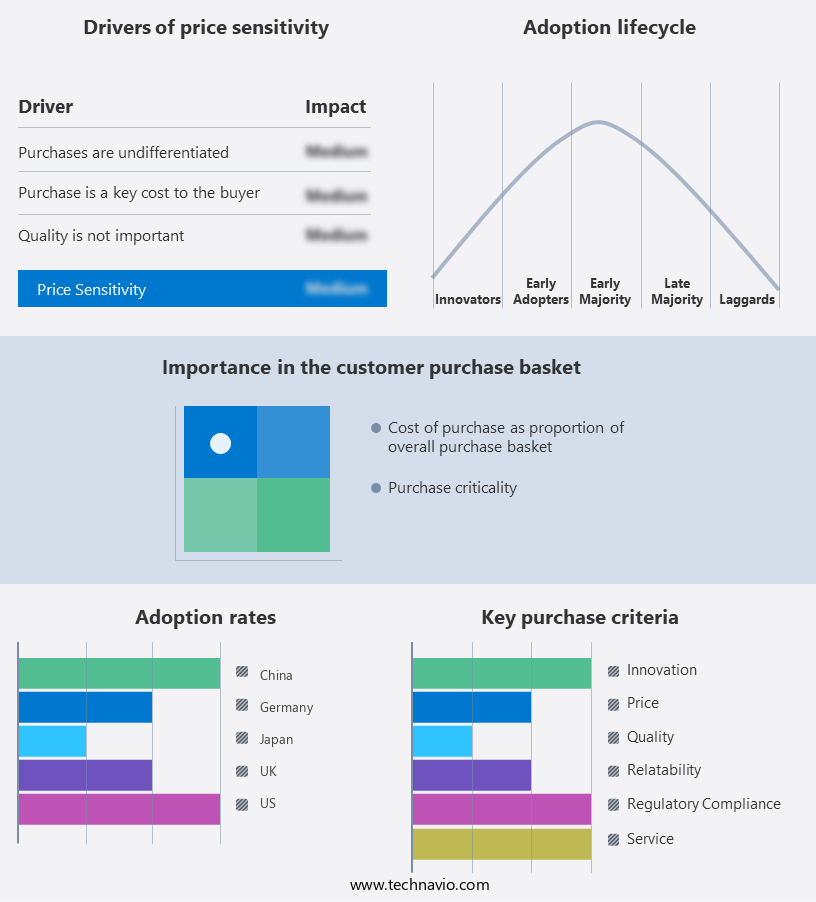
      • Exclusive Customer Landscape

        The computer monitor market forecasting report includes the adoption lifecycle of the market, covering from the innovator’s stage to the laggard’s stage. It focuses on adoption rates in different regions based on penetration. Furthermore, the computer monitor market report also includes key purchase criteria and drivers of price sensitivity to help companies evaluate and develop their market growth analysis strategies.

        Computer Monitor Market Share by Geography

         Customer Landscape

        Key Companies & Market Insights

        Companies are implementing various strategies, such as strategic alliances, computer monitor market forecast, partnerships, mergers and acquisitions, geographical expansion, and product/service launches, to enhance their presence In the industry.

        Acer Inc. - The company provides a selection of computer monitors, including the Acer Nitro VG270 M3, Acer K273E, and Acer SA222Q models. These monitors feature LED backlight LCD technology for enhanced visual clarity and energy efficiency. With various sizes and specifications available, the company caters to diverse user needs In the market.

        The industry research and growth report includes detailed analyses of the competitive landscape of the market and information about key companies, including:

        • Acer Inc.
        • Apple Inc.
        • ASUSTeK Computer Inc.
        • BenQ Corp.
        • Dell Technologies Inc.
        • Exergen Corp.
        • HP Inc.
        • Huawei Technologies Co. Ltd.
        • Koninklijke Philips N.V.
        • Lenovo Group Ltd.
        • LG Electronics Inc.
        • Micro Star International Co. Ltd.
        • OnePlus Technology Co. Ltd.
        • Razer Inc.
        • Samsung Electronics Co. Ltd.
        • Seiko Epson Corp.
        • Toshiba Corp.
        • TPV Technology Co. Ltd.
        • ViewSonic Corp.
        • Xiaomi Communications Co. Ltd.

        Qualitative and quantitative analysis of companies has been conducted to help clients understand the wider business environment as well as the strengths and weaknesses of key industry players. Data is qualitatively analyzed to categorize companies as pure play, category-focused, industry-focused, and diversified; it is quantitatively analyzed to categorize companies as dominant, leading, strong, tentative, and weak.

        Research Analyst Overview

        The market encompasses a wide range of output devices designed to display visual information processed by computers. These devices are essential components of the digital ecosystem, enabling users to interact with data and multimedia content. The fundamental components of a computer monitor include the circuitry, casing, power supply, and display technology. Display technologies have evolved significantly over the years, with TFT-LCD, LED backlighting, CCFL backlighting, cathode-ray tubes, plasma displays, OLED, and various connection technologies such as VGA, HDMI, DisplayPort, USB-C, LVDS, and LCD, among others, shaping the market landscape. The market is influenced by several factors, including size, technology, and application areas.

        LCD monitors and LED monitors have gained significant traction due to their energy efficiency, sleek designs, and high-resolution capabilities. The commercial sector, including B2C enterprises, has shown a growing preference for larger monitors to enhance productivity and improve collaboration. Gaming and virtual gaming applications have also driven demand for advanced features such as high refresh rates, fast response times, and wide color gamuts. LED displays, with their superior brightness, contrast, and energy efficiency, have become popular choices for gaming enthusiasts. The market for computer monitors is interconnected with the broader electronic devices and digital devices market. The increasing popularity of smartphones and other mobile devices has led to a shift in consumer spending patterns, with users opting for smaller, more portable displays.

        However, the demand for larger, high-resolution displays for home-office activities, entertainment, and communication continues to drive growth In the market. The market exhibits an S-curve growth pattern, with rapid growth followed by a gradual decline as the technology matures and saturation sets in. Trend smoothing techniques, such as moving averages and exponential smoothing, are used to analyze market data and estimate future growth. The penetration rate of 5G technology is expected to have a significant impact on the market, with faster internet speeds enabling higher-resolution video streaming and remote work capabilities. The increasing adoption of smart monitors, which integrate various functionalities such as voice assistants and Thunderbolt G4 docks, is also expected to drive growth In the market.

        In conclusion, the market is a dynamic and evolving landscape, shaped by technological advancements, changing user preferences, and broader market trends. The market is expected to continue growing, driven by the increasing demand for larger, high-resolution displays and advanced features for various applications.

        Market Scope

        Report Coverage

        Details

        Page number

        167

        Base year

        2023

        Historic period

        2018-2022

        Forecast period

        2024-2028

        Growth momentum & CAGR

        Accelerate at a CAGR of 8.64%

        Market growth 2024-2028

        USD 22.83 billion

        Market structure

        Fragmented

        YoY growth 2023-2024(%)

        7.78

        Key countries

        US, China, Japan, UK, and Germany

        Competitive landscape

        Leading Companies, Market Positioning of Companies, Competitive Strategies, and Industry Risks

        Request Free Sample

        What are the Key Data Covered in this Computer Monitor Market Research and Growth Report?

        • CAGR of the Computer Monitor industry during the forecast period
        • Detailed information on factors that will drive the growth and forecasting between 2024 and 2028
        • Precise estimation of the size of the market and its contribution of the industry in focus to the parent market
        • Accurate predictions about upcoming growth and trends and changes in consumer behaviour
        • Growth of the market across APAC, North America, Europe, Middle East and Africa, and South America
        • Thorough analysis of the market’s competitive landscape and detailed information about companies
        • Comprehensive analysis of factors that will challenge the computer monitor market growth of industry companies

        We can help! Our analysts can customize this computer monitor market research report to meet your requirements.

        Get in touch


        1 Executive Summary

        • 1.1 Market overview
          • Exhibit 01: Executive Summary – Chart on Market Overview
          • Exhibit 02: Executive Summary – Data Table on Market Overview
          • Exhibit 03: Executive Summary – Chart on Global Market Characteristics
          • Exhibit 04: Executive Summary – Chart on Market by Geography
          • Exhibit 05: Executive Summary – Chart on Market Segmentation by Application
          • Exhibit 06: Executive Summary – Chart on Market Segmentation by Type
          • Exhibit 07: Executive Summary – Chart on Incremental Growth
          • Exhibit 08: Executive Summary – Data Table on Incremental Growth
          • Exhibit 09: Executive Summary – Chart on Vendor Market Positioning

        2 Market Landscape

        • 2.1 Market ecosystem
          • Exhibit 10: Parent market
          • Exhibit 11: Market Characteristics

        3 Market Sizing

        • 3.1 Market definition
          • Exhibit 12: Offerings of vendors included in the market definition
        • 3.2 Market segment analysis
          • Exhibit 13: Market segments
        • 3.3 Market size 2023
          • 3.4 Market outlook: Forecast for 2023-2028
            • Exhibit 14: Chart on Global - Market size and forecast 2023-2028 ($ billion)
            • Exhibit 15: Data Table on Global - Market size and forecast 2023-2028 ($ billion)
            • Exhibit 16: Chart on Global Market: Year-over-year growth 2023-2028 (%)
            • Exhibit 17: Data Table on Global Market: Year-over-year growth 2023-2028 (%)

          4 Historic Market Size

          • 4.1 Global computer monitor market 2018 - 2022
            • Exhibit 18: Historic Market Size – Data Table on global computer monitor market 2018 - 2022 ($ billion)
          • 4.2 Application Segment Analysis 2018 - 2022
            • Exhibit 19: Historic Market Size – Application Segment 2018 - 2022 ($ billion)
          • 4.3 Type Segment Analysis 2018 - 2022
            • Exhibit 20: Historic Market Size – Type Segment 2018 - 2022 ($ billion)
          • 4.4 Geography Segment Analysis 2018 - 2022
            • Exhibit 21: Historic Market Size – Geography Segment 2018 - 2022 ($ billion)
          • 4.5 Country Segment Analysis 2018 - 2022
            • Exhibit 22: Historic Market Size – Country Segment 2018 - 2022 ($ billion)

          5 Five Forces Analysis

          • 5.1 Five forces summary
            • Exhibit 23: Five forces analysis - Comparison between 2023 and 2028
          • 5.2 Bargaining power of buyers
            • Exhibit 24: Chart on Bargaining power of buyers – Impact of key factors 2023 and 2028
          • 5.3 Bargaining power of suppliers
            • Exhibit 25: Bargaining power of suppliers – Impact of key factors in 2023 and 2028
          • 5.4 Threat of new entrants
            • Exhibit 26: Threat of new entrants – Impact of key factors in 2023 and 2028
          • 5.5 Threat of substitutes
            • Exhibit 27: Threat of substitutes – Impact of key factors in 2023 and 2028
          • 5.6 Threat of rivalry
            • Exhibit 28: Threat of rivalry – Impact of key factors in 2023 and 2028
          • 5.7 Market condition
            • Exhibit 29: Chart on Market condition - Five forces 2023 and 2028

          6 Market Segmentation by Application

          • 6.1 Market segments
            • Exhibit 30: Chart on Application - Market share 2023-2028 (%)
            • Exhibit 31: Data Table on Application - Market share 2023-2028 (%)
          • 6.2 Comparison by Application
            • Exhibit 32: Chart on Comparison by Application
            • Exhibit 33: Data Table on Comparison by Application
          • 6.3 Consumer/commercial - Market size and forecast 2023-2028
            • Exhibit 34: Chart on Consumer/commercial - Market size and forecast 2023-2028 ($ billion)
            • Exhibit 35: Data Table on Consumer/commercial - Market size and forecast 2023-2028 ($ billion)
            • Exhibit 36: Chart on Consumer/commercial - Year-over-year growth 2023-2028 (%)
            • Exhibit 37: Data Table on Consumer/commercial - Year-over-year growth 2023-2028 (%)
          • 6.4 Gaming - Market size and forecast 2023-2028
            • Exhibit 38: Chart on Gaming - Market size and forecast 2023-2028 ($ billion)
            • Exhibit 39: Data Table on Gaming - Market size and forecast 2023-2028 ($ billion)
            • Exhibit 40: Chart on Gaming - Year-over-year growth 2023-2028 (%)
            • Exhibit 41: Data Table on Gaming - Year-over-year growth 2023-2028 (%)
          • 6.5 Others - Market size and forecast 2023-2028
            • Exhibit 42: Chart on Others - Market size and forecast 2023-2028 ($ billion)
            • Exhibit 43: Data Table on Others - Market size and forecast 2023-2028 ($ billion)
            • Exhibit 44: Chart on Others - Year-over-year growth 2023-2028 (%)
            • Exhibit 45: Data Table on Others - Year-over-year growth 2023-2028 (%)
          • 6.6 Market opportunity by Application
            • Exhibit 46: Market opportunity by Application ($ billion)
            • Exhibit 47: Data Table on Market opportunity by Application ($ billion)

          7 Market Segmentation by Type

          • 7.1 Market segments
            • Exhibit 48: Chart on Type - Market share 2023-2028 (%)
            • Exhibit 49: Data Table on Type - Market share 2023-2028 (%)
          • 7.2 Comparison by Type
            • Exhibit 50: Chart on Comparison by Type
            • Exhibit 51: Data Table on Comparison by Type
          • 7.3 LCD monitor - Market size and forecast 2023-2028
            • Exhibit 52: Chart on LCD monitor - Market size and forecast 2023-2028 ($ billion)
            • Exhibit 53: Data Table on LCD monitor - Market size and forecast 2023-2028 ($ billion)
            • Exhibit 54: Chart on LCD monitor - Year-over-year growth 2023-2028 (%)
            • Exhibit 55: Data Table on LCD monitor - Year-over-year growth 2023-2028 (%)
          • 7.4 LED monitor - Market size and forecast 2023-2028
            • Exhibit 56: Chart on LED monitor - Market size and forecast 2023-2028 ($ billion)
            • Exhibit 57: Data Table on LED monitor - Market size and forecast 2023-2028 ($ billion)
            • Exhibit 58: Chart on LED monitor - Year-over-year growth 2023-2028 (%)
            • Exhibit 59: Data Table on LED monitor - Year-over-year growth 2023-2028 (%)
          • 7.5 CRT - Market size and forecast 2023-2028
            • Exhibit 60: Chart on CRT - Market size and forecast 2023-2028 ($ billion)
            • Exhibit 61: Data Table on CRT - Market size and forecast 2023-2028 ($ billion)
            • Exhibit 62: Chart on CRT - Year-over-year growth 2023-2028 (%)
            • Exhibit 63: Data Table on CRT - Year-over-year growth 2023-2028 (%)
          • 7.6 Others - Market size and forecast 2023-2028
            • Exhibit 64: Chart on Others - Market size and forecast 2023-2028 ($ billion)
            • Exhibit 65: Data Table on Others - Market size and forecast 2023-2028 ($ billion)
            • Exhibit 66: Chart on Others - Year-over-year growth 2023-2028 (%)
            • Exhibit 67: Data Table on Others - Year-over-year growth 2023-2028 (%)
          • 7.7 Market opportunity by Type
            • Exhibit 68: Market opportunity by Type ($ billion)
            • Exhibit 69: Data Table on Market opportunity by Type ($ billion)

          8 Customer Landscape

          • 8.1 Customer landscape overview
            • Exhibit 70: Analysis of price sensitivity, lifecycle, customer purchase basket, adoption rates, and purchase criteria

          9 Geographic Landscape

          • 9.1 Geographic segmentation
            • Exhibit 71: Chart on Market share by geography 2023-2028 (%)
            • Exhibit 72: Data Table on Market share by geography 2023-2028 (%)
          • 9.2 Geographic comparison
            • Exhibit 73: Chart on Geographic comparison
            • Exhibit 74: Data Table on Geographic comparison
          • 9.3 APAC - Market size and forecast 2023-2028
            • Exhibit 75: Chart on APAC - Market size and forecast 2023-2028 ($ billion)
            • Exhibit 76: Data Table on APAC - Market size and forecast 2023-2028 ($ billion)
            • Exhibit 77: Chart on APAC - Year-over-year growth 2023-2028 (%)
            • Exhibit 78: Data Table on APAC - Year-over-year growth 2023-2028 (%)
          • 9.4 North America - Market size and forecast 2023-2028
            • Exhibit 79: Chart on North America - Market size and forecast 2023-2028 ($ billion)
            • Exhibit 80: Data Table on North America - Market size and forecast 2023-2028 ($ billion)
            • Exhibit 81: Chart on North America - Year-over-year growth 2023-2028 (%)
            • Exhibit 82: Data Table on North America - Year-over-year growth 2023-2028 (%)
          • 9.5 Europe - Market size and forecast 2023-2028
            • Exhibit 83: Chart on Europe - Market size and forecast 2023-2028 ($ billion)
            • Exhibit 84: Data Table on Europe - Market size and forecast 2023-2028 ($ billion)
            • Exhibit 85: Chart on Europe - Year-over-year growth 2023-2028 (%)
            • Exhibit 86: Data Table on Europe - Year-over-year growth 2023-2028 (%)
          • 9.6 Middle East and Africa - Market size and forecast 2023-2028
            • Exhibit 87: Chart on Middle East and Africa - Market size and forecast 2023-2028 ($ billion)
            • Exhibit 88: Data Table on Middle East and Africa - Market size and forecast 2023-2028 ($ billion)
            • Exhibit 89: Chart on Middle East and Africa - Year-over-year growth 2023-2028 (%)
            • Exhibit 90: Data Table on Middle East and Africa - Year-over-year growth 2023-2028 (%)
          • 9.7 South America - Market size and forecast 2023-2028
            • Exhibit 91: Chart on South America - Market size and forecast 2023-2028 ($ billion)
            • Exhibit 92: Data Table on South America - Market size and forecast 2023-2028 ($ billion)
            • Exhibit 93: Chart on South America - Year-over-year growth 2023-2028 (%)
            • Exhibit 94: Data Table on South America - Year-over-year growth 2023-2028 (%)
          • 9.8 US - Market size and forecast 2023-2028
            • Exhibit 95: Chart on US - Market size and forecast 2023-2028 ($ billion)
            • Exhibit 96: Data Table on US - Market size and forecast 2023-2028 ($ billion)
            • Exhibit 97: Chart on US - Year-over-year growth 2023-2028 (%)
            • Exhibit 98: Data Table on US - Year-over-year growth 2023-2028 (%)
          • 9.9 China - Market size and forecast 2023-2028
            • Exhibit 99: Chart on China - Market size and forecast 2023-2028 ($ billion)
            • Exhibit 100: Data Table on China - Market size and forecast 2023-2028 ($ billion)
            • Exhibit 101: Chart on China - Year-over-year growth 2023-2028 (%)
            • Exhibit 102: Data Table on China - Year-over-year growth 2023-2028 (%)
          • 9.10 Japan - Market size and forecast 2023-2028
            • Exhibit 103: Chart on Japan - Market size and forecast 2023-2028 ($ billion)
            • Exhibit 104: Data Table on Japan - Market size and forecast 2023-2028 ($ billion)
            • Exhibit 105: Chart on Japan - Year-over-year growth 2023-2028 (%)
            • Exhibit 106: Data Table on Japan - Year-over-year growth 2023-2028 (%)
          • 9.11 UK - Market size and forecast 2023-2028
            • Exhibit 107: Chart on UK - Market size and forecast 2023-2028 ($ billion)
            • Exhibit 108: Data Table on UK - Market size and forecast 2023-2028 ($ billion)
            • Exhibit 109: Chart on UK - Year-over-year growth 2023-2028 (%)
            • Exhibit 110: Data Table on UK - Year-over-year growth 2023-2028 (%)
          • 9.12 Germany - Market size and forecast 2023-2028
            • Exhibit 111: Chart on Germany - Market size and forecast 2023-2028 ($ billion)
            • Exhibit 112: Data Table on Germany - Market size and forecast 2023-2028 ($ billion)
            • Exhibit 113: Chart on Germany - Year-over-year growth 2023-2028 (%)
            • Exhibit 114: Data Table on Germany - Year-over-year growth 2023-2028 (%)
          • 9.13 Market opportunity by geography
            • Exhibit 115: Market opportunity by geography ($ billion)
            • Exhibit 116: Data Tables on Market opportunity by geography ($ billion)

          10 Drivers, Challenges, and Trends

          • 10.1 Market drivers
            • 10.2 Market challenges
              • 10.3 Impact of drivers and challenges
                • Exhibit 117: Impact of drivers and challenges in 2023 and 2028
              • 10.4 Market trends

                11 Vendor Landscape

                • 11.1 Overview
                  • 11.2 Vendor landscape
                    • Exhibit 118: Overview on Criticality of inputs and Factors of differentiation
                  • 11.3 Landscape disruption
                    • Exhibit 119: Overview on factors of disruption
                  • 11.4 Industry risks
                    • Exhibit 120: Impact of key risks on business

                  12 Vendor Analysis

                  • 12.1 Vendors covered
                    • Exhibit 121: Vendors covered
                  • 12.2 Market positioning of vendors
                    • Exhibit 122: Matrix on vendor position and classification
                  • 12.3 Acer Inc.
                    • Exhibit 123: Acer Inc. - Overview
                    • Exhibit 124: Acer Inc. - Business segments
                    • Exhibit 125: Acer Inc. - Key news
                    • Exhibit 126: Acer Inc. - Key offerings
                    • Exhibit 127: Acer Inc. - Segment focus
                  • 12.4 Apple Inc.
                    • Exhibit 128: Apple Inc. - Overview
                    • Exhibit 129: Apple Inc. - Business segments
                    • Exhibit 130: Apple Inc. - Key news
                    • Exhibit 131: Apple Inc. - Key offerings
                    • Exhibit 132: Apple Inc. - Segment focus
                  • 12.5 ASUSTeK Computer Inc.
                    • Exhibit 133: ASUSTeK Computer Inc. - Overview
                    • Exhibit 134: ASUSTeK Computer Inc. - Product / Service
                    • Exhibit 135: ASUSTeK Computer Inc. - Key news
                    • Exhibit 136: ASUSTeK Computer Inc. - Key offerings
                  • 12.6 BenQ Corp.
                    • Exhibit 137: BenQ Corp. - Overview
                    • Exhibit 138: BenQ Corp. - Product / Service
                    • Exhibit 139: BenQ Corp. - Key offerings
                  • 12.7 Dell Technologies Inc.
                    • Exhibit 140: Dell Technologies Inc. - Overview
                    • Exhibit 141: Dell Technologies Inc. - Business segments
                    • Exhibit 142: Dell Technologies Inc. - Key news
                    • Exhibit 143: Dell Technologies Inc. - Key offerings
                    • Exhibit 144: Dell Technologies Inc. - Segment focus
                  • 12.8 HP Inc.
                    • Exhibit 145: HP Inc. - Overview
                    • Exhibit 146: HP Inc. - Business segments
                    • Exhibit 147: HP Inc. - Key news
                    • Exhibit 148: HP Inc. - Key offerings
                    • Exhibit 149: HP Inc. - Segment focus
                  • 12.9 Koninklijke Philips N.V.
                    • Exhibit 150: Koninklijke Philips N.V. - Overview
                    • Exhibit 151: Koninklijke Philips N.V. - Business segments
                    • Exhibit 152: Koninklijke Philips N.V. - Key news
                    • Exhibit 153: Koninklijke Philips N.V. - Key offerings
                    • Exhibit 154: Koninklijke Philips N.V. - Segment focus
                  • 12.10 Lenovo Group Ltd.
                    • Exhibit 155: Lenovo Group Ltd. - Overview
                    • Exhibit 156: Lenovo Group Ltd. - Business segments
                    • Exhibit 157: Lenovo Group Ltd. - Key offerings
                    • Exhibit 158: Lenovo Group Ltd. - Segment focus
                  • 12.11 LG Electronics Inc.
                    • Exhibit 159: LG Electronics Inc. - Overview
                    • Exhibit 160: LG Electronics Inc. - Product / Service
                    • Exhibit 161: LG Electronics Inc. - Key offerings
                  • 12.12 Micro Star International Co. Ltd.
                    • Exhibit 162: Micro Star International Co. Ltd. - Overview
                    • Exhibit 163: Micro Star International Co. Ltd. - Product / Service
                    • Exhibit 164: Micro Star International Co. Ltd. - Key offerings
                  • 12.13 Razer Inc.
                    • Exhibit 165: Razer Inc. - Overview
                    • Exhibit 166: Razer Inc. - Product / Service
                    • Exhibit 167: Razer Inc. - Key offerings
                  • 12.14 Samsung Electronics Co. Ltd.
                    • Exhibit 168: Samsung Electronics Co. Ltd. - Overview
                    • Exhibit 169: Samsung Electronics Co. Ltd. - Business segments
                    • Exhibit 170: Samsung Electronics Co. Ltd. - Key news
                    • Exhibit 171: Samsung Electronics Co. Ltd. - Key offerings
                    • Exhibit 172: Samsung Electronics Co. Ltd. - Segment focus
                  • 12.15 Toshiba Corp.
                    • Exhibit 173: Toshiba Corp. - Overview
                    • Exhibit 174: Toshiba Corp. - Business segments
                    • Exhibit 175: Toshiba Corp. - Key news
                    • Exhibit 176: Toshiba Corp. - Key offerings
                    • Exhibit 177: Toshiba Corp. - Segment focus
                  • 12.16 TPV Technology Co. Ltd.
                    • Exhibit 178: TPV Technology Co. Ltd. - Overview
                    • Exhibit 179: TPV Technology Co. Ltd. - Product / Service
                    • Exhibit 180: TPV Technology Co. Ltd. - Key offerings
                  • 12.17 ViewSonic Corp.
                    • Exhibit 181: ViewSonic Corp. - Overview
                    • Exhibit 182: ViewSonic Corp. - Product / Service
                    • Exhibit 183: ViewSonic Corp. - Key offerings

                  13 Appendix

                  • 13.1 Scope of the report
                    • 13.2 Inclusions and exclusions checklist
                      • Exhibit 184: Inclusions checklist
                      • Exhibit 185: Exclusions checklist
                    • 13.3 Currency conversion rates for US$
                      • Exhibit 186: Currency conversion rates for US$
                    • 13.4 Research methodology
                      • Exhibit 187: Research methodology
                      • Exhibit 188: Validation techniques employed for market sizing
                      • Exhibit 189: Information sources
                    • 13.5 List of abbreviations
                      • Exhibit 190: List of abbreviations

                    Research Methodology

                    Technavio presents a detailed picture of the market by way of study, synthesis, and summation of data from multiple sources. The analysts have presented the various facets of the market with a particular focus on identifying the key industry influencers. The data thus presented is comprehensive, reliable, and the result of extensive research, both primary and secondary.

                    INFORMATION SOURCES

                    Primary sources

                    • Manufacturers and suppliers
                    • Channel partners
                    • Industry experts
                    • Strategic decision makers

                    Secondary sources

                    • Industry journals and periodicals
                    • Government data
                    • Financial reports of key industry players
                    • Historical data
                    • Press releases

                    DATA ANALYSIS

                    Data Synthesis

                    • Collation of data
                    • Estimation of key figures
                    • Analysis of derived insights

                    Data Validation

                    • Triangulation with data models
                    • Reference against proprietary databases
                    • Corroboration with industry experts

                    REPORT WRITING

                    Qualitative

                    • Market drivers
                    • Market challenges
                    • Market trends
                    • Five forces analysis

                    Quantitative

                    • Market size and forecast
                    • Market segmentation
                    • Geographical insights
                    • Competitive landscape

                    Interested in this report?

                    Get your sample now to see our research methodology and insights!

                    Download Now

                    Frequently Asked Questions

                    Computer Monitor market growth will increase by $ 22.83 bn during 2024-2028.

                    The Computer Monitor market is expected to grow at a CAGR of 8.64% during 2024-2028.

                    Computer Monitor market is segmented by Application( Consumer/commercial, Gaming, Others) Type( LCD monitor, LED monitor, CRT, Others)

                    Acer Inc., Apple Inc., ASUSTeK Computer Inc., BenQ Corp., Dell Technologies Inc., Exergen Corp., HP Inc., Huawei Technologies Co. Ltd., Koninklijke Philips N.V., Lenovo Group Ltd., LG Electronics Inc., Micro Star International Co. Ltd., OnePlus Technology Co. Ltd., Razer Inc., Samsung Electronics Co. Ltd., Seiko Epson Corp., Toshiba Corp., TPV Technology Co. Ltd., ViewSonic Corp., Xiaomi Communications Co. Ltd. are a few of the key vendors in the Computer Monitor market.

                    APAC will register the highest growth rate of 39% among the other regions. Therefore, the Computer Monitor market in APAC is expected to garner significant business opportunities for the vendors during the forecast period.

                    US, China, Japan, UK, Germany

                    • Rising demand for high-resolution displaysThe global computer monitor market has experienced significant growth in recent years is the driving factor this market.
                    • with a key driver being the rising demand for high-resolution monitors. As technology advances and becomes more accessible is the driving factor this market.
                    • consumers are increasingly seeking high-quality visuals and immersive experiences in their computing devices. This has led to a surge in the adoption of high-resolution monitors across various sectors is the driving factor this market.
                    • including gaming is the driving factor this market.
                    • design is the driving factor this market.
                    • entertainment is the driving factor this market.
                    • and productivity. The primary factor driving the demand for high-resolution monitors is the increasing consumption of visual content. With the advent of high-definition videos is the driving factor this market.
                    • 4K streaming is the driving factor this market.
                    • and rich multimedia applications is the driving factor this market.
                    • users are demanding monitors that can provide sharper images is the driving factor this market.
                    • vibrant colors is the driving factor this market.
                    • and better detail. High-resolution monitors is the driving factor this market.
                    • such as 4K and even 8K displays is the driving factor this market.
                    • offer superior picture quality is the driving factor this market.
                    • enhancing the overall viewing experience and allowing users to engage more deeply with digital content. For example is the driving factor this market.
                    • in February 2022 is the driving factor this market.
                    • BenQ is the driving factor this market.
                    • one of the top producers of computer accessories and video game displays worldwide is the driving factor this market.
                    • launched the new 4K gaming display in India. The monitor has a 32-inch 4K Ultra-HD (3 is the driving factor this market.
                    • 8402 is the driving factor this market.
                    • 160 pixels) in-plane switching (IPS) LCD screen with a refresh rate of up to 144Hz and a 1ms Mobile Robot Programming Toolkit (MRPT) reaction time (2ms Gray-to-gray (GtG)) once it is connected to a computer. The gaming industry is the driving factor this market.
                    • in particular is the driving factor this market.
                    • has greatly contributed to the demand for high-resolution monitors. Gamers are seeking immersive and realistic gaming experiences is the driving factor this market.
                    • and high-resolution displays play a crucial role in achieving that. The finer details and improved graphics provided by these monitors offer gamers a more visually stunning and engaging gameplay. Additionally is the driving factor this market.
                    • the growing popularity of esports and the increasing number of professional gamers have further fueled the demand for high-resolution monitors is the driving factor this market.
                    • as they require top-notch display performance to gain a competitive edge. For example is the driving factor this market.
                    • Xiaomi launched its 27-inch 4K monitor in China in December 2021. The 27-inch IPS LCD screen on this new Xiaomi monitor offers 4K resolution. High-resolution monitors are in high demand in the design and creative industries. Professionals such as graphic designers is the driving factor this market.
                    • photographers is the driving factor this market.
                    • and video editors rely on precise color representation and accurate details to deliver their work effectively. High-resolution monitors provide them with the necessary clarity and precision required for their creative tasks is the driving factor this market.
                    • ensuring accurate color reproduction and fine detailing. Furthermore is the driving factor this market.
                    • the rise of remote work and the increased reliance on digital communication tools have amplified the need for high-resolution monitors. Professionals who spend hours in front of their screens for work purposes require comfortable and visually pleasing displays to reduce eye strain and promote productivity. Thus is the driving factor this market.
                    • the rising demand for high-resolution displays will drive the growth of the global computer monitor market during the forecast period. is the driving factor this market.

                    The Computer Monitor market vendors should focus on grabbing business opportunities from the Consumer/commercial segment as it accounted for the largest market share in the base year.
                    RIA - Research AI Assistant
                    Ask RIA