Dredger Market Analysis, Size, and Forecast 2025-2029: North America (US and Canada), Europe (Belgium, France, Germany, The Netherlands, and UK), APAC (China, Japan, and South Korea), and Rest of World (ROW)

Dredger Market Analysis, Size, and Forecast 2025-2029:
North America (US and Canada), Europe (Belgium, France, Germany, The Netherlands, and UK), APAC (China, Japan, and South Korea), and Rest of World (ROW)

Published: May 2025 225 Pages SKU: IRTNTR77900

Market Overview at a Glance

$395.9 Mn
Market Opportunity
2.9%
CAGR
2.8
YoY growth 2024-2025(%)

Dredger Market Size 2025-2029

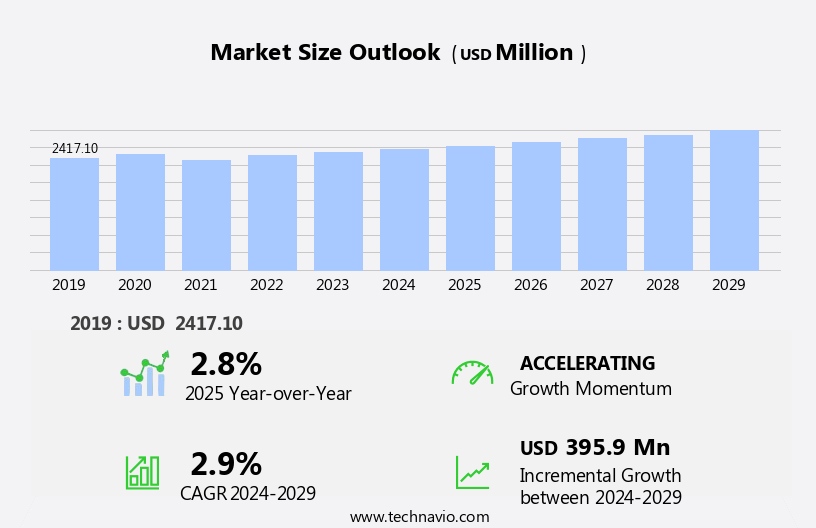
The dredger market size is forecast to increase by USD 395.9 million, at a CAGR of 2.9% between 2024 and 2029.

  • The market is experiencing significant growth due to the increasing oil and gas exploration and production activities worldwide. This sector's expansion is driving the demand for dredgers to maintain access to offshore drilling sites and ensure efficient operations. Furthermore, technological advancements in dredging equipment are enhancing productivity and reducing operational costs. Advanced tools, automation, real-time monitoring, precision, and advanced control systems are integral to modern dredging operations, ensuring minimal sediment disturbance and turbidity. However, the market is not without challenges. Fluctuations in raw material costs and oil prices pose significant obstacles, as these factors can significantly impact the profitability of dredging operations.
  • Companies in the market must navigate these challenges effectively to capitalize on the opportunities presented by the growing demand for dredgers and the advancements in technology. To remain competitive, it is essential for businesses to adopt innovative solutions and maintain operational efficiency while managing the risks associated with raw material and energy price volatility.

What will be the Size of the Dredger Market during the forecast period?

Dredger Market Size

Explore in-depth regional segment analysis with market size data - historical 2019-2023 and forecasts 2025-2029 - in the full report.  
Request Free Sample

The market continues to evolve, driven by the diverse needs of various sectors, including land reclamation, coastal protection, and harbor maintenance. The market dynamics are shaped by numerous factors, such as capital costs, excavation depth, soil type, and environmental regulations. Electrical systems play a crucial role in the efficient operation of hydraulic dredgers, water injection dredgers, backhoe dredgers, and other dredging technologies. These systems power the pumps, control systems, and automation systems, enabling optimal dredging productivity and pumping efficiency. Material handling and project management are essential aspects of dredging operations, with lifecycle costs, maintenance and repair, and safety regulations being key considerations.

Dredging technology advances, such as swinging ladder dredgers, GPS positioning systems, and remote control dredging, contribute to increased productivity and reduced operational costs. Channel deepening projects require dredging pumps with high pump capacity and pumping efficiency, as well as slurry pipelines for transporting the dredged material. Dredging spoil disposal and sediment removal are also critical aspects of dredging operations, with environmental impact assessments and risk assessments being essential components of the planning process. Underwater dredging, using grab dredgers, airlift dredgers, and dipper dredgers, presents unique challenges, requiring specialized equipment and expertise. Corrosion protection and wear resistance are essential features for dredgers operating in harsh environments.

The ongoing evolution of dredging technology and the continuous unfolding of market activities highlight the dynamic nature of the market. The integration of advanced technologies, such as automation systems and hydraulic systems, is transforming the industry, offering opportunities for innovation and growth.

How is this Dredger Industry segmented?

The dredger industry research report provides comprehensive data (region-wise segment analysis), with forecasts and estimates in "USD million" for the period 2025-2029, as well as historical data from 2019-2023 for the following segments.

  • Type
    • Hydraulic dredgers
    • Mechanical dredgers
    • Others
  • Application
    • Maintenance
    • Construction
  • End-user
    • Oil and gas
    • Mining
    • Renewable energy
    • Government and municipal bodies
    • Others
  • Geography
    • North America
      • US
      • Canada
    • Europe
      • France
      • Germany
      • Italy
      • UK
    • Middle East and Africa
      • Egypt
      • KSA
      • Oman
      • UAE
    • APAC
      • China
      • India
      • Japan
    • South America
      • Argentina
      • Brazil
    • Rest of World (ROW)

    By Type Insights

    The hydraulic dredgers segment is estimated to witness significant growth during the forecast period.

    The market encompasses various types of dredging technologies, with hydraulic dredgers being a significant segment. These dredgers utilize hydraulic processes to excavate, transport, and deposit sediment, employing powerful pumps and suction pipes for underwater excavation. Effective in handling loose or fluidized sediments like sand, gravel, or mud, hydraulic dredgers are widely used in port construction, harbor maintenance, land reclamation, and beach enhancement projects. Hydraulic dredgers include cutter suction dredgers, trailing suction hopper dredgers, and plain suction dredgers, each catering to distinct project needs and site conditions. Capital costs, excavation depth, and dredging productivity are crucial factors influencing the choice of a hydraulic dredger.

    Environmental regulations and soil mechanics play a vital role in the dredging process, necessitating the implementation of safety regulations, corrosion protection, and wear resistance. Automation systems, swinging ladders, and GPS positioning systems ensure efficient and precise dredging operations. Maintenance and repair, dredging spoil disposal, sediment removal, and dredging pump efficiency are essential considerations for minimizing operational costs. Discharge distance, pump capacity, and underwater dredging techniques impact the overall project lifecycle costs. Dredging technology advancements include hydraulic systems, control systems, and dredging pumps, enabling increased dredging productivity and efficiency. Dredging permitting, risk assessment, and remote control dredging are integral aspects of the dredging process, ensuring regulatory compliance and operational safety.

    Water injection dredgers, grab dredgers, backhoe dredgers, airlift dredgers, and dipper dredgers are alternative dredging technologies catering to specific project requirements and site conditions. Regardless of the chosen dredging technology, the focus remains on minimizing environmental impact, ensuring operational safety, and maximizing productivity and efficiency.

    Dredger Market Size

    Request Free Sample

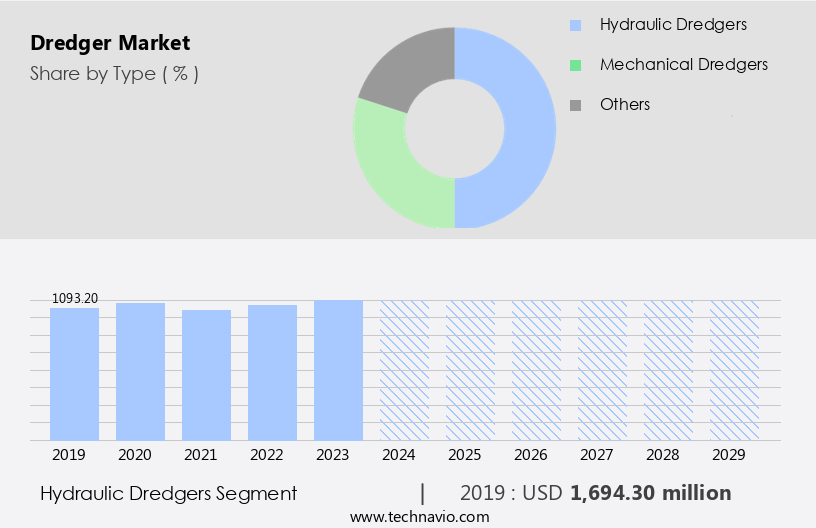
    The Hydraulic dredgers segment was valued at USD 1694.30 million in 2019 and showed a gradual increase during the forecast period.

    Regional Analysis

    North America is estimated to contribute 39% to the growth of the global market during the forecast period.Technavio's analysts have elaborately explained the regional trends and drivers that shape the market during the forecast period.

    Dredger Market Share by Geography

     Request Free Sample

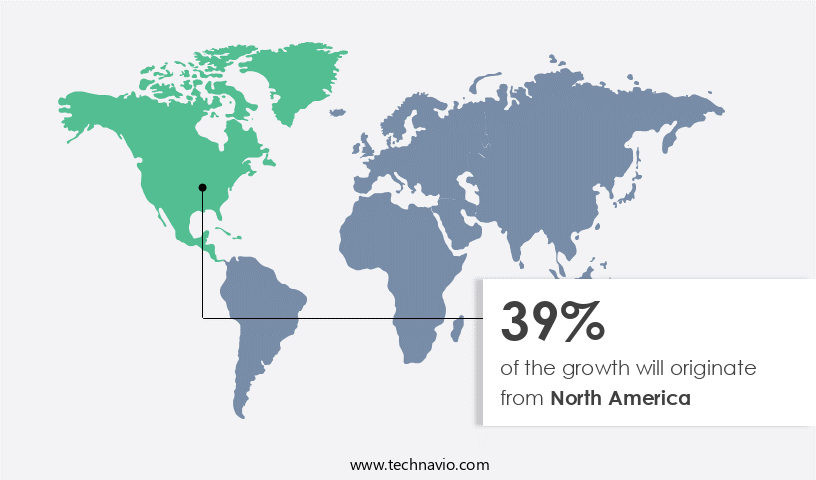
    The North American market is experiencing growth due to infrastructure development, coastal restoration projects, and expanding ports and waterways. Navigational channels require regular maintenance dredging to ensure seamless sea transportation. Coastal erosion is another concern addressed through dredging activities, contributing to coastal resilience efforts. Investment by shipbuilding companies in constructing specialized dredger vessels is a significant trend. Dredging equipment demand is expected to rise, with various types such as pipeline dredging, capital-intensive and requiring deep excavation depths, being utilized. Grab dredgers, which use a mechanical arm to scoop up sediment, and backhoe dredgers, which use a hydraulic excavator, are common choices.

    Environmental regulations necessitate careful consideration of soil type and environmental impact assessments. Water injection dredgers and airlift dredgers are used for underwater dredging, while maintenance and repair costs are crucial factors in operational expenses. Safety regulations and automation systems, including swinging ladders and GPS positioning systems, ensure safe and efficient dredging operations. Hydraulic systems and control systems optimize pumping efficiency and pump capacity. Dredging technology, such as slurry pipelines and cutter suction dredgers, facilitates large-scale projects like land reclamation and channel deepening. Environmental impact assessments, corrosion protection, and wear resistance are essential considerations in dredging projects. Project management, material handling, and lifecycle costs are crucial factors in the decision-making process.

    Dredging permitting and risk assessment are integral parts of the planning and execution phases. Remote control dredging and dredging productivity enhancements further streamline operations.

    Market Dynamics

    The Global Dredger Market is experiencing significant expansion, driven by increasing demands in maritime infrastructure. Key products include cutter suction dredgers and trailing suction hopper dredgers, vital for projects like port development and navigation channel maintenance. Land reclamation and coastal protection initiatives also heavily rely on specialized dredger equipment. The growing focus on environmental dredging highlights the industry's commitment to ecological sustainability. Advancements in dredging equipment and dredging technology, including increasing automation in dredging and real-time monitoring, are enhancing efficiency. The Asia Pacific dredger market remains a dominant force, with numerous dredger manufacturers contributing to both maintenance dredging and capital dredging projects. Furthermore, river dredging and mining dredging activities contribute substantially to the overall global dredger market trends.

    Our researchers analyzed the data with 2024 as the base year, along with the key drivers, trends, and challenges. A holistic analysis of drivers will help companies refine their marketing strategies to gain a competitive advantage.

    What are the key market drivers leading to the rise in the adoption of Dredger Industry?

    • The surge in infrastructure development initiatives has led to a significant increase in the demand for dredgers, serving as the primary market driver. 
    • The market is experiencing significant growth due to the increasing demand for sediment removal in infrastructure development projects. Dredging is essential for expanding and modernizing ports, harbors, and waterways, which in turn supports economic growth, maritime trade, and coastal resilience. A prime example of this is the Panama Canal expansion, which required the dredging of millions of cubic meters of soil to deepen and widen its navigational channels, enabling larger vessels to pass through. This project not only enhanced the canal's capacity and efficiency but also boosted global trade flows and maritime connectivity, leading to increased demand for dredging equipment.
    • Key market dynamics include dredging productivity, discharge distance, operational costs, pumping efficiency, and pump capacity. Underwater dredging technologies, safety regulations, soil mechanics, automation systems, and swinging ladder dredgers are crucial aspects of the dredging industry. Environmental impact assessments are also essential to minimize the environmental footprint of dredging activities. Dredging productivity is a significant factor influencing market growth, as increased productivity leads to cost savings and higher efficiency. Discharge distance and operational costs are also essential considerations, as they impact the overall cost structure of dredging projects. Pumping efficiency and pump capacity are critical factors for ensuring the effective removal of sediments and maintaining the desired water depths.
    • Automation systems and swinging ladder dredgers are gaining popularity due to their ability to enhance safety and improve operational efficiency. Safety regulations are increasingly stringent, necessitating the adoption of advanced safety features in dredging equipment. Soil mechanics plays a vital role in determining the choice of dredging technology and the design of dredging equipment. In conclusion, The market is driven by the need for sediment removal in infrastructure development projects, which in turn supports economic growth, maritime trade, and coastal resilience. Key market dynamics include dredging productivity, discharge distance, operational costs, pumping efficiency, and pump capacity.
    • Technological advancements, safety regulations, and environmental considerations are shaping the future of the dredging industry.

    What are the market trends shaping the Dredger Industry?

    • The trend in the dredging industry is being shaped by technological advancements in dredging equipment. These innovations are mandatory for staying competitive in the market.
    • The market is experiencing substantial growth due to advancements in dredging technology. Innovations in electrical systems, material handling, project management, and control systems are revolutionizing traditional dredging processes, enhancing operational efficiency, safety, and environmental sustainability. Technological advancements include the adoption of hydraulic dredgers, dredging pumps, slurry pipelines, and bucket dredgers, which enable companies to tackle complex projects more effectively and efficiently.
    • Leading dredging companies, such as Damen Shipyards Group and Royal IHC, are developing next-generation dredging vessels with advanced dredging equipment, high-performance pumps, and integrated automation technologies. These advancements are driving market expansion, making dredging a more cost-effective and sustainable solution for land reclamation, channel deepening, and material handling projects.

    What challenges does the Dredger Industry face during its growth?

    • The industry's growth is significantly impacted by the volatile nature of raw material costs and oil prices, which pose a substantial challenge. 
    • Dredging is an essential aspect of harbor maintenance, involving the removal of sediments and debris from waterways to ensure safe and efficient navigation. Dredging permitting and risk assessment are crucial components of this process, ensuring compliance with environmental regulations and minimizing potential hazards. Two common types of dredgers are dipper dredgers and cutter suction dredgers. Dipper dredgers use a dipper arm to scoop up sediment, while cutter suction dredgers use a rotating cutter head to cut and suck up sediment. Modern dredgers incorporate advanced technologies such as remote control operation, corrosion protection, wear resistance, GPS positioning systems, and hydraulic systems to enhance efficiency and reduce operational costs.
    • Fluctuations in global oil prices directly impact the dredging industry due to the significant fuel consumption of dredging vessels. Higher fuel prices increase operational expenses, potentially reducing profit margins and making some projects less economically viable. For instance, in recent years, global oil prices have experienced significant volatility due to geopolitical tensions, supply disruptions, and changing demand patterns. Dredging companies must navigate these challenges to maintain profitability and deliver high-quality services.

    Exclusive Customer Landscape

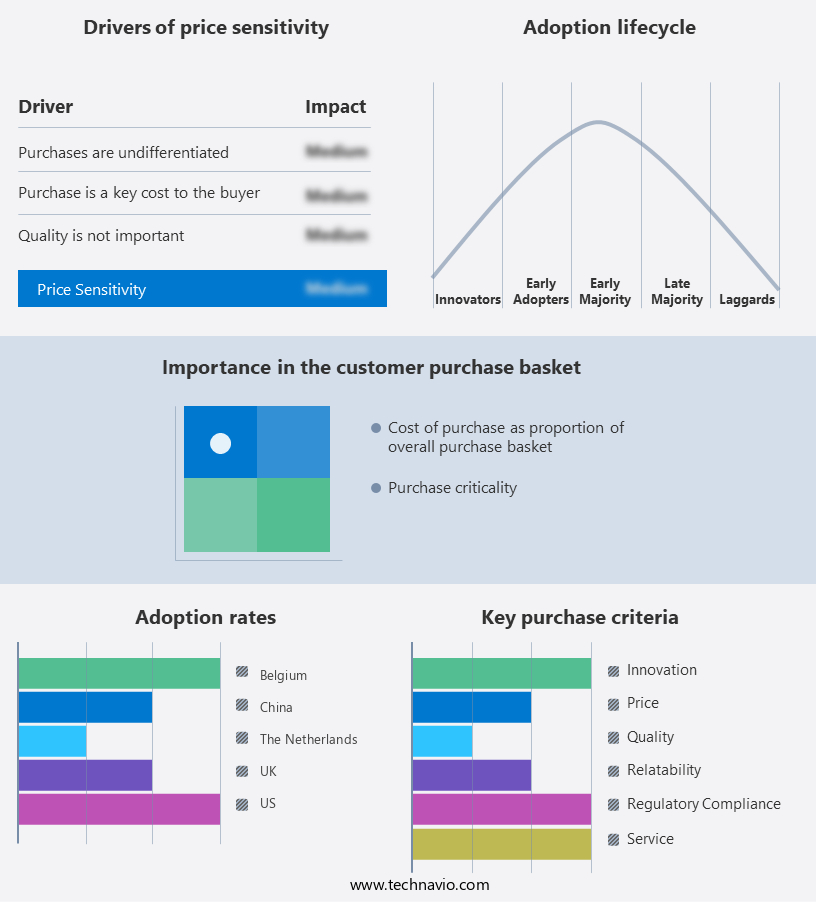
    The dredger market forecasting report includes the adoption lifecycle of the market, covering from the innovator's stage to the laggard's stage. It focuses on adoption rates in different regions based on penetration. Furthermore, the dredger market report also includes key purchase criteria and drivers of price sensitivity to help companies evaluate and develop their market growth analysis strategies.

    Dredger Market Share by Geography

     Customer Landscape

    Key Companies & Market Insights

    Companies are implementing various strategies, such as strategic alliances, dredger market forecast, partnerships, mergers and acquisitions, geographical expansion, and product/service launches, to enhance their presence in the industry.

    American Marine Corp. - The company specializes in marine construction and dredging, providing advanced solutions through its offerings, the AWB 82 and AMC 160 dredgers. These innovative machines cater to various projects, enhancing efficiency and productivity in the industry.

    The industry research and growth report includes detailed analyses of the competitive landscape of the market and information about key companies, including:

    • American Marine Corp.
    • Bell Dredging Pumps B.V.
    • Boskalis
    • CASHMAN DREDGING INC.
    • Damen Shipyards Group
    • DSC Dredge LLC
    • Ellicott Dredges LLC
    • Great Lakes Dredge and Dock Corp.
    • Holland Dredge Design
    • Jan De Nul
    • KEDA Industrial Group Co. Ltd.
    • Leader Dredger Co. Ltd.
    • NMDC Group
    • Penta Ocean Construction Co. Ltd.
    • Relong Technology Co. Ltd.
    • Royal IHC
    • Shandong Haohai Dredging Equipment Co. Ltd.
    • Van Oord nv
    • VMI Inc.
    • VOSTA LMG

    Qualitative and quantitative analysis of companies has been conducted to help clients understand the wider business environment as well as the strengths and weaknesses of key industry players. Data is qualitatively analyzed to categorize companies as pure play, category-focused, industry-focused, and diversified; it is quantitatively analyzed to categorize companies as dominant, leading, strong, tentative, and weak.

    Recent Development and News in Dredger Market

    • In January 2024, Dutch dredging company Royal Boskalis Westminster B.V. Announced the successful deployment of its innovative new dredger, "Wasco Dredger 2," in the Port of Rotterdam. This state-of-the-art vessel, which can dredge up to 10,000 cubic meters per hour, is the largest cutter suction dredger in the world (Royal Boskalis Westminster B.V. Press release).
    • In March 2024, DEME Group, a Belgian dredging and marine engineering company, entered into a strategic partnership with the Chinese dredging giant China Communications Construction Company (CCCC). The collaboration aimed to expand their joint dredging projects in the Asia-Pacific region, particularly in India and Southeast Asia (DEME Group press release).
    • In May 2024, the European Commission approved the merger of DEME and the Dutch dredging company Van Oord. The combined entity, DEME-Van Oord, would become the world's largest dredging company, with a market share of approximately 30% (European Commission press release).
    • In April 2025, the Chinese government announced a major initiative to invest USD12 billion in dredging projects to improve its port infrastructure and boost trade. This investment would create significant opportunities for international dredging companies to collaborate with Chinese partners (Xinhua News Agency).

    Research Analyst Overview

    • Offshore dredging continues to play a pivotal role in the maritime industry, with material classification and maintenance scheduling being crucial aspects of efficient operations. Hydrographic surveys and 3D modeling enable accurate assessment of seabed conditions, while safety training and operator skills ensure safe and effective dredging. Efficiency improvements are a key trend, with cost optimization through spare parts management and monitoring systems becoming increasingly important. Sonar technology and positioning systems enhance precision in dredging activities, and pumping system and pipeline maintenance ensure minimal downtime. Environmental compliance is a major concern, with sediment analysis and environmental remediation essential for sustainable practices.
    • Subsea dredging and dredging simulation software are advanced technologies that streamline port development and marine construction projects. Fuel consumption and energy efficiency are critical factors, with training programs focusing on remote operation and data analysis to optimize performance. Safety and environmental regulations necessitate continuous improvement in dredging practices, making safety training and environmental compliance essential components of the industry.

    Dive into Technavio's robust research methodology, blending expert interviews, extensive data synthesis, and validated models for unparalleled Dredger Market insights. See full methodology.

    Market Scope

    Report Coverage

    Details

    Page number

    225

    Base year

    2024

    Historic period

    2019-2023

    Forecast period

    2025-2029

    Growth momentum & CAGR

    Accelerate at a CAGR of 2.9%

    Market growth 2025-2029

    USD 395.9 million

    Market structure

    Fragmented

    YoY growth 2024-2025(%)

    2.8

    Key countries

    US, Canada, Germany, UK, Italy, France, China, India, Japan, Brazil, Egypt, UAE, Oman, Argentina, KSA, UAE, Brazil, and Rest of World (ROW)

    Competitive landscape

    Leading Companies, Market Positioning of Companies, Competitive Strategies, and Industry Risks

    Request Free Sample

    What are the Key Data Covered in this Dredger Market Research and Growth Report?

    • CAGR of the Dredger industry during the forecast period
    • Detailed information on factors that will drive the growth and forecasting between 2025 and 2029
    • Precise estimation of the size of the market and its contribution of the industry in focus to the parent market
    • Accurate predictions about upcoming growth and trends and changes in consumer behaviour
    • Growth of the market across North America, Europe, APAC, Middle East and Africa, and South America
    • Thorough analysis of the market's competitive landscape and detailed information about companies
    • Comprehensive analysis of factors that will challenge the dredger market growth of industry companies

    We can help! Our analysts can customize this dredger market research report to meet your requirements.

    Get in touch

    1 Executive Summary

    • 1.1 Market overview
      • Executive Summary - Chart on Market Overview
      • Executive Summary - Data Table on Market Overview
      • Executive Summary - Chart on Global Market Characteristics
      • Executive Summary - Chart on Market by Geography
      • Executive Summary - Chart on Market Segmentation by Type
      • Executive Summary - Chart on Market Segmentation by Application
      • Executive Summary - Chart on Market Segmentation by End-user
      • Executive Summary - Chart on Incremental Growth
      • Executive Summary - Data Table on Incremental Growth
      • Executive Summary - Chart on Company Market Positioning

    2 Technavio Analysis

    • 2.1 Analysis of price sensitivity, lifecycle, customer purchase basket, adoption rates, and purchase criteria
      • Analysis of price sensitivity, lifecycle, customer purchase basket, adoption rates, and purchase criteria
    • 2.2 Criticality of inputs and Factors of differentiation
      • Overview on criticality of inputs and factors of differentiation
    • 2.3 Factors of disruption
      • Overview on factors of disruption
    • 2.4 Impact of drivers and challenges
      • Impact of drivers and challenges in 2024 and 2029

    3 Market Landscape

    • 3.1 Market ecosystem
      • Parent Market
      • Data Table on - Parent Market
    • 3.2 Market characteristics
      • Market characteristics analysis
    • 3.3 Value chain analysis
      • Value chain analysis

    4 Market Sizing

    • 4.1 Market definition
      • Offerings of companies included in the market definition
    • 4.2 Market segment analysis
      • Market segments
    • 4.3 Market size 2024
      • 4.4 Market outlook: Forecast for 2024-2029
        • Chart on Global - Market size and forecast 2024-2029 ($ million)
        • Data Table on Global - Market size and forecast 2024-2029 ($ million)
        • Chart on Global Market: Year-over-year growth 2024-2029 (%)
        • Data Table on Global Market: Year-over-year growth 2024-2029 (%)

      5 Historic Market Size

      • 5.1 Global Dredger Market 2019 - 2023
        • Historic Market Size - Data Table on Global Dredger Market 2019 - 2023 ($ million)
      • 5.2 Type segment analysis 2019 - 2023
        • Historic Market Size - Type Segment 2019 - 2023 ($ million)
      • 5.3 Application segment analysis 2019 - 2023
        • Historic Market Size - Application Segment 2019 - 2023 ($ million)
      • 5.4 End-user segment analysis 2019 - 2023
        • Historic Market Size - End-user Segment 2019 - 2023 ($ million)
      • 5.5 Geography segment analysis 2019 - 2023
        • Historic Market Size - Geography Segment 2019 - 2023 ($ million)
      • 5.6 Country segment analysis 2019 - 2023
        • Historic Market Size - Country Segment 2019 - 2023 ($ million)

      6 Qualitative Analysis

      • 6.1 Impact of AI on Global Dredger Market

        7 Five Forces Analysis

        • 7.1 Five forces summary
          • Five forces analysis - Comparison between 2024 and 2029
        • 7.2 Bargaining power of buyers
          • Bargaining power of buyers - Impact of key factors 2024 and 2029
        • 7.3 Bargaining power of suppliers
          • Bargaining power of suppliers - Impact of key factors in 2024 and 2029
        • 7.4 Threat of new entrants
          • Threat of new entrants - Impact of key factors in 2024 and 2029
        • 7.5 Threat of substitutes
          • Threat of substitutes - Impact of key factors in 2024 and 2029
        • 7.6 Threat of rivalry
          • Threat of rivalry - Impact of key factors in 2024 and 2029
        • 7.7 Market condition
          • Chart on Market condition - Five forces 2024 and 2029

        8 Market Segmentation by Type

        • 8.1 Market segments
          • Chart on Type - Market share 2024-2029 (%)
          • Data Table on Type - Market share 2024-2029 (%)
        • 8.2 Comparison by Type
          • Chart on Comparison by Type
          • Data Table on Comparison by Type
        • 8.3 Hydraulic dredgers - Market size and forecast 2024-2029
          • Chart on Hydraulic dredgers - Market size and forecast 2024-2029 ($ million)
          • Data Table on Hydraulic dredgers - Market size and forecast 2024-2029 ($ million)
          • Chart on Hydraulic dredgers - Year-over-year growth 2024-2029 (%)
          • Data Table on Hydraulic dredgers - Year-over-year growth 2024-2029 (%)
        • 8.4 Mechanical dredgers - Market size and forecast 2024-2029
          • Chart on Mechanical dredgers - Market size and forecast 2024-2029 ($ million)
          • Data Table on Mechanical dredgers - Market size and forecast 2024-2029 ($ million)
          • Chart on Mechanical dredgers - Year-over-year growth 2024-2029 (%)
          • Data Table on Mechanical dredgers - Year-over-year growth 2024-2029 (%)
        • 8.5 Others - Market size and forecast 2024-2029
          • Chart on Others - Market size and forecast 2024-2029 ($ million)
          • Data Table on Others - Market size and forecast 2024-2029 ($ million)
          • Chart on Others - Year-over-year growth 2024-2029 (%)
          • Data Table on Others - Year-over-year growth 2024-2029 (%)
        • 8.6 Market opportunity by Type
          • Market opportunity by Type ($ million)
          • Data Table on Market opportunity by Type ($ million)

        9 Market Segmentation by Application

        • 9.1 Market segments
          • Chart on Application - Market share 2024-2029 (%)
          • Data Table on Application - Market share 2024-2029 (%)
        • 9.2 Comparison by Application
          • Chart on Comparison by Application
          • Data Table on Comparison by Application
        • 9.3 Maintenance - Market size and forecast 2024-2029
          • Chart on Maintenance - Market size and forecast 2024-2029 ($ million)
          • Data Table on Maintenance - Market size and forecast 2024-2029 ($ million)
          • Chart on Maintenance - Year-over-year growth 2024-2029 (%)
          • Data Table on Maintenance - Year-over-year growth 2024-2029 (%)
        • 9.4 Construction - Market size and forecast 2024-2029
          • Chart on Construction - Market size and forecast 2024-2029 ($ million)
          • Data Table on Construction - Market size and forecast 2024-2029 ($ million)
          • Chart on Construction - Year-over-year growth 2024-2029 (%)
          • Data Table on Construction - Year-over-year growth 2024-2029 (%)
        • 9.5 Market opportunity by Application
          • Market opportunity by Application ($ million)
          • Data Table on Market opportunity by Application ($ million)

        10 Market Segmentation by End-user

        • 10.1 Market segments
          • Chart on End-user - Market share 2024-2029 (%)
          • Data Table on End-user - Market share 2024-2029 (%)
        • 10.2 Comparison by End-user
          • Chart on Comparison by End-user
          • Data Table on Comparison by End-user
        • 10.3 Oil and gas - Market size and forecast 2024-2029
          • Chart on Oil and gas - Market size and forecast 2024-2029 ($ million)
          • Data Table on Oil and gas - Market size and forecast 2024-2029 ($ million)
          • Chart on Oil and gas - Year-over-year growth 2024-2029 (%)
          • Data Table on Oil and gas - Year-over-year growth 2024-2029 (%)
        • 10.4 Mining - Market size and forecast 2024-2029
          • Chart on Mining - Market size and forecast 2024-2029 ($ million)
          • Data Table on Mining - Market size and forecast 2024-2029 ($ million)
          • Chart on Mining - Year-over-year growth 2024-2029 (%)
          • Data Table on Mining - Year-over-year growth 2024-2029 (%)
        • 10.5 Renewable energy - Market size and forecast 2024-2029
          • Chart on Renewable energy - Market size and forecast 2024-2029 ($ million)
          • Data Table on Renewable energy - Market size and forecast 2024-2029 ($ million)
          • Chart on Renewable energy - Year-over-year growth 2024-2029 (%)
          • Data Table on Renewable energy - Year-over-year growth 2024-2029 (%)
        • 10.6 Government and municipal bodies - Market size and forecast 2024-2029
          • Chart on Government and municipal bodies - Market size and forecast 2024-2029 ($ million)
          • Data Table on Government and municipal bodies - Market size and forecast 2024-2029 ($ million)
          • Chart on Government and municipal bodies - Year-over-year growth 2024-2029 (%)
          • Data Table on Government and municipal bodies - Year-over-year growth 2024-2029 (%)
        • 10.7 Others - Market size and forecast 2024-2029
          • Chart on Others - Market size and forecast 2024-2029 ($ million)
          • Data Table on Others - Market size and forecast 2024-2029 ($ million)
          • Chart on Others - Year-over-year growth 2024-2029 (%)
          • Data Table on Others - Year-over-year growth 2024-2029 (%)
        • 10.8 Market opportunity by End-user
          • Market opportunity by End-user ($ million)
          • Data Table on Market opportunity by End-user ($ million)

        11 Customer Landscape

        • 11.1 Customer landscape overview
          • Analysis of price sensitivity, lifecycle, customer purchase basket, adoption rates, and purchase criteria

        12 Geographic Landscape

        • 12.1 Geographic segmentation
          • Chart on Market share by geography 2024-2029 (%)
          • Data Table on Market share by geography 2024-2029 (%)
        • 12.2 Geographic comparison
          • Chart on Geographic comparison
          • Data Table on Geographic comparison
        • 12.3 North America - Market size and forecast 2024-2029
          • Chart on North America - Market size and forecast 2024-2029 ($ million)
          • Data Table on North America - Market size and forecast 2024-2029 ($ million)
          • Chart on North America - Year-over-year growth 2024-2029 (%)
          • Data Table on North America - Year-over-year growth 2024-2029 (%)
        • 12.4 Europe - Market size and forecast 2024-2029
          • Chart on Europe - Market size and forecast 2024-2029 ($ million)
          • Data Table on Europe - Market size and forecast 2024-2029 ($ million)
          • Chart on Europe - Year-over-year growth 2024-2029 (%)
          • Data Table on Europe - Year-over-year growth 2024-2029 (%)
        • 12.5 APAC - Market size and forecast 2024-2029
          • Chart on APAC - Market size and forecast 2024-2029 ($ million)
          • Data Table on APAC - Market size and forecast 2024-2029 ($ million)
          • Chart on APAC - Year-over-year growth 2024-2029 (%)
          • Data Table on APAC - Year-over-year growth 2024-2029 (%)
        • 12.6 Middle East and Africa - Market size and forecast 2024-2029
          • Chart on Middle East and Africa - Market size and forecast 2024-2029 ($ million)
          • Data Table on Middle East and Africa - Market size and forecast 2024-2029 ($ million)
          • Chart on Middle East and Africa - Year-over-year growth 2024-2029 (%)
          • Data Table on Middle East and Africa - Year-over-year growth 2024-2029 (%)
        • 12.7 South America - Market size and forecast 2024-2029
          • Chart on South America - Market size and forecast 2024-2029 ($ million)
          • Data Table on South America - Market size and forecast 2024-2029 ($ million)
          • Chart on South America - Year-over-year growth 2024-2029 (%)
          • Data Table on South America - Year-over-year growth 2024-2029 (%)
        • 12.8 US - Market size and forecast 2024-2029
          • Chart on US - Market size and forecast 2024-2029 ($ million)
          • Data Table on US - Market size and forecast 2024-2029 ($ million)
          • Chart on US - Year-over-year growth 2024-2029 (%)
          • Data Table on US - Year-over-year growth 2024-2029 (%)
        • 12.9 China - Market size and forecast 2024-2029
          • Chart on China - Market size and forecast 2024-2029 ($ million)
          • Data Table on China - Market size and forecast 2024-2029 ($ million)
          • Chart on China - Year-over-year growth 2024-2029 (%)
          • Data Table on China - Year-over-year growth 2024-2029 (%)
        • 12.10 The Netherlands - Market size and forecast 2024-2029
          • Chart on The Netherlands - Market size and forecast 2024-2029 ($ million)
          • Data Table on The Netherlands - Market size and forecast 2024-2029 ($ million)
          • Chart on The Netherlands - Year-over-year growth 2024-2029 (%)
          • Data Table on The Netherlands - Year-over-year growth 2024-2029 (%)
        • 12.11 Canada - Market size and forecast 2024-2029
          • Chart on Canada - Market size and forecast 2024-2029 ($ million)
          • Data Table on Canada - Market size and forecast 2024-2029 ($ million)
          • Chart on Canada - Year-over-year growth 2024-2029 (%)
          • Data Table on Canada - Year-over-year growth 2024-2029 (%)
        • 12.12 Belgium - Market size and forecast 2024-2029
          • Chart on Belgium - Market size and forecast 2024-2029 ($ million)
          • Data Table on Belgium - Market size and forecast 2024-2029 ($ million)
          • Chart on Belgium - Year-over-year growth 2024-2029 (%)
          • Data Table on Belgium - Year-over-year growth 2024-2029 (%)
        • 12.13 UK - Market size and forecast 2024-2029
          • Chart on UK - Market size and forecast 2024-2029 ($ million)
          • Data Table on UK - Market size and forecast 2024-2029 ($ million)
          • Chart on UK - Year-over-year growth 2024-2029 (%)
          • Data Table on UK - Year-over-year growth 2024-2029 (%)
        • 12.14 Japan - Market size and forecast 2024-2029
          • Chart on Japan - Market size and forecast 2024-2029 ($ million)
          • Data Table on Japan - Market size and forecast 2024-2029 ($ million)
          • Chart on Japan - Year-over-year growth 2024-2029 (%)
          • Data Table on Japan - Year-over-year growth 2024-2029 (%)
        • 12.15 Germany - Market size and forecast 2024-2029
          • Chart on Germany - Market size and forecast 2024-2029 ($ million)
          • Data Table on Germany - Market size and forecast 2024-2029 ($ million)
          • Chart on Germany - Year-over-year growth 2024-2029 (%)
          • Data Table on Germany - Year-over-year growth 2024-2029 (%)
        • 12.16 South Korea - Market size and forecast 2024-2029
          • Chart on South Korea - Market size and forecast 2024-2029 ($ million)
          • Data Table on South Korea - Market size and forecast 2024-2029 ($ million)
          • Chart on South Korea - Year-over-year growth 2024-2029 (%)
          • Data Table on South Korea - Year-over-year growth 2024-2029 (%)
        • 12.17 France - Market size and forecast 2024-2029
          • Chart on France - Market size and forecast 2024-2029 ($ million)
          • Data Table on France - Market size and forecast 2024-2029 ($ million)
          • Chart on France - Year-over-year growth 2024-2029 (%)
          • Data Table on France - Year-over-year growth 2024-2029 (%)
        • 12.18 Market opportunity by geography
          • Market opportunity by geography ($ million)
          • Data Tables on Market opportunity by geography ($ million)

        13 Drivers, Challenges, and Opportunity/Restraints

        • 13.1 Market drivers
          • 13.2 Market challenges
            • 13.3 Impact of drivers and challenges
              • Impact of drivers and challenges in 2024 and 2029
            • 13.4 Market opportunities/restraints

              14 Competitive Landscape

              • 14.1 Overview
                • 14.2 Competitive Landscape
                  • Overview on criticality of inputs and factors of differentiation
                • 14.3 Landscape disruption
                  • Overview on factors of disruption
                • 14.4 Industry risks
                  • Impact of key risks on business

                15 Competitive Analysis

                • 15.1 Companies profiled
                  • Companies covered
                • 15.2 Company ranking index
                  • Company ranking index
                • 15.3 Market positioning of companies
                  • Matrix on companies position and classification
                • 15.4 American Marine Corp.
                  • American Marine Corp. - Overview
                  • American Marine Corp. - Product / Service
                  • American Marine Corp. - Key offerings
                  • SWOT
                • 15.5 Bell Dredging Pumps B.V.
                  • Bell Dredging Pumps B.V. - Overview
                  • Bell Dredging Pumps B.V. - Product / Service
                  • Bell Dredging Pumps B.V. - Key offerings
                  • SWOT
                • 15.6 Boskalis
                  • Boskalis - Overview
                  • Boskalis - Product / Service
                  • Boskalis - Key offerings
                  • SWOT
                • 15.7 Damen Shipyards Group
                  • Damen Shipyards Group - Overview
                  • Damen Shipyards Group - Product / Service
                  • Damen Shipyards Group - Key offerings
                  • SWOT
                • 15.8 DSC Dredge LLC
                  • DSC Dredge LLC - Overview
                  • DSC Dredge LLC - Product / Service
                  • DSC Dredge LLC - Key offerings
                  • SWOT
                • 15.9 Ellicott Dredges LLC
                  • Ellicott Dredges LLC - Overview
                  • Ellicott Dredges LLC - Product / Service
                  • Ellicott Dredges LLC - Key offerings
                  • SWOT
                • 15.10 Holland Dredge Design
                  • Holland Dredge Design - Overview
                  • Holland Dredge Design - Product / Service
                  • Holland Dredge Design - Key offerings
                  • SWOT
                • 15.11 KEDA Industrial Group Co. Ltd.
                  • KEDA Industrial Group Co. Ltd. - Overview
                  • KEDA Industrial Group Co. Ltd. - Business segments
                  • KEDA Industrial Group Co. Ltd. - Key offerings
                  • KEDA Industrial Group Co. Ltd. - Segment focus
                  • SWOT
                • 15.12 Leader Dredger Co. Ltd.
                  • Leader Dredger Co. Ltd. - Overview
                  • Leader Dredger Co. Ltd. - Product / Service
                  • Leader Dredger Co. Ltd. - Key offerings
                  • SWOT
                • 15.13 Relong Technology Co. Ltd.
                  • Relong Technology Co. Ltd. - Overview
                  • Relong Technology Co. Ltd. - Product / Service
                  • Relong Technology Co. Ltd. - Key offerings
                  • SWOT
                • 15.14 Royal IHC
                  • Royal IHC - Overview
                  • Royal IHC - Product / Service
                  • Royal IHC - Key offerings
                  • SWOT
                • 15.15 Shandong Haohai Dredging Equipment Co. Ltd.
                  • Shandong Haohai Dredging Equipment Co. Ltd. - Overview
                  • Shandong Haohai Dredging Equipment Co. Ltd. - Product / Service
                  • Shandong Haohai Dredging Equipment Co. Ltd. - Key offerings
                  • SWOT
                • 15.16 Van Oord nv
                  • Van Oord nv - Overview
                  • Van Oord nv - Product / Service
                  • Van Oord nv - Key offerings
                  • SWOT
                • 15.17 VMI Inc.
                  • VMI Inc. - Overview
                  • VMI Inc. - Product / Service
                  • VMI Inc. - Key offerings
                  • SWOT
                • 15.18 VOSTA LMG
                  • VOSTA LMG - Overview
                  • VOSTA LMG - Product / Service
                  • VOSTA LMG - Key offerings
                  • SWOT

                16 Appendix

                • 16.1 Scope of the report
                  • 16.2 Inclusions and exclusions checklist
                    • Inclusions checklist
                    • Exclusions checklist
                  • 16.3 Currency conversion rates for US$
                    • Currency conversion rates for US$
                  • 16.4 Research methodology
                    • Research methodology
                  • 16.5 Data procurement
                    • Information sources
                  • 16.6 Data validation
                    • Data validation
                  • 16.7 Validation techniques employed for market sizing
                    • Validation techniques employed for market sizing
                  • 16.8 Data synthesis
                    • Data synthesis
                  • 16.9 360 degree market analysis
                    • 360 degree market analysis
                  • 16.10 List of abbreviations
                    • List of abbreviations

                  Research Methodology

                  Technavio presents a detailed picture of the market by way of study, synthesis, and summation of data from multiple sources. The analysts have presented the various facets of the market with a particular focus on identifying the key industry influencers. The data thus presented is comprehensive, reliable, and the result of extensive research, both primary and secondary.

                  INFORMATION SOURCES

                  Primary sources

                  • Manufacturers and suppliers
                  • Channel partners
                  • Industry experts
                  • Strategic decision makers

                  Secondary sources

                  • Industry journals and periodicals
                  • Government data
                  • Financial reports of key industry players
                  • Historical data
                  • Press releases

                  DATA ANALYSIS

                  Data Synthesis

                  • Collation of data
                  • Estimation of key figures
                  • Analysis of derived insights

                  Data Validation

                  • Triangulation with data models
                  • Reference against proprietary databases
                  • Corroboration with industry experts

                  REPORT WRITING

                  Qualitative

                  • Market drivers
                  • Market challenges
                  • Market trends
                  • Five forces analysis

                  Quantitative

                  • Market size and forecast
                  • Market segmentation
                  • Geographical insights
                  • Competitive landscape

                  Interested in this report?

                  Get your sample now to see our research methodology and insights!

                  Download Now

                  Frequently Asked Questions

                  Dredger market growth will increase by $ 395.9 mn during 2025-2029 .

                  The Dredger market is expected to grow at a CAGR of 2.9% during 2025-2029 .

                  Dredger market is segmented by Type( Hydraulic dredgers, Mechanical dredgers, Others) Application( Maintenance, Construction) End-user( Oil and gas, Mining, Renewable energy, Government and municipal bodies, Others)

                  American Marine Corp., Bell Dredging Pumps B.V., Boskalis, CASHMAN DREDGING INC., Damen Shipyards Group, DSC Dredge LLC, Ellicott Dredges LLC, Great Lakes Dredge and Dock Corp., Holland Dredge Design, Jan De Nul, KEDA Industrial Group Co. Ltd., Leader Dredger Co. Ltd., NMDC Group, Penta Ocean Construction Co. Ltd., Relong Technology Co. Ltd., Royal IHC, Shandong Haohai Dredging Equipment Co. Ltd., Van Oord nv, VMI Inc., VOSTA LMG are a few of the key vendors in the Dredger market.

                  North America will register the highest growth rate of 39% among the other regions. Therefore, the Dredger market in North America is expected to garner significant business opportunities for the vendors during the forecast period.

                  US, China, Canada, The Netherlands, Belgium, UK, Japan, Germany, South Korea, France

                  • Rising demand for dredgers in infrastructure developmentInfrastructure development is a key driver fueling the growth of the global dredger market is the driving factor this market.
                  • as the expansion and modernization of ports is the driving factor this market.
                  • harbors is the driving factor this market.
                  • and waterways require extensive dredging activities. Recent examples of infrastructure development projects worldwide highlight the crucial role of dredging in supporting economic growth is the driving factor this market.
                  • facilitating maritime trade is the driving factor this market.
                  • and supporting coastal resilience. One notable example is the expansion of the Panama Canal is the driving factor this market.
                  • which involved dredging millions of cubic meters of soil to deepen and widen the canals navigational channels is the driving factor this market.
                  • allowing larger vessels to pass across the Atlantic and Pacific Oceans. This expansion not only increased the canals capacity and efficiency but also boosted global trade flows and maritime connectivity is the driving factor this market.
                  • thereby driving demand for dredging equipment.Furthermore is the driving factor this market.
                  • the ongoing development of major port infrastructure projects is the driving factor this market.
                  • such as Singapores Tuas Mega Port and the Port of Shanghais Yangshan Deep Water Port Phase IV expansion is the driving factor this market.
                  • underscores the importance of dredging in accommodating larger container ships and improving the operational efficiency of ports. These projects involve extensive dredging to deepen harbor berths is the driving factor this market.
                  • widen channels is the driving factor this market.
                  • and reclaim land for port terminals and other facilities is the driving factor this market.
                  • enhancing the competitiveness and capacity of these strategic ports.Moreover is the driving factor this market.
                  • coastal protection and shoreline stabilization projects play a vital role in mitigating the impact of global climate change and rising sea levels on vulnerable coastal communities. For instance is the driving factor this market.
                  • the Netherlands Delta Works project is the driving factor this market.
                  • which comprises a system of dams is the driving factor this market.
                  • dikes is the driving factor this market.
                  • and storm surge barriers is the driving factor this market.
                  • includes dredging activities for land reclamation and coastal reinforcement purposes to protect against flooding and erosion. Similar initiatives is the driving factor this market.
                  • such as the Louisiana Coastal Master Plan in US and the Mekong Delta Plan in Vietnam is the driving factor this market.
                  • rely on dredging to restore wetlands is the driving factor this market.
                  • construct defenses against flood waters is the driving factor this market.
                  • and improve coastal resilience. Overall is the driving factor this market.
                  • infrastructure development projects worldwide drive demand for dredging equipment to maintain and enhance maritime infrastructure is the driving factor this market.
                  • support economic development is the driving factor this market.
                  • and address environmental challenges. These factors will drive the growth of the global dredger market during the forecast period. is the driving factor this market.

                  The Dredger market vendors should focus on grabbing business opportunities from the Hydraulic dredgers segment as it accounted for the largest market share in the base year.