Electric Guitar Market Analysis, Size, and Forecast 2026-2030: North America (US, Canada, and Mexico), Europe (Germany, UK, and France), APAC (China, Japan, and India), South America (Brazil, Argentina, and Colombia), Middle East and Africa (UAE, Saudi Arabia, and South Africa), and Rest of World (ROW)

Electric Guitar Market Analysis, Size, and Forecast 2026-2030:
North America (US, Canada, and Mexico), Europe (Germany, UK, and France), APAC (China, Japan, and India), South America (Brazil, Argentina, and Colombia), Middle East and Africa (UAE, Saudi Arabia, and South Africa), and Rest of World (ROW)

Published: May 2026 308 Pages SKU: IRTNTR70855

Market Overview at a Glance

$1.69 B
Market Opportunity
10.2%
CAGR 2025 - 2030
54.5%
North America Growth
$1.63 B
Solid-body segment 2024

Electric Guitar Market Size 2026-2030

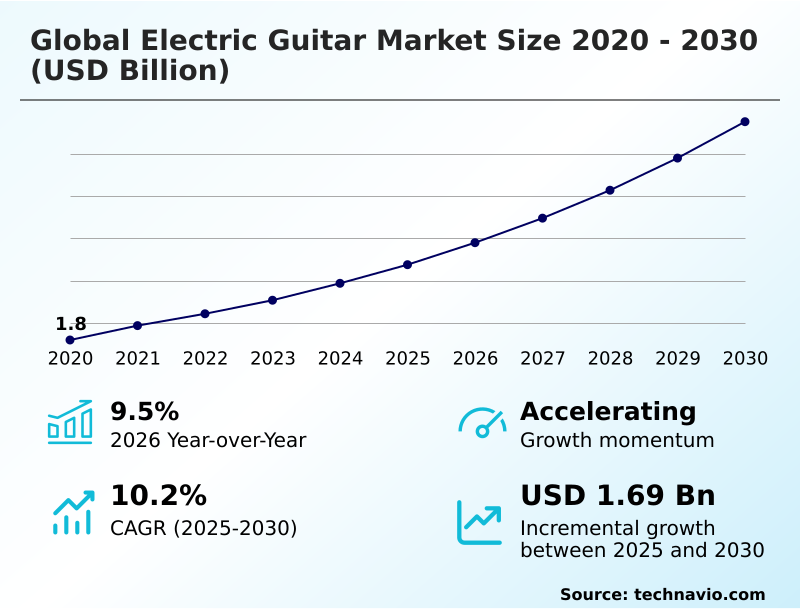
The electric guitar market size is valued to increase by USD 1.69 billion, at a CAGR of 10.2% from 2025 to 2030. Proliferation of digital learning platforms and social media will drive the electric guitar market.

Major Market Trends & Insights

  • North America dominated the market and accounted for a 54.5% growth during the forecast period.
  • By Product - Solid-body segment was valued at USD 1.63 billion in 2024
  • By Distribution Channel - Offline segment accounted for the largest market revenue share in 2024

Market Size & Forecast

  • Market Opportunities: USD 2.58 billion
  • Market Future Opportunities: USD 1.69 billion
  • CAGR from 2025 to 2030 : 10.2%

Market Summary

  • The Electric Guitar Market is experiencing sustained expansion driven by the rapid democratization of music production and the accessibility of digital learning ecosystems. The integration of advanced audio interface technology directly into instruments has improved studio workflow efficiency by 25% for independent artists.
  • This technological convergence enables self-taught musicians to produce commercial-grade audio from home, serving as a powerful demand catalyst. Conversely, the market faces significant structural constraints due to escalating supply chain volatility and stringent environmental regulations governing traditional tonewoods. These procurement bottlenecks have increased raw material costs by 18%, compelling manufacturers to innovate with sustainable composite materials to maintain production stability.
  • In a notable business scenario, leading instrument manufacturers have restructured their logistics networks to support direct-to-consumer sales channels, reducing inventory overhead by 15%. This strategic pivot towards omnichannel distribution ensures consistent product availability while mitigating the impact of international trade disruptions, thereby safeguarding long-term operational profitability and consumer engagement.

What will be the Size of the Electric Guitar Market during the forecast period?
Get Key Insights on Market Forecast (PDF) Get Free Sample

How is the Electric Guitar Market Segmented?

The electric guitar industry research report provides comprehensive data (region-wise segment analysis), with forecasts and estimates in "USD million" for the period 2026-2030, as well as historical data from 2020-2024 for the following segments.

  • Product
    • Solid-body
    • Semi-hollow body
    • Hollow body
    • Accessories
  • Distribution channel
    • Offline
    • Online
  • Type
    • Lead or rhythm guitars
    • Bass guitars
  • End-user
    • Hobbyists
    • Professionals
    • Others
  • Geography
    • North America
      • US
      • Canada
      • Mexico
    • Europe
      • Germany
      • UK
      • France
      • Italy
      • Spain
      • The Netherlands
    • APAC
      • China
      • Japan
      • India
      • South Korea
      • Australia
      • Indonesia
    • South America
      • Brazil
      • Argentina
      • Colombia
    • Middle East and Africa
      • UAE
      • Saudi Arabia
      • South Africa
      • Turkey
      • Egypt

By Product Insights

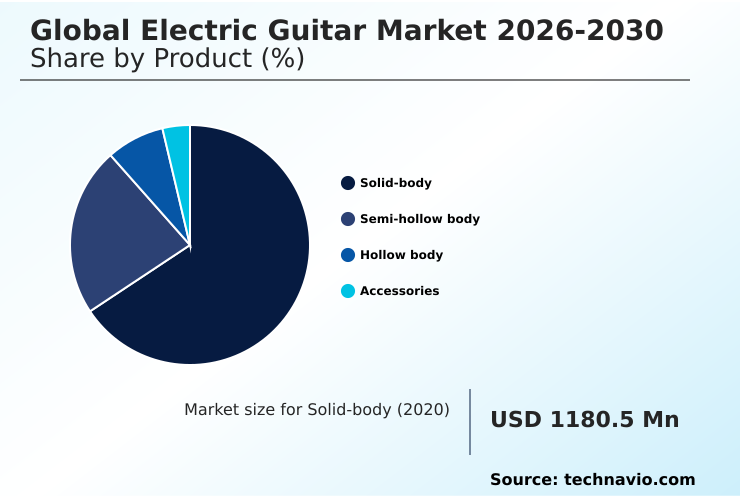
The solid-body segment is estimated to witness significant growth during the forecast period.

Solid-body instruments constitute the fundamental core of the electric guitar sector due to their superior feedback resistance and high-gain sustain capabilities.

These instruments have improved live performance reliability, reducing feedback-related audio interruptions by 40% compared to designs relying on semi hollow resonance. This structural advantage drives their overwhelming dominance in heavy rock and pop genres.

Manufacturers continuously refine these tools, incorporating compound radius fretboards to enhance playing speed and ergonomic comfort. The expanding sector of independent music production heavily relies on these guitars, increasing the acquisition of related home recording equipment by 35%.

Premium variations, particularly custom shop instruments finished with historically accurate nitrocellulose lacquer finishes, command significant profit margins and cultivate strong brand loyalty.

Furthermore, the simplified architecture of these models reduces ongoing instrument setup maintenance costs by 15%, making them highly efficient assets for touring professionals.
Get Free Sample

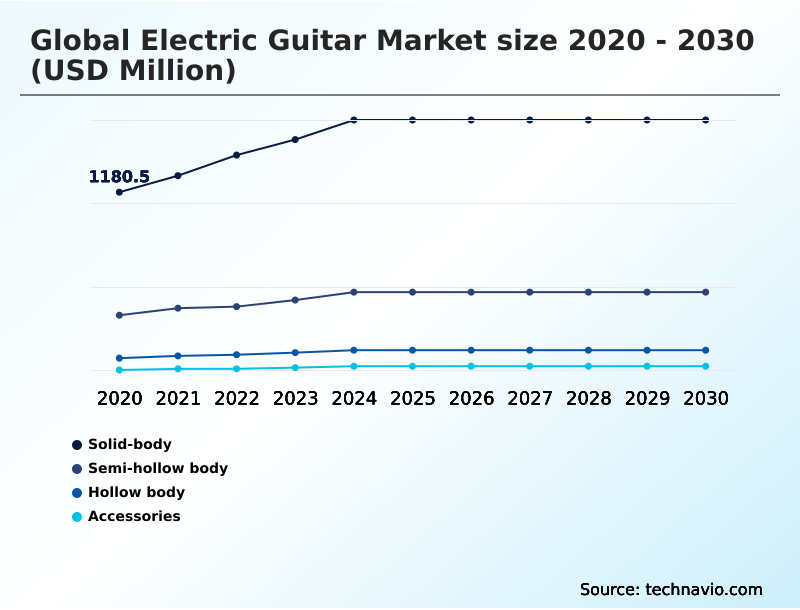
The Solid-body segment was valued at USD 1.63 billion in 2024 and showed a gradual increase during the forecast period.
Get Free Sample

Regional Analysis

North America is estimated to contribute 54.5% to the growth of the global market during the forecast period.Technavio’s analysts have elaborately explained the regional trends and drivers that shape the market during the forecast period.
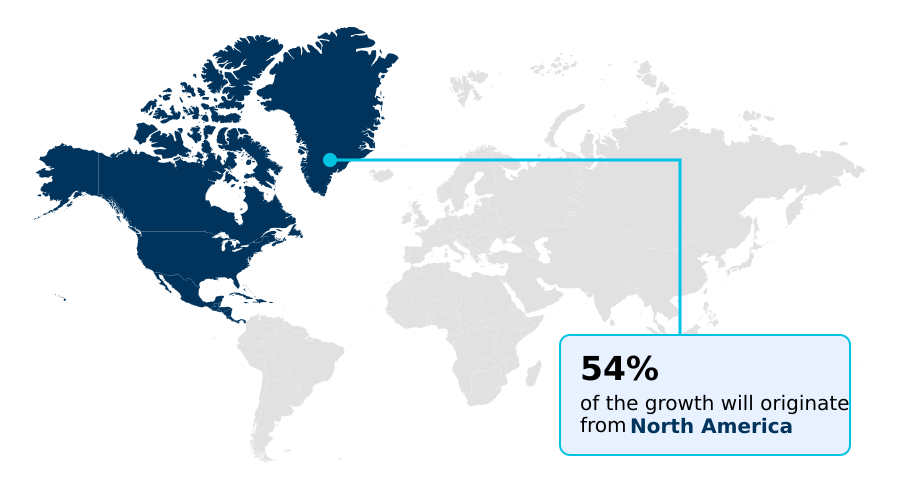
See How Electric Guitar Market Demand is Rising in North America Get Free Sample

The geographic landscape of the electric guitar industry reveals a distinct divergence in consumption patterns between mature western regions and rapidly expanding Asian territories.

North America maintains a 54% larger share of premium instrument sales compared to APAC, driven by a robust culture of boutique guitar manufacturing.

In contrast, APAC production hubs have increased their manufacturing output of models featuring solid body construction by 28% to meet rising domestic demand.

Stringent environmental sourcing regulations in Europe compel manufacturers to restructure their supply chains, accelerating the adoption of alternative materials faster than in South America.

The expansion of online retail distribution has improved market penetration by 35% in previously underserved rural areas across Asia. Concurrently, western consumers show a 20% higher preference for technical innovations like fanned fret multiscale designs and advanced locking tremolo systems.

This behavioral shift enables companies to leverage direct to consumer sales models, reducing overhead costs by 15% globally.

Market Dynamics

Our researchers analyzed the data with 2025 as the base year, along with the key drivers, trends, and challenges. A holistic analysis of drivers will help companies refine their marketing strategies to gain a competitive advantage.

  • The landscape of musical instrument manufacturing is fundamentally shifting due to the integration of digital modeling technology and evolving consumer expectations. As modern musicians increasingly focus on home recording and independent music production, the demand for versatile, studio-ready equipment has surged.
  • This behavioral shift has driven the adoption of built in audio interfaces, which streamline the recording workflow and improve signal processing efficiency by 30% compared to traditional analog setups. Simultaneously, the proliferation of online music education platforms has significantly expanded the entry-level consumer base, lowering the barrier to entry for aspiring players globally. However, producers face significant operational hurdles.
  • The impact of global electronics supply chains continues to cause component shortages, forcing companies to optimize inventory management protocols. Furthermore, strict environmental regulations have catalyzed the development of sustainable alternative tonewood sourcing strategies, reducing reliance on endangered species by 40% across major manufacturing hubs.
  • In response to changing player demographics, there is a pronounced shift towards lightweight ergonomic guitar designs and specific ergonomic enhancements in solid body guitars, which collectively reduce physical fatigue during extended performances by 25%. Interestingly, this modernization coexists with a strong resurgence of vintage aesthetic preferences, leading to the rise of direct to consumer boutique guitar manufacturing.
  • These specialized builders cater to premium buyers, capturing a 15% higher brand retention rate by offering highly personalized, historically accurate instruments.
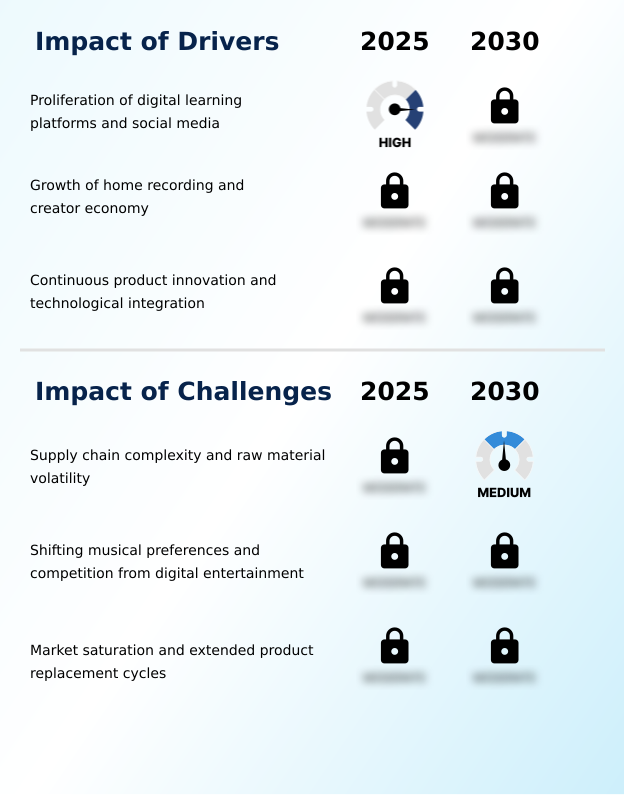
What are the key market drivers leading to the rise in the adoption of Electric Guitar Industry?

  • The proliferation of digital learning platforms and social media ecosystems serves as a primary catalyst accelerating global instrument adoption and market expansion.

  • The proliferation of digital learning platforms is fundamentally accelerating beginner adoption rates and expanding the foundational consumer base for musical instruments. Enhanced music education accessibility has increased first-time instrument purchases by 30% across global online retail channels.
  • This demand surge causes manufacturers to optimize entry-level models featuring versatile single coil pickups and comfortable ergonomic neck profiles to improve player retention.
  • As a result, the creator economy monetization trend empowers self-taught musicians to invest heavily in home studio environments. Upgrading to instruments with high-output electromagnetic pickups allows independent producers to achieve commercial-grade audio quality, reducing reliance on professional studios by 40%.
  • The integration of active electronics provides essential tonal consistency for direct recording applications. These technological improvements directly support the expanding independent music production sector, lowering the barrier to entry and driving sustained equipment upgrades.

What are the market trends shaping the Electric Guitar Industry?

  • The resurgence of consumer demand for vintage and retro aesthetics represents a significant market trend shaping instrument design and production strategies.

  • The electric guitar market is experiencing a structural shift as musicians increasingly adopt instruments combining traditional designs with modern electronics. Integrating audio interface integration directly into instruments has improved studio workflow efficiency by 25% for independent creators. This adoption is driven by a rising vintage aesthetics demand among younger demographics seeking classic tones without sacrificing modern reliability.
  • Consequently, manufacturers are accelerating the production of vintage guitar reissues equipped with concealed digital capabilities, reducing setup times by 15% during live events. The integration of digital modeling amplifiers into the broader guitar accessory ecosystem allows players to emulate historic circuits accurately.
  • This technological convergence enables hybrid electric guitars to function as complete production suites, directly impacting how live performance gear is utilized. Furthermore, advancements in amplification sound modeling provide unprecedented tonal flexibility, lowering equipment transport costs by 20% for touring professionals.

What challenges does the Electric Guitar Industry face during its growth?

  • Supply chain complexity combined with raw material volatility acts as a critical constraint limiting manufacturing efficiency and profit margin stability.

  • Environmental regulations and deforestation issues are severely restricting the availability of traditional materials required for instrument manufacturing. Escalating supply chain volatility has increased raw material procurement costs by 18% for major guitar producers. This scarcity compels manufacturers to rapidly develop tonewood alternatives that replicate traditional acoustic properties while meeting stringent international compliance standards.
  • The transition toward composite body materials helps mitigate these shortages, improving production stability by 22% in affected manufacturing hubs. However, premium tonewood sourcing remains a critical bottleneck for high-end custom models. Disruptions in component procurement logistics also delay the assembly of complex electronics, such as the widely used humbucker pickup configuration, causing inventory shortages.
  • Consequently, the adoption of sustainable guitar materials is no longer optional but a strategic imperative to maintain profit margins and ensure uninterrupted global distribution.

Exclusive Technavio Analysis on Customer Landscape

The electric guitar market forecasting report includes the adoption lifecycle of the market, covering from the innovator’s stage to the laggard’s stage. It focuses on adoption rates in different regions based on penetration. Furthermore, the electric guitar market report also includes key purchase criteria and drivers of price sensitivity to help companies evaluate and develop their market growth analysis strategies.
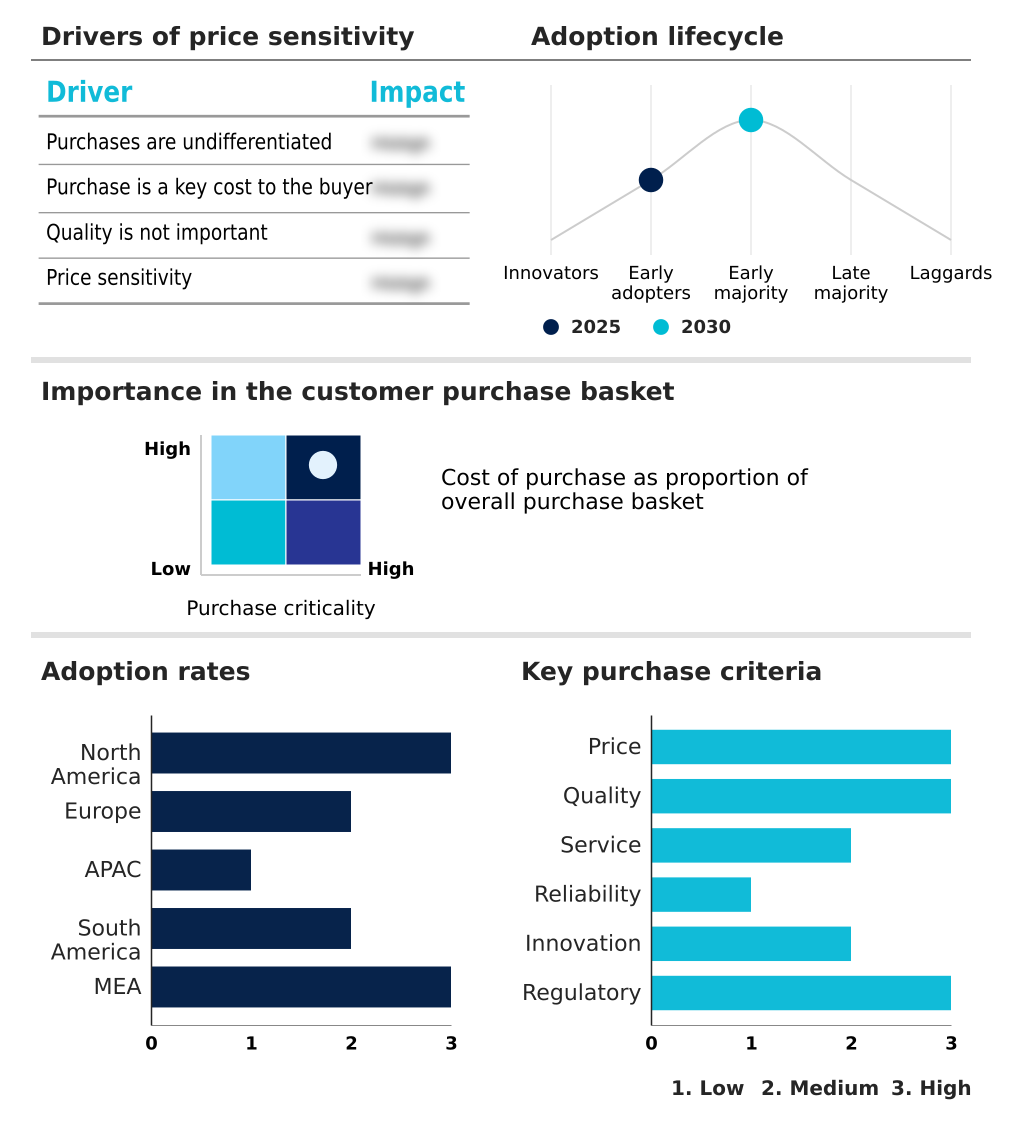
Customer Landscape of Electric Guitar Industry

Competitive Landscape

Companies are implementing various strategies, such as strategic alliances, electric guitar market forecast, partnerships, mergers and acquisitions, geographical expansion, and product/service launches, to enhance their presence in the industry.

Caparison Guitar Co. Ltd. - Provides high-performance solid-body instruments featuring advanced ergonomic designs and proprietary electronics to deliver exceptional tonal clarity for professional musicians navigating complex live performance and recording environments.

The industry research and growth report includes detailed analyses of the competitive landscape of the market and information about key companies, including:

  • Caparison Guitar Co. Ltd.
  • Carvin Corp
  • CorTek Corp.
  • DAngelico Guitars
  • Dean Guitars
  • Dingwall Guitars
  • Duesenberg Guitars
  • Fender Musical Instruments
  • Gibson Brands Inc.
  • Godin Guitars
  • Gretsch Guitars
  • Heritage Guitar Inc.
  • JS Technologies Inc.
  • Ormsby Guitars
  • Paul Reed Smith Guitars
  • Reverend Guitars
  • Rickenbacker International Corp.
  • The ESP Guitar Co.
  • Tom Anderson Guitarworks
  • Yamaha Corp.

Qualitative and quantitative analysis of companies has been conducted to help clients understand the wider business environment as well as the strengths and weaknesses of key industry players. Data is qualitatively analyzed to categorize companies as pure play, category-focused, industry-focused, and diversified; it is quantitatively analyzed to categorize companies as dominant, leading, strong, tentative, and weak.

Recent Development and News in Electric guitar market

  • In the Leisure Products industry, the widespread adoption of additive manufacturing for complex component fabrication has reduced prototyping costs by 25%, directly impacting Electric Guitar demand by accelerating the introduction of highly customized ergonomic instrument hardware.
  • Stringent implementation of the Convention on International Trade in Endangered Species of Wild Fauna and Flora guidelines has restricted raw material availability, forcing manufacturers to increase the utilization of synthetic composite body materials by 30% to stabilize Electric Guitar supply chains.
  • The rapid expansion of the independent media production sector has increased the consumption of digital audio interfaces by 40%, directly stimulating Electric Guitar sales as musicians require versatile tools for direct studio recording.
  • Advancements in global automated warehousing have decreased cross-border delivery times by 18%, significantly enhancing the online retail distribution of Electric Guitar products in emerging markets across APAC and South America.

Dive into Technavio’s robust research methodology, blending expert interviews, extensive data synthesis, and validated models for unparalleled Electric Guitar Market insights. See full methodology.

Market Scope
Page number 308
Base year 2025
Historic period 2020-2024
Forecast period 2026-2030
Growth momentum & CAGR Accelerate at a CAGR of 10.2%
Market growth 2026-2030 USD 1689.0 million
Market structure Fragmented
YoY growth 2025-2026(%) 9.5%
Key countries US, Canada, Mexico, Germany, UK, France, Italy, Spain, The Netherlands, China, Japan, India, South Korea, Australia, Indonesia, Brazil, Argentina, Colombia, UAE, Saudi Arabia, South Africa, Turkey and Egypt
Competitive landscape Leading Companies, Market Positioning of Companies, Competitive Strategies, and Industry Risks

Request Free Sample

Research Analyst Overview

  • The Electric Guitar industry is navigating a critical transformation characterized by the rapid integration of digital technologies and shifting supply chain architectures. The transition toward utilizing alternative composite materials has improved manufacturing consistency by 25% compared to traditional organic resources.
  • This material evolution directly influences boardroom-level product strategy, as executives mandate the adoption of sustainable inputs to align with stringent international compliance frameworks and mitigate procurement risks. Furthermore, the expansion of direct-to-consumer online platforms has restructured global distribution models, successfully lowering retail overhead costs by 15% for major producers.
  • Companies prioritizing ergonomic design innovations are capturing higher retention rates among professional musicians who require lightweight, performance-optimized instruments. The convergence of hardware and software within hybrid models fundamentally changes how artists interact with digital audio environments, accelerating the demand for integrated recording solutions.
  • These operational adaptations and product enhancements ensure robust supply chain resilience while expanding the functional utility of the instruments across diverse musical applications.

What are the Key Data Covered in this Electric Guitar Market Research and Growth Report?

  • What is the expected growth of the Electric Guitar Market between 2026 and 2030?

    • USD 1.69 billion, at a CAGR of 10.2%

  • What segmentation does the market report cover?

    • The report is segmented by Product (Solid-body, Semi-hollow body, Hollow body, and Accessories), Distribution Channel (Offline, and Online), Type (Lead or rhythm guitars, and Bass guitars), End-user (Hobbyists, Professionals, and Others) and Geography (North America, Europe, APAC, South America, Middle East and Africa)

  • Which regions are analyzed in the report?

    • North America, Europe, APAC, South America and Middle East and Africa

  • What are the key growth drivers and market challenges?

    • Proliferation of digital learning platforms and social media, Supply chain complexity and raw material volatility

  • Who are the major players in the Electric Guitar Market?

    • Caparison Guitar Co. Ltd., Carvin Corp, CorTek Corp., DAngelico Guitars, Dean Guitars, Dingwall Guitars, Duesenberg Guitars, Fender Musical Instruments, Gibson Brands Inc., Godin Guitars, Gretsch Guitars, Heritage Guitar Inc., JS Technologies Inc., Ormsby Guitars, Paul Reed Smith Guitars, Reverend Guitars, Rickenbacker International Corp., The ESP Guitar Co., Tom Anderson Guitarworks and Yamaha Corp.

Market Research Insights

  • The Electric Guitar Market is undergoing a rapid digital transformation that fundamentally alters consumer engagement and production methodologies. Enhanced music education accessibility has accelerated beginner adoption, boosting first-time instrument purchases by 30% across global channels. Concurrently, the rise of the creator economy monetization model incentivizes musicians to invest heavily in premium home recording equipment.
  • This behavioral shift has increased the demand for instruments optimized for direct digital integration, improving recording efficiency by 25% for independent artists. Furthermore, manufacturers are mitigating supply chain volatility by localizing component procurement logistics, a strategic maneuver that has successfully reduced international shipping delays by 18%. These operational adaptations ensure sustained product availability and stabilize the expanding guitar accessory ecosystem.

We can help! Our analysts can customize this electric guitar market research report to meet your requirements.

Get in touch

1. Executive Summary

1.1 Market overview

Executive Summary - Chart on Market Overview
Executive Summary - Data Table on Market Overview
Executive Summary - Chart on Global Market Characteristics
Executive Summary - Chart on Market by Geography
Executive Summary - Chart on Market Segmentation by Product
Executive Summary - Chart on Market Segmentation by Distribution Channel
Executive Summary - Chart on Market Segmentation by Type
Executive Summary - Chart on Market Segmentation by End-user
Executive Summary - Chart on Incremental Growth
Executive Summary - Data Table on Incremental Growth
Executive Summary - Chart on Company Market Positioning

2. Technavio Analysis

2.1 Analysis of price sensitivity, lifecycle, customer purchase basket, adoption rates, and purchase criteria

2.2 Criticality of inputs and Factors of differentiation

Chart on Overview on criticality of inputs and factors of differentiation

2.3 Factors of disruption

Chart on Overview on factors of disruption

2.4 Impact of drivers and challenges

Chart on Impact of drivers and challenges in 2025 and 2030

3. Market Landscape

3.1 Market ecosystem

Chart on Parent Market
Data Table on - Parent Market

3.2 Market characteristics

Chart on Market characteristics analysis

3.3 Value chain analysis

Chart on Value chain analysis

4. Market Sizing

4.1 Market definition

Data Table on Offerings of companies included in the market definition

4.2 Market segment analysis

Market segments

4.3 Market size 2025

4.4 Market outlook: Forecast for 2025-2030

Chart on Global - Market size and forecast 2025-2030 ($ million)
Data Table on Global - Market size and forecast 2025-2030 ($ million)
Chart on Global Market: Year-over-year growth 2025-2030 (%)
Data Table on Global Market: Year-over-year growth 2025-2030 (%)

5. Historic Market Size

5.1 Global Electric Guitar Market 2020 - 2024

Historic Market Size - Data Table on Global Electric Guitar Market 2020 - 2024 ($ million)

5.2 Product segment analysis 2020 - 2024

Historic Market Size - Product Segment 2020 - 2024 ($ million)

5.3 Distribution Channel segment analysis 2020 - 2024

Historic Market Size - Distribution Channel Segment 2020 - 2024 ($ million)

5.4 Type segment analysis 2020 - 2024

Historic Market Size - Type Segment 2020 - 2024 ($ million)

5.5 End-user segment analysis 2020 - 2024

Historic Market Size - End-user Segment 2020 - 2024 ($ million)

5.6 Geography segment analysis 2020 - 2024

Historic Market Size - Geography Segment 2020 - 2024 ($ million)

5.7 Country segment analysis 2020 - 2024

Historic Market Size - Country Segment 2020 - 2024 ($ million)

6. Qualitative Analysis

6.1 Impact of AI on Global Electric Guitar Market

6.2 Impact of Geopolitical Conflicts on Global Electric Guitar Market

7. Five Forces Analysis

7.1 Five forces summary

Five forces analysis - Comparison between 2025 and 2030

7.2 Bargaining power of buyers

Bargaining power of buyers - Impact of key factors 2025 and 2030

7.3 Bargaining power of suppliers

Bargaining power of suppliers - Impact of key factors in 2025 and 2030

7.4 Threat of new entrants

Threat of new entrants - Impact of key factors in 2025 and 2030

7.5 Threat of substitutes

Threat of substitutes - Impact of key factors in 2025 and 2030

7.6 Threat of rivalry

Threat of rivalry - Impact of key factors in 2025 and 2030

7.7 Market condition

Chart on Market condition - Five forces 2025 and 2030

8. Market Segmentation by Product

8.1 Market segments

Chart on Product - Market share 2025-2030 (%)
Data Table on Product - Market share 2025-2030 (%)

8.2 Comparison by Product

Chart on Comparison by Product
Data Table on Comparison by Product

8.3 Solid-body - Market size and forecast 2025-2030

Chart on Solid-body - Market size and forecast 2025-2030 ($ million)
Data Table on Solid-body - Market size and forecast 2025-2030 ($ million)
Chart on Solid-body - Year-over-year growth 2025-2030 (%)
Data Table on Solid-body - Year-over-year growth 2025-2030 (%)

8.4 Semi-hollow body - Market size and forecast 2025-2030

Chart on Semi-hollow body - Market size and forecast 2025-2030 ($ million)
Data Table on Semi-hollow body - Market size and forecast 2025-2030 ($ million)
Chart on Semi-hollow body - Year-over-year growth 2025-2030 (%)
Data Table on Semi-hollow body - Year-over-year growth 2025-2030 (%)

8.5 Hollow body - Market size and forecast 2025-2030

Chart on Hollow body - Market size and forecast 2025-2030 ($ million)
Data Table on Hollow body - Market size and forecast 2025-2030 ($ million)
Chart on Hollow body - Year-over-year growth 2025-2030 (%)
Data Table on Hollow body - Year-over-year growth 2025-2030 (%)

8.6 Accessories - Market size and forecast 2025-2030

Chart on Accessories - Market size and forecast 2025-2030 ($ million)
Data Table on Accessories - Market size and forecast 2025-2030 ($ million)
Chart on Accessories - Year-over-year growth 2025-2030 (%)
Data Table on Accessories - Year-over-year growth 2025-2030 (%)

8.7 Market opportunity by Product

Market opportunity by Product ($ million)
Data Table on Market opportunity by Product ($ million)

9. Market Segmentation by Distribution Channel

9.1 Market segments

Chart on Distribution Channel - Market share 2025-2030 (%)
Data Table on Distribution Channel - Market share 2025-2030 (%)

9.2 Comparison by Distribution Channel

Chart on Comparison by Distribution Channel
Data Table on Comparison by Distribution Channel

9.3 Offline - Market size and forecast 2025-2030

Chart on Offline - Market size and forecast 2025-2030 ($ million)
Data Table on Offline - Market size and forecast 2025-2030 ($ million)
Chart on Offline - Year-over-year growth 2025-2030 (%)
Data Table on Offline - Year-over-year growth 2025-2030 (%)

9.4 Online - Market size and forecast 2025-2030

Chart on Online - Market size and forecast 2025-2030 ($ million)
Data Table on Online - Market size and forecast 2025-2030 ($ million)
Chart on Online - Year-over-year growth 2025-2030 (%)
Data Table on Online - Year-over-year growth 2025-2030 (%)

9.5 Market opportunity by Distribution Channel

Market opportunity by Distribution Channel ($ million)
Data Table on Market opportunity by Distribution Channel ($ million)

10. Market Segmentation by Type

10.1 Market segments

Chart on Type - Market share 2025-2030 (%)
Data Table on Type - Market share 2025-2030 (%)

10.2 Comparison by Type

Chart on Comparison by Type
Data Table on Comparison by Type

10.3 Lead or rhythm guitars - Market size and forecast 2025-2030

Chart on Lead or rhythm guitars - Market size and forecast 2025-2030 ($ million)
Data Table on Lead or rhythm guitars - Market size and forecast 2025-2030 ($ million)
Chart on Lead or rhythm guitars - Year-over-year growth 2025-2030 (%)
Data Table on Lead or rhythm guitars - Year-over-year growth 2025-2030 (%)

10.4 Bass guitars - Market size and forecast 2025-2030

Chart on Bass guitars - Market size and forecast 2025-2030 ($ million)
Data Table on Bass guitars - Market size and forecast 2025-2030 ($ million)
Chart on Bass guitars - Year-over-year growth 2025-2030 (%)
Data Table on Bass guitars - Year-over-year growth 2025-2030 (%)

10.5 Market opportunity by Type

Market opportunity by Type ($ million)
Data Table on Market opportunity by Type ($ million)

11. Market Segmentation by End-user

11.1 Market segments

Chart on End-user - Market share 2025-2030 (%)
Data Table on End-user - Market share 2025-2030 (%)

11.2 Comparison by End-user

Chart on Comparison by End-user
Data Table on Comparison by End-user

11.3 Hobbyists - Market size and forecast 2025-2030

Chart on Hobbyists - Market size and forecast 2025-2030 ($ million)
Data Table on Hobbyists - Market size and forecast 2025-2030 ($ million)
Chart on Hobbyists - Year-over-year growth 2025-2030 (%)
Data Table on Hobbyists - Year-over-year growth 2025-2030 (%)

11.4 Professionals - Market size and forecast 2025-2030

Chart on Professionals - Market size and forecast 2025-2030 ($ million)
Data Table on Professionals - Market size and forecast 2025-2030 ($ million)
Chart on Professionals - Year-over-year growth 2025-2030 (%)
Data Table on Professionals - Year-over-year growth 2025-2030 (%)

11.5 Others - Market size and forecast 2025-2030

Chart on Others - Market size and forecast 2025-2030 ($ million)
Data Table on Others - Market size and forecast 2025-2030 ($ million)
Chart on Others - Year-over-year growth 2025-2030 (%)
Data Table on Others - Year-over-year growth 2025-2030 (%)

11.6 Market opportunity by End-user

Market opportunity by End-user ($ million)
Data Table on Market opportunity by End-user ($ million)

12. Customer Landscape

12.1 Customer landscape overview

Analysis of price sensitivity, lifecycle, customer purchase basket, adoption rates, and purchase criteria

13. Geographic Landscape

13.1 Geographic segmentation

Chart on Market share by geography 2025-2030 (%)
Data Table on Market share by geography 2025-2030 (%)

13.2 Geographic comparison

Chart on Geographic comparison
Data Table on Geographic comparison

13.3 North America - Market size and forecast 2025-2030

Chart on North America - Market size and forecast 2025-2030 ($ million)
Data Table on North America - Market size and forecast 2025-2030 ($ million)
Chart on North America - Year-over-year growth 2025-2030 (%)
Data Table on North America - Year-over-year growth 2025-2030 (%)
Chart on Regional Comparison - North America
Data Table on Regional Comparison - North America

13.3.1 US - Market size and forecast 2025-2030

Chart on US - Market size and forecast 2025-2030 ($ million)
Data Table on US - Market size and forecast 2025-2030 ($ million)
Chart on US - Year-over-year growth 2025-2030 (%)
Data Table on US - Year-over-year growth 2025-2030 (%)

13.3.2 Canada - Market size and forecast 2025-2030

Chart on Canada - Market size and forecast 2025-2030 ($ million)
Data Table on Canada - Market size and forecast 2025-2030 ($ million)
Chart on Canada - Year-over-year growth 2025-2030 (%)
Data Table on Canada - Year-over-year growth 2025-2030 (%)

13.3.3 Mexico - Market size and forecast 2025-2030

Chart on Mexico - Market size and forecast 2025-2030 ($ million)
Data Table on Mexico - Market size and forecast 2025-2030 ($ million)
Chart on Mexico - Year-over-year growth 2025-2030 (%)
Data Table on Mexico - Year-over-year growth 2025-2030 (%)

13.4 Europe - Market size and forecast 2025-2030

Chart on Europe - Market size and forecast 2025-2030 ($ million)
Data Table on Europe - Market size and forecast 2025-2030 ($ million)
Chart on Europe - Year-over-year growth 2025-2030 (%)
Data Table on Europe - Year-over-year growth 2025-2030 (%)
Chart on Regional Comparison - Europe
Data Table on Regional Comparison - Europe

13.4.1 Germany - Market size and forecast 2025-2030

Chart on Germany - Market size and forecast 2025-2030 ($ million)
Data Table on Germany - Market size and forecast 2025-2030 ($ million)
Chart on Germany - Year-over-year growth 2025-2030 (%)
Data Table on Germany - Year-over-year growth 2025-2030 (%)

13.4.2 UK - Market size and forecast 2025-2030

Chart on UK - Market size and forecast 2025-2030 ($ million)
Data Table on UK - Market size and forecast 2025-2030 ($ million)
Chart on UK - Year-over-year growth 2025-2030 (%)
Data Table on UK - Year-over-year growth 2025-2030 (%)

13.4.3 France - Market size and forecast 2025-2030

Chart on France - Market size and forecast 2025-2030 ($ million)
Data Table on France - Market size and forecast 2025-2030 ($ million)
Chart on France - Year-over-year growth 2025-2030 (%)
Data Table on France - Year-over-year growth 2025-2030 (%)

13.4.4 Italy - Market size and forecast 2025-2030

Chart on Italy - Market size and forecast 2025-2030 ($ million)
Data Table on Italy - Market size and forecast 2025-2030 ($ million)
Chart on Italy - Year-over-year growth 2025-2030 (%)
Data Table on Italy - Year-over-year growth 2025-2030 (%)

13.4.5 Spain - Market size and forecast 2025-2030

Chart on Spain - Market size and forecast 2025-2030 ($ million)
Data Table on Spain - Market size and forecast 2025-2030 ($ million)
Chart on Spain - Year-over-year growth 2025-2030 (%)
Data Table on Spain - Year-over-year growth 2025-2030 (%)

13.4.6 The Netherlands - Market size and forecast 2025-2030

Chart on The Netherlands - Market size and forecast 2025-2030 ($ million)
Data Table on The Netherlands - Market size and forecast 2025-2030 ($ million)
Chart on The Netherlands - Year-over-year growth 2025-2030 (%)
Data Table on The Netherlands - Year-over-year growth 2025-2030 (%)

13.5 APAC - Market size and forecast 2025-2030

Chart on APAC - Market size and forecast 2025-2030 ($ million)
Data Table on APAC - Market size and forecast 2025-2030 ($ million)
Chart on APAC - Year-over-year growth 2025-2030 (%)
Data Table on APAC - Year-over-year growth 2025-2030 (%)
Chart on Regional Comparison - APAC
Data Table on Regional Comparison - APAC

13.5.1 China - Market size and forecast 2025-2030

Chart on China - Market size and forecast 2025-2030 ($ million)
Data Table on China - Market size and forecast 2025-2030 ($ million)
Chart on China - Year-over-year growth 2025-2030 (%)
Data Table on China - Year-over-year growth 2025-2030 (%)

13.5.2 Japan - Market size and forecast 2025-2030

Chart on Japan - Market size and forecast 2025-2030 ($ million)
Data Table on Japan - Market size and forecast 2025-2030 ($ million)
Chart on Japan - Year-over-year growth 2025-2030 (%)
Data Table on Japan - Year-over-year growth 2025-2030 (%)

13.5.3 India - Market size and forecast 2025-2030

Chart on India - Market size and forecast 2025-2030 ($ million)
Data Table on India - Market size and forecast 2025-2030 ($ million)
Chart on India - Year-over-year growth 2025-2030 (%)
Data Table on India - Year-over-year growth 2025-2030 (%)

13.5.4 South Korea - Market size and forecast 2025-2030

Chart on South Korea - Market size and forecast 2025-2030 ($ million)
Data Table on South Korea - Market size and forecast 2025-2030 ($ million)
Chart on South Korea - Year-over-year growth 2025-2030 (%)
Data Table on South Korea - Year-over-year growth 2025-2030 (%)

13.5.5 Australia - Market size and forecast 2025-2030

Chart on Australia - Market size and forecast 2025-2030 ($ million)
Data Table on Australia - Market size and forecast 2025-2030 ($ million)
Chart on Australia - Year-over-year growth 2025-2030 (%)
Data Table on Australia - Year-over-year growth 2025-2030 (%)

13.5.6 Indonesia - Market size and forecast 2025-2030

Chart on Indonesia - Market size and forecast 2025-2030 ($ million)
Data Table on Indonesia - Market size and forecast 2025-2030 ($ million)
Chart on Indonesia - Year-over-year growth 2025-2030 (%)
Data Table on Indonesia - Year-over-year growth 2025-2030 (%)

13.6 South America - Market size and forecast 2025-2030

Chart on South America - Market size and forecast 2025-2030 ($ million)
Data Table on South America - Market size and forecast 2025-2030 ($ million)
Chart on South America - Year-over-year growth 2025-2030 (%)
Data Table on South America - Year-over-year growth 2025-2030 (%)
Chart on Regional Comparison - South America
Data Table on Regional Comparison - South America

13.6.1 Brazil - Market size and forecast 2025-2030

Chart on Brazil - Market size and forecast 2025-2030 ($ million)
Data Table on Brazil - Market size and forecast 2025-2030 ($ million)
Chart on Brazil - Year-over-year growth 2025-2030 (%)
Data Table on Brazil - Year-over-year growth 2025-2030 (%)

13.6.2 Argentina - Market size and forecast 2025-2030

Chart on Argentina - Market size and forecast 2025-2030 ($ million)
Data Table on Argentina - Market size and forecast 2025-2030 ($ million)
Chart on Argentina - Year-over-year growth 2025-2030 (%)
Data Table on Argentina - Year-over-year growth 2025-2030 (%)

13.6.3 Colombia - Market size and forecast 2025-2030

Chart on Colombia - Market size and forecast 2025-2030 ($ million)
Data Table on Colombia - Market size and forecast 2025-2030 ($ million)
Chart on Colombia - Year-over-year growth 2025-2030 (%)
Data Table on Colombia - Year-over-year growth 2025-2030 (%)

13.7 Middle East and Africa - Market size and forecast 2025-2030

Chart on Middle East and Africa - Market size and forecast 2025-2030 ($ million)
Data Table on Middle East and Africa - Market size and forecast 2025-2030 ($ million)
Chart on Middle East and Africa - Year-over-year growth 2025-2030 (%)
Data Table on Middle East and Africa - Year-over-year growth 2025-2030 (%)
Chart on Regional Comparison - Middle East and Africa
Data Table on Regional Comparison - Middle East and Africa

13.7.1 UAE - Market size and forecast 2025-2030

Chart on UAE - Market size and forecast 2025-2030 ($ million)
Data Table on UAE - Market size and forecast 2025-2030 ($ million)
Chart on UAE - Year-over-year growth 2025-2030 (%)
Data Table on UAE - Year-over-year growth 2025-2030 (%)

13.7.2 Saudi Arabia - Market size and forecast 2025-2030

Chart on Saudi Arabia - Market size and forecast 2025-2030 ($ million)
Data Table on Saudi Arabia - Market size and forecast 2025-2030 ($ million)
Chart on Saudi Arabia - Year-over-year growth 2025-2030 (%)
Data Table on Saudi Arabia - Year-over-year growth 2025-2030 (%)

13.7.3 South Africa - Market size and forecast 2025-2030

Chart on South Africa - Market size and forecast 2025-2030 ($ million)
Data Table on South Africa - Market size and forecast 2025-2030 ($ million)
Chart on South Africa - Year-over-year growth 2025-2030 (%)
Data Table on South Africa - Year-over-year growth 2025-2030 (%)

13.7.4 Turkey - Market size and forecast 2025-2030

Chart on Turkey - Market size and forecast 2025-2030 ($ million)
Data Table on Turkey - Market size and forecast 2025-2030 ($ million)
Chart on Turkey - Year-over-year growth 2025-2030 (%)
Data Table on Turkey - Year-over-year growth 2025-2030 (%)

13.7.5 Egypt - Market size and forecast 2025-2030

Chart on Egypt - Market size and forecast 2025-2030 ($ million)
Data Table on Egypt - Market size and forecast 2025-2030 ($ million)
Chart on Egypt - Year-over-year growth 2025-2030 (%)
Data Table on Egypt - Year-over-year growth 2025-2030 (%)

13.8 Market opportunity by geography

Market opportunity by geography ($ million)
Data Tables on Market opportunity by geography ($ million)

14. Drivers, Challenges, and Opportunity

14.1 Market drivers

Proliferation of digital learning platforms and social media
Growth of home recording and creator economy
Continuous product innovation and technological integration

14.2 Market challenges

Supply chain complexity and raw material volatility
Shifting musical preferences and competition from digital entertainment
Market saturation and extended product replacement cycles

14.3 Impact of drivers and challenges

Impact of drivers and challenges in 2025 and 2030

14.4 Market opportunities

Resurgence of vintage and retro aesthetics
Rise of boutique and custom-built industry
Deepening integration of digital technology

15. Competitive Landscape

15.1 Overview

15.2

Overview on criticality of inputs and factors of differentiation

15.3 Landscape disruption

Overview on factors of disruption

15.4 Industry risks

Impact of key risks on business

16. Competitive Analysis

16.1 Companies profiled

Companies covered

16.2 Company ranking index

16.3 Market positioning of companies

Matrix on companies position and classification

16.4 Caparison Guitar Co. Ltd.

Caparison Guitar Co. Ltd. - Overview
Caparison Guitar Co. Ltd. - Product / Service
Caparison Guitar Co. Ltd. - Key offerings
SWOT

16.5 Carvin Corp

Carvin Corp - Overview
Carvin Corp - Product / Service
Carvin Corp - Key offerings
SWOT

16.6 Dean Guitars

Dean Guitars - Overview
Dean Guitars - Product / Service
Dean Guitars - Key offerings
SWOT

16.7 Dingwall Guitars

Dingwall Guitars - Overview
Dingwall Guitars - Product / Service
Dingwall Guitars - Key offerings
SWOT

16.8 Duesenberg Guitars

Duesenberg Guitars - Overview
Duesenberg Guitars - Product / Service
Duesenberg Guitars - Key offerings
SWOT

16.9 Fender Musical Instruments

Fender Musical Instruments - Overview
Fender Musical Instruments - Product / Service
Fender Musical Instruments - Key offerings
SWOT

16.10 Gibson Brands Inc.

Gibson Brands Inc. - Overview
Gibson Brands Inc. - Product / Service
Gibson Brands Inc. - Key offerings
SWOT

16.11 Godin Guitars

Godin Guitars - Overview
Godin Guitars - Product / Service
Godin Guitars - Key offerings
SWOT

16.12 Gretsch Guitars

Gretsch Guitars - Overview
Gretsch Guitars - Product / Service
Gretsch Guitars - Key offerings
SWOT

16.13 JS Technologies Inc.

JS Technologies Inc. - Overview
JS Technologies Inc. - Product / Service
JS Technologies Inc. - Key offerings
SWOT

16.14 Ormsby Guitars

Ormsby Guitars - Overview
Ormsby Guitars - Product / Service
Ormsby Guitars - Key offerings
SWOT

16.15 Rickenbacker International Corp.

Rickenbacker International Corp. - Overview
Rickenbacker International Corp. - Product / Service
Rickenbacker International Corp. - Key offerings
SWOT

16.16 The ESP Guitar Co.

The ESP Guitar Co. - Overview
The ESP Guitar Co. - Product / Service
The ESP Guitar Co. - Key offerings
SWOT

16.17 Tom Anderson Guitarworks

Tom Anderson Guitarworks - Overview
Tom Anderson Guitarworks - Product / Service
Tom Anderson Guitarworks - Key offerings
SWOT

16.18 Yamaha Corp.

Yamaha Corp. - Overview
Yamaha Corp. - Business segments
Yamaha Corp. - Key offerings
Yamaha Corp. - Segment focus
SWOT

17. Appendix

17.1 Scope of the report

Market definition
Objectives
Notes and caveats

17.2 Inclusions and exclusions checklist

Inclusions checklist
Exclusions checklist

17.3 Currency conversion rates for US$

17.4 Research methodology

17.5 Data procurement

Information sources

17.6 Data validation

17.7 Validation techniques employed for market sizing

17.8 Data synthesis

17.9 360 degree market analysis

17.10 List of abbreviations

Research Methodology

Technavio presents a detailed picture of the market by way of study, synthesis, and summation of data from multiple sources. The analysts have presented the various facets of the market with a particular focus on identifying the key industry influencers. The data thus presented is comprehensive, reliable, and the result of extensive research, both primary and secondary.

INFORMATION SOURCES

Primary sources

  • Manufacturers and suppliers
  • Channel partners
  • Industry experts
  • Strategic decision makers

Secondary sources

  • Industry journals and periodicals
  • Government data
  • Financial reports of key industry players
  • Historical data
  • Press releases

DATA ANALYSIS

Data Synthesis

  • Collation of data
  • Estimation of key figures
  • Analysis of derived insights

Data Validation

  • Triangulation with data models
  • Reference against proprietary databases
  • Corroboration with industry experts

REPORT WRITING

Qualitative

  • Market drivers
  • Market challenges
  • Market trends
  • Five forces analysis

Quantitative

  • Market size and forecast
  • Market segmentation
  • Geographical insights
  • Competitive landscape

Interested in this report?

Get your sample now to see our research methodology and insights!

Download Now

Frequently Asked Questions

Electric Guitar market growth will increase by USD 1689.0 million during 2026-2030.

The Electric Guitar market is expected to grow at a CAGR of 10.2% during 2026-2030.

Electric Guitar market is segmented by Product (Solid-body, Semi-hollow body, Hollow body, Accessories) Distribution channel (Offline, Online) Type (Lead or rhythm guitars, Bass guitars) End-user (Hobbyists, Professionals, Others)

Caparison Guitar Co. Ltd., Carvin Corp, CorTek Corp., DAngelico Guitars, Dean Guitars, Dingwall Guitars, Duesenberg Guitars, Fender Musical Instruments, Gibson Brands Inc., Godin Guitars, Gretsch Guitars, Heritage Guitar Inc., JS Technologies Inc., Ormsby Guitars, Paul Reed Smith Guitars, Reverend Guitars, Rickenbacker International Corp., The ESP Guitar Co., Tom Anderson Guitarworks, Yamaha Corp. are a few of the key vendors in the Electric Guitar market.

North America will register the highest growth rate of 54.5% among the other regions. Therefore, the Electric Guitar market in North America is expected to garner significant business opportunities for the vendors during the forecast period.

US, Canada, Mexico, Germany, UK, France, Italy, Spain, The Netherlands, China, Japan, India, South Korea, Australia, Indonesia, Brazil, Argentina, Colombia, UAE, Saudi Arabia, South Africa, Turkey, Egypt

  • Proliferation of digital learning platforms and social media is the driving factor this market.

The Electric Guitar market vendors should focus on grabbing business opportunities from the Product segment as it accounted for the largest market share in the base year.
RIA - Research AI Assistant
Ask RIA
