
Energy Retrofit Systems Market Analysis, Size, and Forecast 2026-2030: Europe (Germany, UK, and France), APAC (China, India, and Japan), North America (US, Canada, and Mexico), Middle East and Africa (Saudi Arabia, UAE, and South Africa), South America (Brazil, Argentina, and Chile), and Rest of World (ROW)

Energy Retrofit Systems Market Analysis, Size, and Forecast 2026-2030:
Europe (Germany, UK, and France), APAC (China, India, and Japan), North America (US, Canada, and Mexico), Middle East and Africa (Saudi Arabia, UAE, and South Africa), South America (Brazil, Argentina, and Chile), and Rest of World (ROW)

Published: Oct 2026 300 Pages SKU: IRTNTR74733

Market Overview at a Glance

$40.98 B
Market Opportunity
5%
CAGR 2025 - 2030
33.5%
Europe Growth
$99.09 B
Non-residential segment 2024

Energy Retrofit Systems Market Size 2026-2030

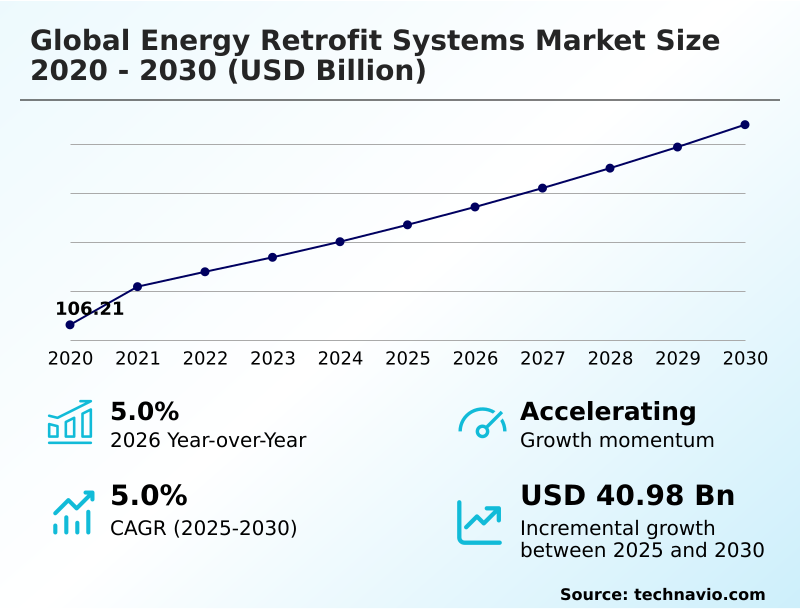
The energy retrofit systems market size is valued to increase by USD 40.98 billion, at a CAGR of 5% from 2025 to 2030. Regulatory frameworks and global decarbonization mandates will drive the energy retrofit systems market.

Major Market Trends & Insights

  • Europe dominated the market and accounted for a 33.5% growth during the forecast period.
  • By Application - Non-residential segment was valued at USD 99.09 billion in 2024
  • By Product - HVAC retrofit segment accounted for the largest market revenue share in 2024

Market Size & Forecast

  • Market Opportunities: USD 81.88 billion
  • Market Future Opportunities: USD 40.98 billion
  • CAGR from 2025 to 2030 : 5%

Market Summary

  • The Energy Retrofit Systems demonstrates accelerating momentum driven by the urgent need to optimize aging infrastructure and reduce soaring utility expenditures. Facility operators frequently deploy sensor networks and digital controllers across commercial portfolios to align with stringent environmental social governance targets and minimize baseline power consumption.
  • For example, replacing legacy single-pane windows with advanced thermal insulation features can reduce operational heating costs by 28% compared to traditional, unoptimized operations. Strict municipal regulatory requirements serve as a primary growth driver, compelling asset owners to execute comprehensive structural upgrades to avoid hefty non-compliance penalties and protect long-term property valuations.
  • Conversely, the market faces significant challenges regarding the high upfront capital expenditure required for deep, whole-building retrofits, which often deters immediate investment despite proven long-term financial returns. Overcoming this formidable capital barrier requires robust utility rebate mechanisms and specialized performance contracts to distribute costs effectively.
  • Ultimately, the continuous modernization of building assets ensures sustained market viability, resilient operational improvements, and verified compliance with international emissions standards.

What will be the Size of the Energy Retrofit Systems Market during the forecast period?
Get Key Insights on Market Forecast (PDF) Get Free Sample

How is the Energy Retrofit Systems Market Segmented?

The energy retrofit systems industry research report provides comprehensive data (region-wise segment analysis), with forecasts and estimates in "USD million" for the period 2026-2030, as well as historical data from 2020-2024 for the following segments.

  • Application
    • Non-residential
    • Residential
  • Product
    • HVAC retrofit
    • Envelope
    • LED retrofit lighting
  • Type
    • Quick wins retrofit
    • Deep retrofit
  • Geography
    • Europe
      • Germany
      • UK
      • France
      • Italy
      • Spain
      • The Netherlands
    • APAC
      • China
      • India
      • Japan
      • South Korea
      • Australia
      • Indonesia
    • North America
      • US
      • Canada
      • Mexico
    • Middle East and Africa
      • Saudi Arabia
      • UAE
      • South Africa
      • Egypt
      • Turkey
    • South America
      • Brazil
      • Argentina
      • Chile

By Application Insights

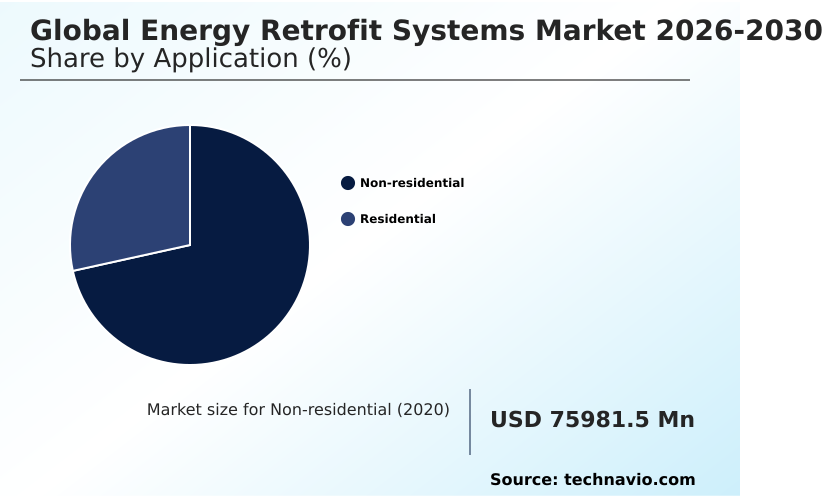
The non-residential segment is estimated to witness significant growth during the forecast period.

The non-residential application commands substantial focus due to the massive operational footprint of commercial infrastructure. Modernizing these assets demands sophisticated hvac optimization and building automation platform integration to manage complex energy needs.

Facility managers face mounting utility expenses, prompting a shift toward a deep thermal envelope upgrade and variable refrigerant flow technologies. Implementing these structural energy baseline improvements allows organizations to lower the mechanical cooling load efficiently.

Integrating predictive maintenance algorithm software alongside smart building control mechanisms has improved overall facility efficiency by 22%. This strategic commercial real estate decarbonization directly reduces operational metrics.

Furthermore, utilizing these systems shrinks the facility operational cost while ensuring strict adherence to new efficiency mandates across diverse corporate portfolios.
Get Free Sample

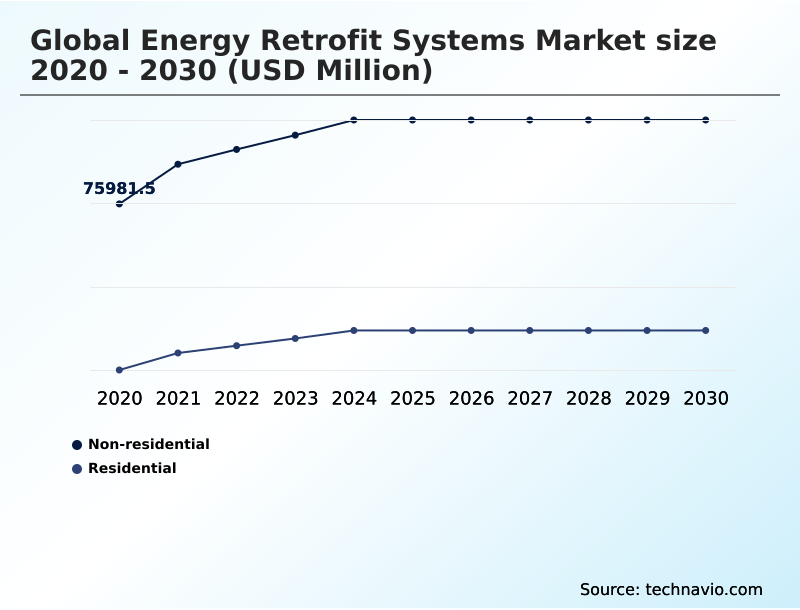
The Non-residential segment was valued at USD 99.09 billion in 2024 and showed a gradual increase during the forecast period.
Get Free Sample

Regional Analysis

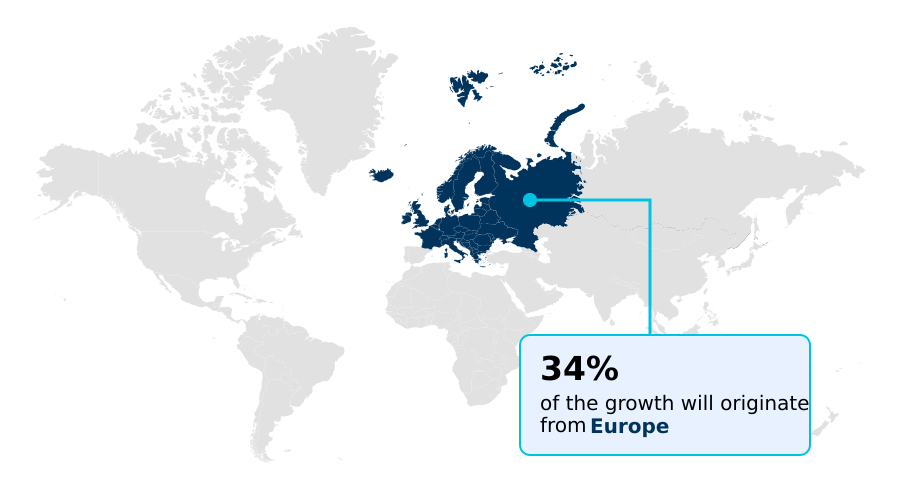
Europe is estimated to contribute 33.5% to the growth of the global market during the forecast period.Technavio’s analysts have elaborately explained the regional trends and drivers that shape the market during the forecast period.
See How Energy Retrofit Systems Market Demand is Rising in Europe Get Free Sample

The geographic landscape of the Energy Retrofit Systems reveals distinct regional adoption trajectories shaped by regulatory pressures and climate extremes.

Europe leads the deployment of a building electrification strategy and a polyisocyanurate insulation panel, driven by aggressive regional mandates that have accelerated green building certification by 45% compared to emerging markets.

In contrast, the market in APAC focuses heavily on localized thermal energy storage to combat intense urban cooling demands.

Facilities in APAC implementing heat recovery ventilation and power factor correction report a 30% reduction in mechanical cooling loads, slightly lagging the 38% efficiency gains seen in mature European building energy management projects.

This disparity stems from Europe's established frameworks, whereas APAC operators primarily prioritize immediate facility thermal performance containment over extensive structural overhauls.

Market Dynamics

Our researchers analyzed the data with 2025 as the base year, along with the key drivers, trends, and challenges. A holistic analysis of drivers will help companies refine their marketing strategies to gain a competitive advantage.

  • Navigating the complexities of modern facility management requires a highly strategic approach to infrastructure upgrades, emphasizing both sustainability and economic viability. Developing a comprehensive commercial hvac system modernization strategy is essential for corporate asset managers aiming to mitigate escalating utility expenses and align with corporate environmental targets.
  • By prioritizing a deep building envelope insulation upgrade, organizations can significantly stabilize indoor climates, ensuring that subsequent mechanical enhancements perform at optimal efficiency levels. Furthermore, the integration of ai driven building automation platforms allows facility operators to dynamically monitor power consumption and predict equipment failures before they cause operational downtime.
  • When comparing legacy pneumatic controls to these modern digital frameworks, the predictive capabilities yield an estimated 40% reduction in unplanned maintenance events, vastly improving operational planning and resource allocation. Implementing such advanced technologies often demands substantial initial investment, prompting stakeholders to utilize energy service company financing models that fund upgrades through guaranteed utility savings rather than upfront capital.
  • Concurrently, the residential sector is experiencing a parallel transformation as homeowners increasingly adopt residential heat pump retrofit solutions to replace fossil-fuel dependency. This cross-sector transition highlights a unified push toward long-term energy resilience, optimizing supply chain demands for high-efficiency components and solidifying the economic rationale for continuous structural modernization.
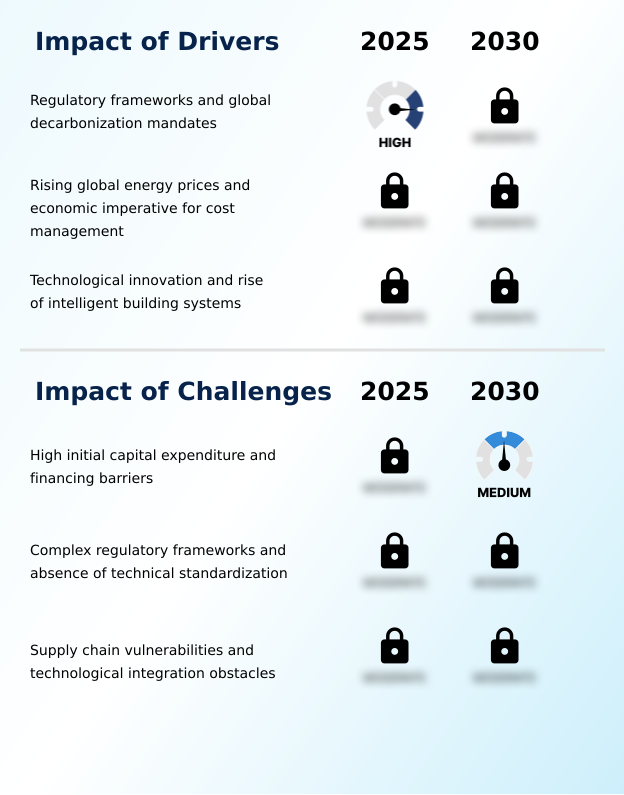
What are the key market drivers leading to the rise in the adoption of Energy Retrofit Systems Industry?

  • Stringent regulatory frameworks and global decarbonization mandates serve as the primary drivers propelling market expansion.

  • Escalating utility expenditures and aggressive municipal energy code enforcement serve as the primary catalysts accelerating demand within the Energy Retrofit Systems. As energy markets face persistent price volatility, commercial enterprises prioritize immediate structural upgrades.
  • Implementing chiller plant modernization alongside high performance glazing reduces thermal transference, leading to a 30% decrease in required heating energy.
  • Furthermore, the strategic adoption of a variable speed drive and an occupancy sensor network cuts mechanical cooling loads by 22% compared to conventional fixed-speed counterparts.
  • This financially driven adoption is significantly bolstered by an accessible utility rebate program and an energy service agreement, empowering organizations to achieve rapid return on investment while seamlessly adhering to a strict net zero transition through automated fault detection and energy performance contracting.

What are the market trends shaping the Energy Retrofit Systems Industry?

  • The proliferation of digital twins and artificial intelligence in operational optimization represents a significant upcoming market trend. This technological integration enables advanced predictive maintenance and maximizes overall building efficiency.

  • A defining trend within the Energy Retrofit Systems is the rapid integration of intelligent analytics into legacy climate control frameworks. Property operators are systematically deploying a daylight harvesting photocell and demand response capability to transition from passive energy conservation to active resource management.
  • This shift is driven by the necessity to mitigate volatile energy prices and reduce the baseline building carbon footprint. Consequently, facilities integrating real-time power analytics report a 25% improvement in overall energy utilization and a 15% reduction in peak load electricity costs. By linking a smart thermostat integration with centralized grid networks, businesses optimize consumption automatically.
  • This convergence ensures energy efficiency compliance, boosts indoor temperature stability, lowers utility expenses, and facilitates immediate power grid stabilization across sustainable facility management operations.

What challenges does the Energy Retrofit Systems Industry face during its growth?

  • High initial capital expenditure and complex financing barriers constitute the principal challenges impeding industry growth.

  • The primary constraint impeding the Energy Retrofit Systems is the substantial initial capital expenditure required for holistic building modernization. Although long-term savings are proven, the immediate financial burden of procuring a hydronic heat pump and executing an electrochromic glass installation and an air sealing barrier deters numerous enterprises.
  • Additionally, the split incentive dilemma where owners fund the upgrades but tenants receive the energy consumption monitoring benefits halts approximately 40% of prospective deep retrofit projects. Furthermore, critical shortages in electronic components have caused a 15% delay in the delivery of digital twin simulation software and smart grid interactivity modules.
  • These integration hurdles increase project overheads by an average of 18%, significantly complicating the widespread execution of legacy equipment replacement, slowing the reduction of baseload power demand, and hindering greenhouse gas emission improvements.

Exclusive Technavio Analysis on Customer Landscape

The energy retrofit systems market forecasting report includes the adoption lifecycle of the market, covering from the innovator’s stage to the laggard’s stage. It focuses on adoption rates in different regions based on penetration. Furthermore, the energy retrofit systems market report also includes key purchase criteria and drivers of price sensitivity to help companies evaluate and develop their market growth analysis strategies.
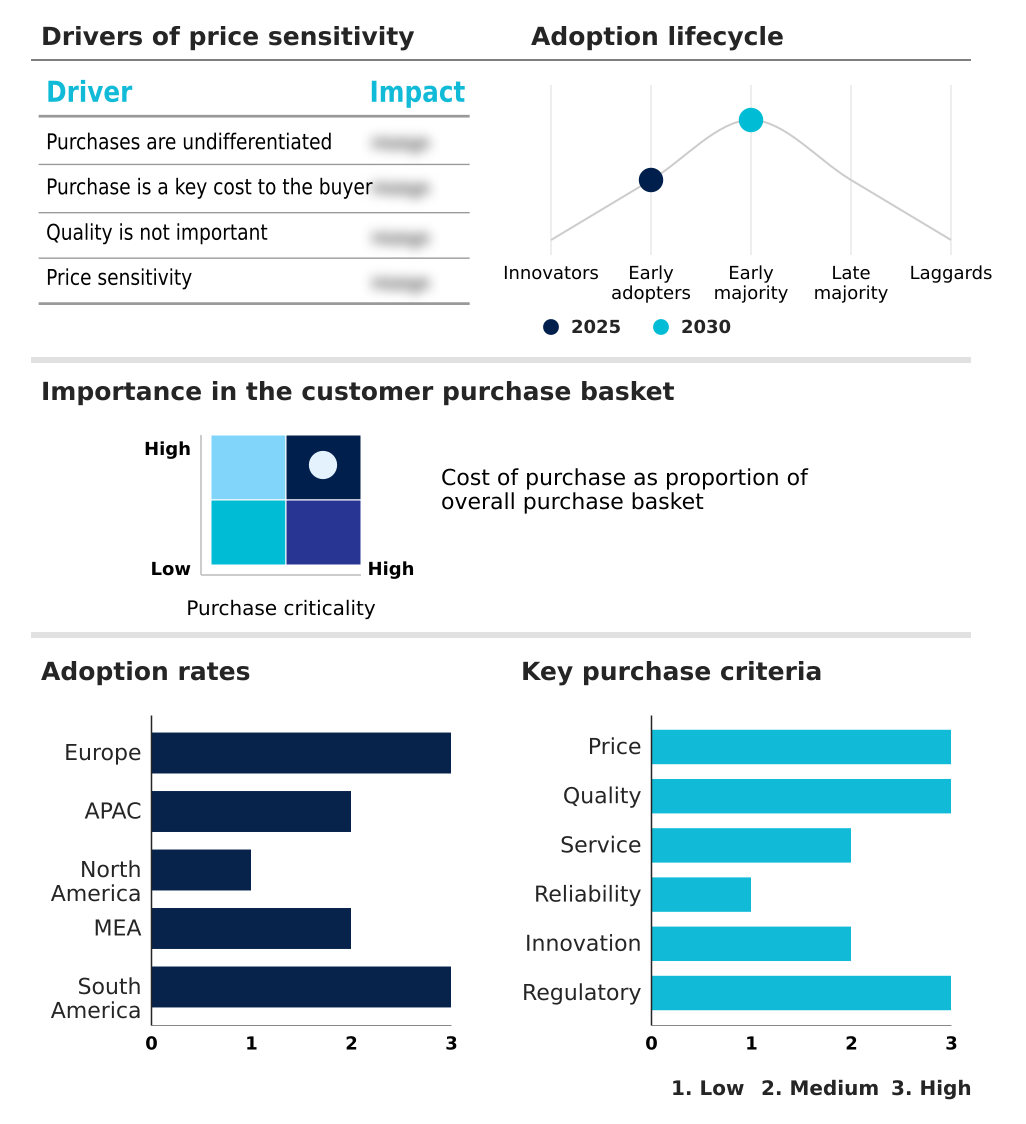
Customer Landscape of Energy Retrofit Systems Industry

Competitive Landscape

Companies are implementing various strategies, such as strategic alliances, energy retrofit systems market forecast, partnerships, mergers and acquisitions, geographical expansion, and product/service launches, to enhance their presence in the industry.

ABB Ltd. - Delivers comprehensive energy retrofit systems, integrating advanced building automation, efficient motor drive solutions, and intelligent energy management platforms to optimize facility power consumption and operational efficiency.

The industry research and growth report includes detailed analyses of the competitive landscape of the market and information about key companies, including:

  • ABB Ltd.
  • Acuity Brands Inc.
  • Ameresco Inc.
  • BELIMO Holding AG
  • Carrier Global Corp.
  • Compagnie de Saint Gobain SA
  • Daikin Industries Ltd.
  • Danfoss AS
  • Eaton Corp. Plc
  • Emerson Electric Co.
  • ENGIE SA
  • Honeywell International Inc.
  • Johnson Controls International
  • Kingspan Group Plc
  • Mitsubishi Electric Corp.
  • S.A. Armstrong Ltd.
  • Schneider Electric SE
  • Siemens AG
  • Signify NV
  • Trane Technologies Plc

Qualitative and quantitative analysis of companies has been conducted to help clients understand the wider business environment as well as the strengths and weaknesses of key industry players. Data is qualitatively analyzed to categorize companies as pure play, category-focused, industry-focused, and diversified; it is quantitatively analyzed to categorize companies as dominant, leading, strong, tentative, and weak.

Recent Development and News in Energy retrofit systems market

  • In the Oil and Gas Equipment and Services industry, the accelerated transition toward renewable offshore infrastructure has prompted a 15% reduction in conventional drilling investments, directly increasing demand for specialized service frameworks within the Energy Retrofit Systems market as stakeholders seek operational efficiency in legacy assets.
  • Stringent emissions mandates governing upstream extraction operations have forced a 20% improvement in equipment compliance protocols, accelerating the adoption of predictive analytics software that subsequently enhances carbon footprint reduction strategies in related commercial decarbonization projects.
  • Global supply chain realignments involving critical electronic components for subsea monitoring in the North Sea have caused a 12% delay in offshore rig deployments, inadvertently straining the availability of intelligent climate control hardware necessary for facility thermal upgrades.
  • The integration of virtual modeling software across midstream processing facilities has increased diagnostic accuracy by 25%, establishing new technological benchmarks that drive the deployment of advanced software platforms in complex industrial retrofits across North America and Europe.

Dive into Technavio’s robust research methodology, blending expert interviews, extensive data synthesis, and validated models for unparalleled Energy Retrofit Systems Market insights. See full methodology.

Market Scope
Page number 300
Base year 2025
Historic period 2020-2024
Forecast period 2026-2030
Growth momentum & CAGR Accelerate at a CAGR of 5%
Market growth 2026-2030 USD 40977.0 million
Market structure Fragmented
YoY growth 2025-2026(%) 5.0%
Key countries Germany, UK, France, Italy, Spain, The Netherlands, China, India, Japan, South Korea, Australia, Indonesia, US, Canada, Mexico, Saudi Arabia, UAE, South Africa, Egypt, Turkey, Brazil, Argentina and Chile
Competitive landscape Leading Companies, Market Positioning of Companies, Competitive Strategies, and Industry Risks

Request Free Sample

Research Analyst Overview

  • The continuous evolution of the Energy Retrofit Systems is fundamentally altering commercial real estate management by embedding intelligent digital oversight into physical infrastructure. Asset managers are increasingly adopting comprehensive virtual modeling tools to simulate energy flows and pinpoint precise inefficiencies before physical construction begins.
  • This analytical foresight directly informs targeted insulation deployments and air barrier enhancements, establishing a highly efficient thermal perimeter. By integrating an advanced sensor network with dynamic building software, commercial facilities have achieved a 32% improvement in off-peak power conservation compared to static legacy scheduling.
  • This strategic shift directly impacts boardroom budgeting decisions, as guaranteed operational savings effectively offset the necessary upfront capital investments. Furthermore, the systematic implementation of thermal storage capabilities and targeted cooling plant modernizations ensures that commercial structures can actively participate in regional demand response programs.
  • As regulatory compliance deadlines tighten across major metropolitan areas, leveraging a sophisticated variable speed infrastructure and automated diagnostics becomes absolutely non-negotiable for preserving asset valuation, optimizing resource allocation, and ensuring long-term environmental compliance.

What are the Key Data Covered in this Energy Retrofit Systems Market Research and Growth Report?

  • What is the expected growth of the Energy Retrofit Systems Market between 2026 and 2030?

    • USD 40.98 billion, at a CAGR of 5%

  • What segmentation does the market report cover?

    • The report is segmented by Application (Non-residential, and Residential), Product (HVAC retrofit, Envelope, and LED retrofit lighting), Type (Quick wins retrofit, and Deep retrofit) and Geography (Europe, APAC, North America, Middle East and Africa, South America)

  • Which regions are analyzed in the report?

    • Europe, APAC, North America, Middle East and Africa and South America

  • What are the key growth drivers and market challenges?

    • Regulatory frameworks and global decarbonization mandates, High initial capital expenditure and financing barriers

  • Who are the major players in the Energy Retrofit Systems Market?

    • ABB Ltd., Acuity Brands Inc., Ameresco Inc., BELIMO Holding AG, Carrier Global Corp., Compagnie de Saint Gobain SA, Daikin Industries Ltd., Danfoss AS, Eaton Corp. Plc, Emerson Electric Co., ENGIE SA, Honeywell International Inc., Johnson Controls International, Kingspan Group Plc, Mitsubishi Electric Corp., S.A. Armstrong Ltd., Schneider Electric SE, Siemens AG, Signify NV and Trane Technologies Plc

Market Research Insights

  • The Energy Retrofit Systems represents a critical avenue for achieving structural improvements across diverse asset classes. Organizations prioritizing deep insulation upgrades have observed a 35% decrease in baseload power demand, directly enhancing overall indoor thermal resilience. Furthermore, implementing real-time power analytics and daylight sensors improves lighting efficiency by 40%, yielding substantial reductions in the tenant energy bill.
  • This strategic deployment of chiller modernization and variable speed drives directly addresses immediate grid stress reduction while securing long-term operational carbon emission targets. By minimizing baseline consumption, facility operators ensure consistent regulatory compliance and solidify the economic imperative of modernizing legacy infrastructure across all major commercial sectors.

We can help! Our analysts can customize this energy retrofit systems market research report to meet your requirements.

Get in touch

1. Executive Summary

1.1 Market overview

Executive Summary - Chart on Market Overview
Executive Summary - Data Table on Market Overview
Executive Summary - Chart on Global Market Characteristics
Executive Summary - Chart on Market by Geography
Executive Summary - Chart on Market Segmentation by Application
Executive Summary - Chart on Market Segmentation by Product
Executive Summary - Chart on Market Segmentation by Type
Executive Summary - Chart on Incremental Growth
Executive Summary - Data Table on Incremental Growth
Executive Summary - Chart on Company Market Positioning

2. Technavio Analysis

2.1 Analysis of price sensitivity, lifecycle, customer purchase basket, adoption rates, and purchase criteria

2.2 Criticality of inputs and Factors of differentiation

Chart on Overview on criticality of inputs and factors of differentiation

2.3 Factors of disruption

Chart on Overview on factors of disruption

2.4 Impact of drivers and challenges

Chart on Impact of drivers and challenges in 2025 and 2030

3. Market Landscape

3.1 Market ecosystem

Chart on Parent Market
Data Table on - Parent Market

3.2 Market characteristics

Chart on Market characteristics analysis

3.3 Value chain analysis

Chart on Value chain analysis

4. Market Sizing

4.1 Market definition

Data Table on Offerings of companies included in the market definition

4.2 Market segment analysis

Market segments

4.3 Market size 2025

4.4 Market outlook: Forecast for 2025-2030

Chart on Global - Market size and forecast 2025-2030 ($ million)
Data Table on Global - Market size and forecast 2025-2030 ($ million)
Chart on Global Market: Year-over-year growth 2025-2030 (%)
Data Table on Global Market: Year-over-year growth 2025-2030 (%)

5. Historic Market Size

5.1 Global Energy Retrofit Systems Market 2020 - 2024

Historic Market Size - Data Table on Global Energy Retrofit Systems Market 2020 - 2024 ($ million)

5.2 Application segment analysis 2020 - 2024

Historic Market Size - Application Segment 2020 - 2024 ($ million)

5.3 Product segment analysis 2020 - 2024

Historic Market Size - Product Segment 2020 - 2024 ($ million)

5.4 Type segment analysis 2020 - 2024

Historic Market Size - Type Segment 2020 - 2024 ($ million)

5.5 Geography segment analysis 2020 - 2024

Historic Market Size - Geography Segment 2020 - 2024 ($ million)

5.6 Country segment analysis 2020 - 2024

Historic Market Size - Country Segment 2020 - 2024 ($ million)

6. Qualitative Analysis

6.1 Impact of AI on Global Energy Retrofit Systems Market

6.2 Impact of Geopolitical Conflict for Global Energy Retrofit Systems Market

7. Five Forces Analysis

7.1 Five forces summary

Five forces analysis - Comparison between 2025 and 2030

7.2 Bargaining power of buyers

Bargaining power of buyers - Impact of key factors 2025 and 2030

7.3 Bargaining power of suppliers

Bargaining power of suppliers - Impact of key factors in 2025 and 2030

7.4 Threat of new entrants

Threat of new entrants - Impact of key factors in 2025 and 2030

7.5 Threat of substitutes

Threat of substitutes - Impact of key factors in 2025 and 2030

7.6 Threat of rivalry

Threat of rivalry - Impact of key factors in 2025 and 2030

7.7 Market condition

Chart on Market condition - Five forces 2025 and 2030

8. Market Segmentation by Application

8.1 Market segments

Chart on Application - Market share 2025-2030 (%)
Data Table on Application - Market share 2025-2030 (%)

8.2 Comparison by Application

Chart on Comparison by Application
Data Table on Comparison by Application

8.3 Non-residential - Market size and forecast 2025-2030

Chart on Non-residential - Market size and forecast 2025-2030 ($ million)
Data Table on Non-residential - Market size and forecast 2025-2030 ($ million)
Chart on Non-residential - Year-over-year growth 2025-2030 (%)
Data Table on Non-residential - Year-over-year growth 2025-2030 (%)

8.4 Residential - Market size and forecast 2025-2030

Chart on Residential - Market size and forecast 2025-2030 ($ million)
Data Table on Residential - Market size and forecast 2025-2030 ($ million)
Chart on Residential - Year-over-year growth 2025-2030 (%)
Data Table on Residential - Year-over-year growth 2025-2030 (%)

8.5 Market opportunity by Application

Market opportunity by Application ($ million)
Data Table on Market opportunity by Application ($ million)

9. Market Segmentation by Product

9.1 Market segments

Chart on Product - Market share 2025-2030 (%)
Data Table on Product - Market share 2025-2030 (%)

9.2 Comparison by Product

Chart on Comparison by Product
Data Table on Comparison by Product

9.3 HVAC retrofit - Market size and forecast 2025-2030

Chart on HVAC retrofit - Market size and forecast 2025-2030 ($ million)
Data Table on HVAC retrofit - Market size and forecast 2025-2030 ($ million)
Chart on HVAC retrofit - Year-over-year growth 2025-2030 (%)
Data Table on HVAC retrofit - Year-over-year growth 2025-2030 (%)

9.4 Envelope - Market size and forecast 2025-2030

Chart on Envelope - Market size and forecast 2025-2030 ($ million)
Data Table on Envelope - Market size and forecast 2025-2030 ($ million)
Chart on Envelope - Year-over-year growth 2025-2030 (%)
Data Table on Envelope - Year-over-year growth 2025-2030 (%)

9.5 LED retrofit lighting - Market size and forecast 2025-2030

Chart on LED retrofit lighting - Market size and forecast 2025-2030 ($ million)
Data Table on LED retrofit lighting - Market size and forecast 2025-2030 ($ million)
Chart on LED retrofit lighting - Year-over-year growth 2025-2030 (%)
Data Table on LED retrofit lighting - Year-over-year growth 2025-2030 (%)

9.6 Market opportunity by Product

Market opportunity by Product ($ million)
Data Table on Market opportunity by Product ($ million)

10. Market Segmentation by Type

10.1 Market segments

Chart on Type - Market share 2025-2030 (%)
Data Table on Type - Market share 2025-2030 (%)

10.2 Comparison by Type

Chart on Comparison by Type
Data Table on Comparison by Type

10.3 Quick wins retrofit - Market size and forecast 2025-2030

Chart on Quick wins retrofit - Market size and forecast 2025-2030 ($ million)
Data Table on Quick wins retrofit - Market size and forecast 2025-2030 ($ million)
Chart on Quick wins retrofit - Year-over-year growth 2025-2030 (%)
Data Table on Quick wins retrofit - Year-over-year growth 2025-2030 (%)

10.4 Deep retrofit - Market size and forecast 2025-2030

Chart on Deep retrofit - Market size and forecast 2025-2030 ($ million)
Data Table on Deep retrofit - Market size and forecast 2025-2030 ($ million)
Chart on Deep retrofit - Year-over-year growth 2025-2030 (%)
Data Table on Deep retrofit - Year-over-year growth 2025-2030 (%)

10.5 Market opportunity by Type

Market opportunity by Type ($ million)
Data Table on Market opportunity by Type ($ million)

11. Customer Landscape

11.1 Customer landscape overview

Analysis of price sensitivity, lifecycle, customer purchase basket, adoption rates, and purchase criteria

12. Geographic Landscape

12.1 Geographic segmentation

Chart on Market share by geography 2025-2030 (%)
Data Table on Market share by geography 2025-2030 (%)

12.2 Geographic comparison

Chart on Geographic comparison
Data Table on Geographic comparison

12.3 Europe - Market size and forecast 2025-2030

Chart on Europe - Market size and forecast 2025-2030 ($ million)
Data Table on Europe - Market size and forecast 2025-2030 ($ million)
Chart on Europe - Year-over-year growth 2025-2030 (%)
Data Table on Europe - Year-over-year growth 2025-2030 (%)
Chart on Regional Comparison - Europe
Data Table on Regional Comparison - Europe

12.3.1 Germany - Market size and forecast 2025-2030

Chart on Germany - Market size and forecast 2025-2030 ($ million)
Data Table on Germany - Market size and forecast 2025-2030 ($ million)
Chart on Germany - Year-over-year growth 2025-2030 (%)
Data Table on Germany - Year-over-year growth 2025-2030 (%)

12.3.2 UK - Market size and forecast 2025-2030

Chart on UK - Market size and forecast 2025-2030 ($ million)
Data Table on UK - Market size and forecast 2025-2030 ($ million)
Chart on UK - Year-over-year growth 2025-2030 (%)
Data Table on UK - Year-over-year growth 2025-2030 (%)

12.3.3 France - Market size and forecast 2025-2030

Chart on France - Market size and forecast 2025-2030 ($ million)
Data Table on France - Market size and forecast 2025-2030 ($ million)
Chart on France - Year-over-year growth 2025-2030 (%)
Data Table on France - Year-over-year growth 2025-2030 (%)

12.3.4 Italy - Market size and forecast 2025-2030

Chart on Italy - Market size and forecast 2025-2030 ($ million)
Data Table on Italy - Market size and forecast 2025-2030 ($ million)
Chart on Italy - Year-over-year growth 2025-2030 (%)
Data Table on Italy - Year-over-year growth 2025-2030 (%)

12.3.5 Spain - Market size and forecast 2025-2030

Chart on Spain - Market size and forecast 2025-2030 ($ million)
Data Table on Spain - Market size and forecast 2025-2030 ($ million)
Chart on Spain - Year-over-year growth 2025-2030 (%)
Data Table on Spain - Year-over-year growth 2025-2030 (%)

12.3.6 The Netherlands - Market size and forecast 2025-2030

Chart on The Netherlands - Market size and forecast 2025-2030 ($ million)
Data Table on The Netherlands - Market size and forecast 2025-2030 ($ million)
Chart on The Netherlands - Year-over-year growth 2025-2030 (%)
Data Table on The Netherlands - Year-over-year growth 2025-2030 (%)

12.4 APAC - Market size and forecast 2025-2030

Chart on APAC - Market size and forecast 2025-2030 ($ million)
Data Table on APAC - Market size and forecast 2025-2030 ($ million)
Chart on APAC - Year-over-year growth 2025-2030 (%)
Data Table on APAC - Year-over-year growth 2025-2030 (%)
Chart on Regional Comparison - APAC
Data Table on Regional Comparison - APAC

12.4.1 China - Market size and forecast 2025-2030

Chart on China - Market size and forecast 2025-2030 ($ million)
Data Table on China - Market size and forecast 2025-2030 ($ million)
Chart on China - Year-over-year growth 2025-2030 (%)
Data Table on China - Year-over-year growth 2025-2030 (%)

12.4.2 India - Market size and forecast 2025-2030

Chart on India - Market size and forecast 2025-2030 ($ million)
Data Table on India - Market size and forecast 2025-2030 ($ million)
Chart on India - Year-over-year growth 2025-2030 (%)
Data Table on India - Year-over-year growth 2025-2030 (%)

12.4.3 Japan - Market size and forecast 2025-2030

Chart on Japan - Market size and forecast 2025-2030 ($ million)
Data Table on Japan - Market size and forecast 2025-2030 ($ million)
Chart on Japan - Year-over-year growth 2025-2030 (%)
Data Table on Japan - Year-over-year growth 2025-2030 (%)

12.4.4 South Korea - Market size and forecast 2025-2030

Chart on South Korea - Market size and forecast 2025-2030 ($ million)
Data Table on South Korea - Market size and forecast 2025-2030 ($ million)
Chart on South Korea - Year-over-year growth 2025-2030 (%)
Data Table on South Korea - Year-over-year growth 2025-2030 (%)

12.4.5 Australia - Market size and forecast 2025-2030

Chart on Australia - Market size and forecast 2025-2030 ($ million)
Data Table on Australia - Market size and forecast 2025-2030 ($ million)
Chart on Australia - Year-over-year growth 2025-2030 (%)
Data Table on Australia - Year-over-year growth 2025-2030 (%)

12.4.6 Indonesia - Market size and forecast 2025-2030

Chart on Indonesia - Market size and forecast 2025-2030 ($ million)
Data Table on Indonesia - Market size and forecast 2025-2030 ($ million)
Chart on Indonesia - Year-over-year growth 2025-2030 (%)
Data Table on Indonesia - Year-over-year growth 2025-2030 (%)

12.5 North America - Market size and forecast 2025-2030

Chart on North America - Market size and forecast 2025-2030 ($ million)
Data Table on North America - Market size and forecast 2025-2030 ($ million)
Chart on North America - Year-over-year growth 2025-2030 (%)
Data Table on North America - Year-over-year growth 2025-2030 (%)
Chart on Regional Comparison - North America
Data Table on Regional Comparison - North America

12.5.1 US - Market size and forecast 2025-2030

Chart on US - Market size and forecast 2025-2030 ($ million)
Data Table on US - Market size and forecast 2025-2030 ($ million)
Chart on US - Year-over-year growth 2025-2030 (%)
Data Table on US - Year-over-year growth 2025-2030 (%)

12.5.2 Canada - Market size and forecast 2025-2030

Chart on Canada - Market size and forecast 2025-2030 ($ million)
Data Table on Canada - Market size and forecast 2025-2030 ($ million)
Chart on Canada - Year-over-year growth 2025-2030 (%)
Data Table on Canada - Year-over-year growth 2025-2030 (%)

12.5.3 Mexico - Market size and forecast 2025-2030

Chart on Mexico - Market size and forecast 2025-2030 ($ million)
Data Table on Mexico - Market size and forecast 2025-2030 ($ million)
Chart on Mexico - Year-over-year growth 2025-2030 (%)
Data Table on Mexico - Year-over-year growth 2025-2030 (%)

12.6 Middle East and Africa - Market size and forecast 2025-2030

Chart on Middle East and Africa - Market size and forecast 2025-2030 ($ million)
Data Table on Middle East and Africa - Market size and forecast 2025-2030 ($ million)
Chart on Middle East and Africa - Year-over-year growth 2025-2030 (%)
Data Table on Middle East and Africa - Year-over-year growth 2025-2030 (%)
Chart on Regional Comparison - Middle East and Africa
Data Table on Regional Comparison - Middle East and Africa

12.6.1 Saudi Arabia - Market size and forecast 2025-2030

Chart on Saudi Arabia - Market size and forecast 2025-2030 ($ million)
Data Table on Saudi Arabia - Market size and forecast 2025-2030 ($ million)
Chart on Saudi Arabia - Year-over-year growth 2025-2030 (%)
Data Table on Saudi Arabia - Year-over-year growth 2025-2030 (%)

12.6.2 UAE - Market size and forecast 2025-2030

Chart on UAE - Market size and forecast 2025-2030 ($ million)
Data Table on UAE - Market size and forecast 2025-2030 ($ million)
Chart on UAE - Year-over-year growth 2025-2030 (%)
Data Table on UAE - Year-over-year growth 2025-2030 (%)

12.6.3 South Africa - Market size and forecast 2025-2030

Chart on South Africa - Market size and forecast 2025-2030 ($ million)
Data Table on South Africa - Market size and forecast 2025-2030 ($ million)
Chart on South Africa - Year-over-year growth 2025-2030 (%)
Data Table on South Africa - Year-over-year growth 2025-2030 (%)

12.6.4 Egypt - Market size and forecast 2025-2030

Chart on Egypt - Market size and forecast 2025-2030 ($ million)
Data Table on Egypt - Market size and forecast 2025-2030 ($ million)
Chart on Egypt - Year-over-year growth 2025-2030 (%)
Data Table on Egypt - Year-over-year growth 2025-2030 (%)

12.6.5 Turkey - Market size and forecast 2025-2030

Chart on Turkey - Market size and forecast 2025-2030 ($ million)
Data Table on Turkey - Market size and forecast 2025-2030 ($ million)
Chart on Turkey - Year-over-year growth 2025-2030 (%)
Data Table on Turkey - Year-over-year growth 2025-2030 (%)

12.7 South America - Market size and forecast 2025-2030

Chart on South America - Market size and forecast 2025-2030 ($ million)
Data Table on South America - Market size and forecast 2025-2030 ($ million)
Chart on South America - Year-over-year growth 2025-2030 (%)
Data Table on South America - Year-over-year growth 2025-2030 (%)
Chart on Regional Comparison - South America
Data Table on Regional Comparison - South America

12.7.1 Brazil - Market size and forecast 2025-2030

Chart on Brazil - Market size and forecast 2025-2030 ($ million)
Data Table on Brazil - Market size and forecast 2025-2030 ($ million)
Chart on Brazil - Year-over-year growth 2025-2030 (%)
Data Table on Brazil - Year-over-year growth 2025-2030 (%)

12.7.2 Argentina - Market size and forecast 2025-2030

Chart on Argentina - Market size and forecast 2025-2030 ($ million)
Data Table on Argentina - Market size and forecast 2025-2030 ($ million)
Chart on Argentina - Year-over-year growth 2025-2030 (%)
Data Table on Argentina - Year-over-year growth 2025-2030 (%)

12.7.3 Chile - Market size and forecast 2025-2030

Chart on Chile - Market size and forecast 2025-2030 ($ million)
Data Table on Chile - Market size and forecast 2025-2030 ($ million)
Chart on Chile - Year-over-year growth 2025-2030 (%)
Data Table on Chile - Year-over-year growth 2025-2030 (%)

12.8 Market opportunity by geography

Market opportunity by geography ($ million)
Data Tables on Market opportunity by geography ($ million)

13. Drivers, Challenges, and Opportunity

13.1 Market drivers

Regulatory frameworks and global decarbonization mandates
Rising global energy prices and economic imperative for cost management
Technological innovation and rise of intelligent building systems

13.2 Market challenges

High initial capital expenditure and financing barriers
Complex regulatory frameworks and absence of technical standardization
Supply chain vulnerabilities and technological integration obstacles

13.3 Impact of drivers and challenges

Impact of drivers and challenges in 2025 and 2030

13.4 Market opportunities

Proliferation of digital twins and AI in operational optimization
Transition toward comprehensive electrification and advanced heat pump integration
Emergence of energy as service and performance based financing frameworks

14. Competitive Landscape

14.1 Overview

14.2

Overview on criticality of inputs and factors of differentiation

14.3 Landscape disruption

Overview on factors of disruption

14.4 Industry risks

Impact of key risks on business

15. Competitive Analysis

15.1 Companies profiled

Companies covered

15.2 Company ranking index

15.3 Market positioning of companies

Matrix on companies position and classification

15.4 ABB Ltd.

ABB Ltd. - Overview
ABB Ltd. - Business segments
ABB Ltd. - Key news
ABB Ltd. - Key offerings
ABB Ltd. - Segment focus
SWOT

15.5 Carrier Global Corp.

Carrier Global Corp. - Overview
Carrier Global Corp. - Business segments
Carrier Global Corp. - Key news
Carrier Global Corp. - Key offerings
Carrier Global Corp. - Segment focus
SWOT

15.6 Compagnie de Saint Gobain SA

Compagnie de Saint Gobain SA - Overview
Compagnie de Saint Gobain SA - Business segments
Compagnie de Saint Gobain SA - Key offerings
Compagnie de Saint Gobain SA - Segment focus
SWOT

15.7 Daikin Industries Ltd.

Daikin Industries Ltd. - Overview
Daikin Industries Ltd. - Business segments
Daikin Industries Ltd. - Key news
Daikin Industries Ltd. - Key offerings
Daikin Industries Ltd. - Segment focus
SWOT

15.8 Danfoss AS

Danfoss AS - Overview
Danfoss AS - Product / Service
Danfoss AS - Key offerings
SWOT

15.9 Eaton Corp. Plc

Eaton Corp. Plc - Overview
Eaton Corp. Plc - Business segments
Eaton Corp. Plc - Key news
Eaton Corp. Plc - Key offerings
Eaton Corp. Plc - Segment focus
SWOT

15.10 Emerson Electric Co.

Emerson Electric Co. - Overview
Emerson Electric Co. - Business segments
Emerson Electric Co. - Key news
Emerson Electric Co. - Key offerings
Emerson Electric Co. - Segment focus
SWOT

15.11 ENGIE SA

ENGIE SA - Overview
ENGIE SA - Business segments
ENGIE SA - Key news
ENGIE SA - Key offerings
ENGIE SA - Segment focus
SWOT

15.12 Honeywell International Inc.

Honeywell International Inc. - Overview
Honeywell International Inc. - Business segments
Honeywell International Inc. - Key news
Honeywell International Inc. - Key offerings
Honeywell International Inc. - Segment focus
SWOT

15.13 Johnson Controls International

Johnson Controls International - Overview
Johnson Controls International - Business segments
Johnson Controls International - Key news
Johnson Controls International - Key offerings
Johnson Controls International - Segment focus
SWOT

15.14 Kingspan Group Plc

Kingspan Group Plc - Overview
Kingspan Group Plc - Business segments
Kingspan Group Plc - Key offerings
Kingspan Group Plc - Segment focus
SWOT

15.15 Mitsubishi Electric Corp.

Mitsubishi Electric Corp. - Overview
Mitsubishi Electric Corp. - Business segments
Mitsubishi Electric Corp. - Key offerings
Mitsubishi Electric Corp. - Segment focus
SWOT

15.16 Schneider Electric SE

Schneider Electric SE - Overview
Schneider Electric SE - Business segments
Schneider Electric SE - Key news
Schneider Electric SE - Key offerings
Schneider Electric SE - Segment focus
SWOT

15.17 Siemens AG

Siemens AG - Overview
Siemens AG - Business segments
Siemens AG - Key news
Siemens AG - Key offerings
Siemens AG - Segment focus
SWOT

15.18 Trane Technologies Plc

Trane Technologies Plc - Overview
Trane Technologies Plc - Business segments
Trane Technologies Plc - Key offerings
Trane Technologies Plc - Segment focus
SWOT

16. Appendix

16.1 Scope of the report

Market definition
Objectives
Notes and caveats

16.2 Inclusions and exclusions checklist

Inclusions checklist
Exclusions checklist

16.3 Currency conversion rates for US$

16.4 Research methodology

16.5 Data procurement

Information sources

16.6 Data validation

16.7 Validation techniques employed for market sizing

16.8 Data synthesis

16.9 360 degree market analysis

16.10 List of abbreviations

Research Methodology

Technavio presents a detailed picture of the market by way of study, synthesis, and summation of data from multiple sources. The analysts have presented the various facets of the market with a particular focus on identifying the key industry influencers. The data thus presented is comprehensive, reliable, and the result of extensive research, both primary and secondary.

INFORMATION SOURCES

Primary sources

  • Manufacturers and suppliers
  • Channel partners
  • Industry experts
  • Strategic decision makers

Secondary sources

  • Industry journals and periodicals
  • Government data
  • Financial reports of key industry players
  • Historical data
  • Press releases

DATA ANALYSIS

Data Synthesis

  • Collation of data
  • Estimation of key figures
  • Analysis of derived insights

Data Validation

  • Triangulation with data models
  • Reference against proprietary databases
  • Corroboration with industry experts

REPORT WRITING

Qualitative

  • Market drivers
  • Market challenges
  • Market trends
  • Five forces analysis

Quantitative

  • Market size and forecast
  • Market segmentation
  • Geographical insights
  • Competitive landscape

Interested in this report?

Get your sample now to see our research methodology and insights!

Download Now

Frequently Asked Questions

Energy Retrofit Systems market growth will increase by USD 40977.0 million during 2026-2030.

The Energy Retrofit Systems market is expected to grow at a CAGR of 5% during 2026-2030.

Energy Retrofit Systems market is segmented by Application (Non-residential, Residential) Product (HVAC retrofit, Envelope, LED retrofit lighting) Type (Quick wins retrofit, Deep retrofit)

ABB Ltd., Acuity Brands Inc., Ameresco Inc., BELIMO Holding AG, Carrier Global Corp., Compagnie de Saint Gobain SA, Daikin Industries Ltd., Danfoss AS, Eaton Corp. Plc, Emerson Electric Co., ENGIE SA, Honeywell International Inc., Johnson Controls International, Kingspan Group Plc, Mitsubishi Electric Corp., S.A. Armstrong Ltd., Schneider Electric SE, Siemens AG, Signify NV, Trane Technologies Plc are a few of the key vendors in the Energy Retrofit Systems market.

Europe will register the highest growth rate of 33.5% among the other regions. Therefore, the Energy Retrofit Systems market in Europe is expected to garner significant business opportunities for the vendors during the forecast period.

Germany, UK, France, Italy, Spain, The Netherlands, China, India, Japan, South Korea, Australia, Indonesia, US, Canada, Mexico, Saudi Arabia, UAE, South Africa, Egypt, Turkey, Brazil, Argentina, Chile

  • Regulatory frameworks and global decarbonization mandates is the driving factor this market.

The Energy Retrofit Systems market vendors should focus on grabbing business opportunities from the Application segment as it accounted for the largest market share in the base year.
RIA - Research AI Assistant
Ask RIA
