Equestrian Protective Clothing Market Analysis Europe, North America, APAC, South America, Middle East and Africa - US, Australia, UK, France, Germany - Size and Forecast 2024-2028

Equestrian Protective Clothing Market Analysis Europe, North America, APAC, South America, Middle East and Africa - US, Australia, UK, France, Germany - Size and Forecast 2024-2028

Published: Jan 2024 158 Pages SKU: IRTNTR73045

Market Overview at a Glance

$492.62 Mn
Market Opportunity
3.38%
CAGR
3.13
YoY growth 2023-2024(%)

Equestrian Protective Clothing Market Size 2024-2028 

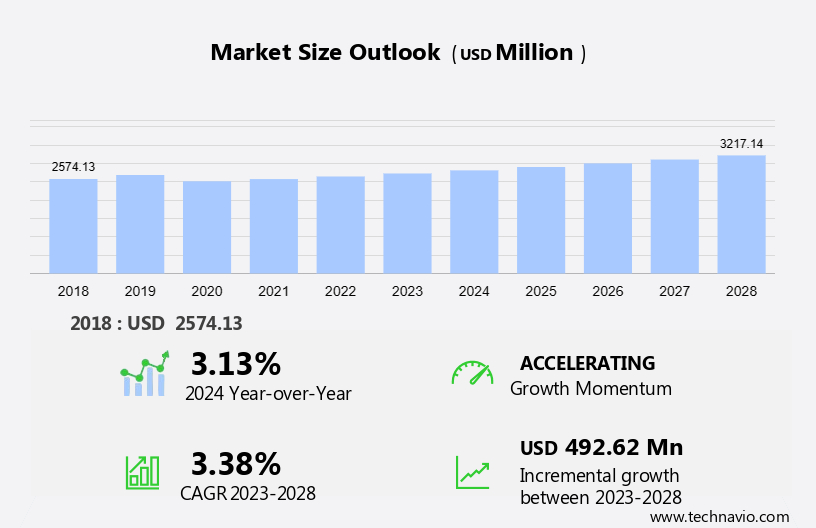
The equestrian protective clothing market size is forecast to increase by USD 492.62 million at a CAGR of 3.38% between 2023 and 2028.

  • The market is experiencing significant growth due to several key factors. One major trend driving market growth is the increasing awareness and popularity of equestrian events, which has led to a rise in participation and spectatorship. Another factor is the growing number of start-ups specializing in equestrian clothing and sports equipment, offering innovative textile designs and advanced protective features. Furthermore, the risk of severe injuries and fatalities in equestrian sports has heightened the importance of wearing proper protective clothing. These factors are expected to continue fueling market growth In the coming years. Additionally, advancements in materials technology and increasing consumer preference for comfort and style are also influencing market trends. Overall, the market is poised for strong growth, offering numerous opportunities for market participants.

What will be the Size of the Equestrian Protective Clothing Market During the Forecast Period?

Equestrian Protective Clothing Market Size

 Request Free Sample

  • The market caters to the needs of horse riders, prioritizing both comfort and safety In their apparel. Riding breeches and specialized footwear are essential components of this market, offering superior protection during equestrian sports and horse riding activities. Aesthetic appeal also plays a significant role, with many riders seeking high-end equestrian apparel that reflects their status as fashion icons. Sustainable materials are increasingly gaining popularity In the equestrian clothing sector, as riders and consumers become more conscious of their environmental impact.
  • Protective gear, including vests, gloves, and helmets, are essential safety measures for professional and leisure riders alike. The ecommerce sector and online retail have significantly impacted the equestrian clothing market, providing riders with easy access to a wide range of protective clothing options. Equestrian events continue to drive demand for specialized equestrian apparel, with riders seeking the best protective clothing to ensure their safety and comfort during competitions. Overall, the market is a dynamic and growing sector, catering to the unique needs of horse riders and the equestrian community.

How is this Equestrian Protective Clothing Industry segmented and which is the largest segment?

The equestrian protective clothing industry research report provides comprehensive data (region-wise segment analysis), with forecasts and estimates in "USD million" for the period 2024-2028, as well as historical data from 2018-2022 for the following segments.
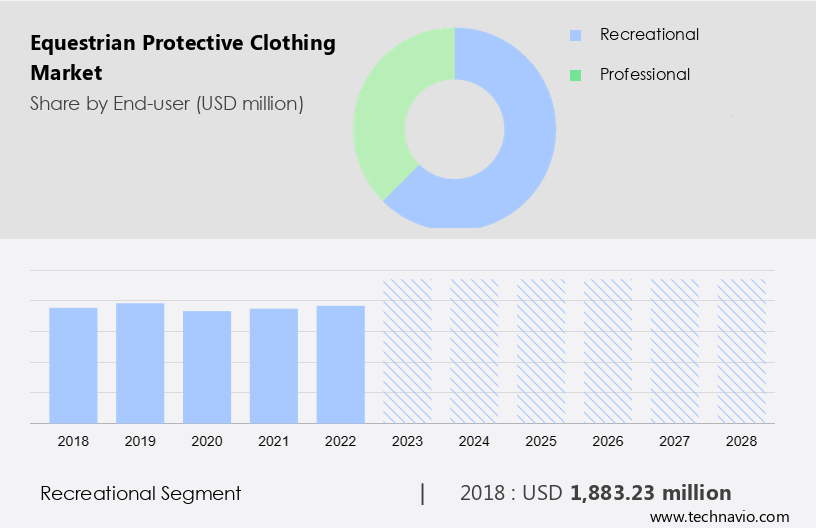
  • End-user
    • Recreational
    • Professional
  • Product
    • Clothing
    • Boots
    • Helmets
    • Others
  • Geography
    • Europe
      • Germany
      • UK
      • France
    • North America
      • US
    • APAC
    • South America
    • Middle East and Africa

By End-user Insights

  • The recreational segment is estimated to witness significant growth during the forecast period.

The recreational segment is the primary growth driver In the market. Equestrian enthusiasts prioritize safety and comfort while participating in recreational horseback riding, leading to increased demand for protective apparel. Innovative companies, such as Ariat, cater to this segment with specialized riding helmets, body protectors, and stylish riding gloves that adhere to safety regulations. As the popularity of recreational equestrian activities expands globally, so does the importance of rider safety. This trend is fueling the demand for eco-friendly riding gear made from ethically sourced materials and sustainable manufacturing processes.

The market is experiencing significant growth due to these factors, creating a favorable market scenario for continued expansion In the recreational segment.

Equestrian Protective Clothing Market Size

Get a glance at the  Equestrian Protective Clothing Industry report of share of various segments Request Free Sample

The recreational segment was valued at USD 1.88 billion in 2018 and showed a gradual increase during the forecast period.

Regional Analysis

  • North America is estimated to contribute 35% to the growth of the global market during the forecast period.

Technavio's analysts have elaborately explained the regional trends and drivers that shape the market during the forecast period.

Equestrian Protective Clothing Market Share by Geography

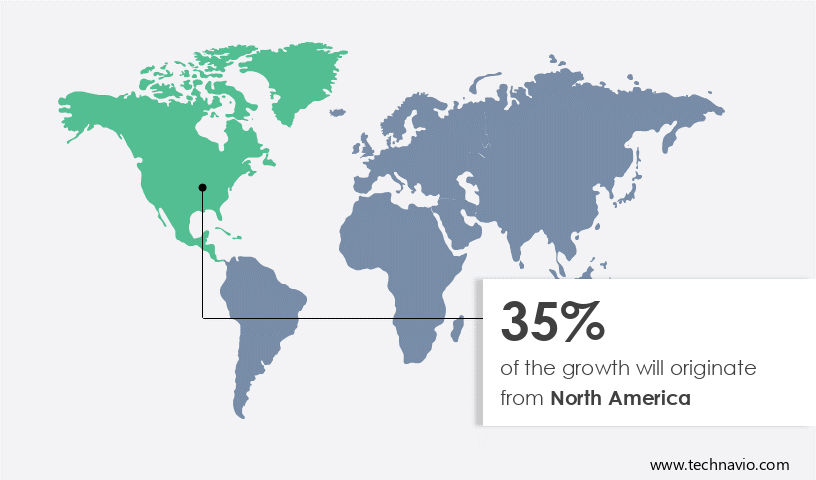
For more insights on the market share of various regions, Request Free Sample

The European market is experiencing growth due to the region's popularity as a top tourist destination for equestrian activities. With an increasing number of women In the workforce and the availability of world-class equestrian facilities, the market is poised for significant expansion. Equestrianism, a luxurious leisure activity, has seen a resurgence in Europe since the post-World War II era. The region's picturesque landscapes and skilled instructors attract both professional and recreational participants. Equestrian clothing, which ensures safety measures for riders, is a crucial component of this recreational activity. The European market for equestrian protective clothing offers ample opportunities for growth In the coming years.

Market Dynamics

Our equestrian protective clothing market researchers analyzed the data with 2023 as the base year, along with the key drivers, trends, and challenges. A holistic analysis of drivers will help companies refine their marketing strategies to gain a competitive advantage.

What are the key market drivers leading to the rise In the adoption of Equestrian Protective Clothing Industry?

Growing awareness and popularity of equestrian events is the key driver of the market.

  • The market caters to the needs of horse riders seeking comfort, safety, and aesthetic appeal during their participation in equestrian sports. This market encompasses specialized footwear, riding breeches, protective gear, helmets, boots, gloves, and other apparel for both males and females. With a growing emphasis on sustainable materials, eco-friendly riding gear made from ethically sourced materials and sustainable manufacturing processes is gaining popularity among riders. Equestrian culture, including recreational and competitive events, attracts a wide range of riders, from professional participants to leisure enthusiasts. These events, such as the Paris 2024 Olympics, showcase the fusion of fashion and function in equestrian apparel.
  • Performance-oriented fabrics, moisture-wicking, and UV protection are essential features for riders seeking optimal comfort and safety. Innovative fabric choices and stylish designs cater to the fashion-conscious rider, while safety measures like impact-resistant vests and helms protect against head injuries, falls, and collisions. The equestrian clothing market is accessible through various channels, including online retail platforms, brick-and-mortar stores, and the eCommerce sector. The market's growth is driven by the increasing popularity of horse riding as a luxurious leisure activity, the affordability and accessibility of protective clothing, and the durability and brand reputation of high-end equestrian apparel. The market is expected to continue its growth trajectory, catering to the diverse needs of riders worldwide.

What are the market trends shaping the Equestrian Protective Clothing Industry?

A growing number of start-ups for equestrian clothing is the upcoming market trend.

  • The market caters to the needs of horse riders seeking comfort, safety, and aesthetic appeal In their apparel. This market encompasses specialized footwear, protective gear, and high-end equestrian apparel for both males and females. Innovative fabric choices, such as moisture-wicking and UV protection, ensure rider safety and performance-oriented functionality. Sustainable materials and manufacturing processes are increasingly popular, with eco-friendly riding gear and ethically sourced materials gaining environmental consciousness among consumers. As equestrian sports continue to grow in popularity, particularly among elites, start-ups have emerged to address the demand for stylish, protective, and sustainable clothing. 
  • Their range includes riding bodysuits and pants that offer both style and functionality, made from high-tech, performance-oriented fabrics. The equestrian culture attracts a diverse range of participants, from recreational riders to professional participants, who value affordability, accessibility, and durability. Online retail channels and digital platforms have made it easier for riders to access these products, with eCommerce sector growth fueling the market's expansion. Brands prioritize brand reputation, textile technology, and sustainability to cater to the evolving needs of riders, who seek both comfort and protection for their feet, lower legs, and head during equestrian events and leisure activities.

What challenges does the Equestrian Protective Clothing Industry face during its growth?

The risk of severe injuries and fatalities in equestrian sports is a key challenge affecting the industry's growth.

  • Equestrian protective clothing is a crucial segment of the equestrian industry, prioritizing both comfort and safety for horse riders. This market caters to male and female riders, offering specialized footwear, riding breeches, protective gear, helmets, boots, gloves, and show jackets. The demand for eco-friendly riding gear made from sustainable materials and ethically sourced materials is increasing due to growing environmental consciousness among consumers. Innovative fabric choices and sustainable manufacturing processes ensure both performance-oriented fabrics and stylish designs. Equestrian sports enthusiasts, including recreational and professional riders, require protective clothing for competitive events and leisure activities. Equestrian culture values safety measures, with rider safety being a primary concern.
  • Impact-resistant vests and helmets are essential protective gear for riders to prevent head injuries during falls or collisions. The market is accessible through various channels, including online retail and brick-and-mortar stores. Online platforms and eCommerce sector have gained popularity due to their affordability, accessibility, and convenience. Luxurious leisure activity participants seek high-end equestrian apparel, which is often performance-oriented, moisture-wicking, and offers UV protection. The market's growth is influenced by factors such as the increasing popularity of equestrian sports, the need for rider safety, and the fusion of fashion and equestrian clothing. Performance-oriented fabrics, stylish designs, and sustainable manufacturing processes are essential aspects of this market.

Exclusive Customer Landscape

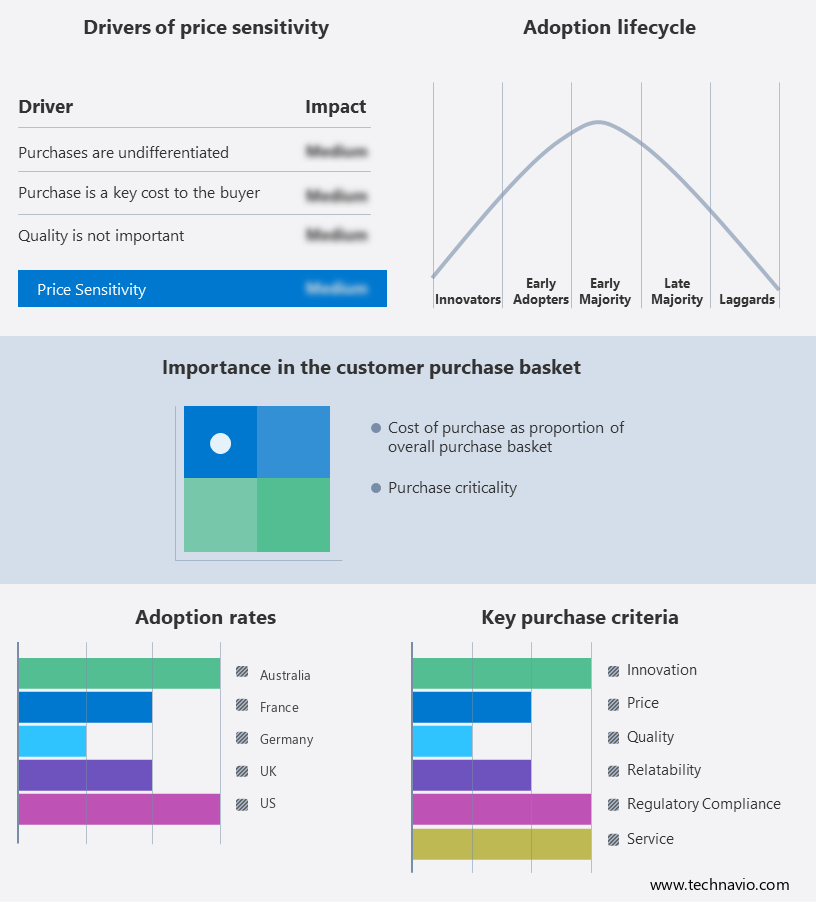
The equestrian protective clothing market forecasting report includes the adoption lifecycle of the market, covering from the innovator's stage to the laggard's stage. It focuses on adoption rates in different regions based on penetration. Furthermore, the equestrian protective clothing market report also includes key purchase criteria and drivers of price sensitivity to help companies evaluate and develop their market growth analysis strategies.

Equestrian Protective Clothing Market Share by Geography

 Customer Landscape

Key Companies & Market Insights

Companies are implementing various strategies, such as strategic alliances, equestrian protective clothing market forecast, partnerships, mergers and acquisitions, geographical expansion, and product/service launches, to enhance their presence In the industry. The industry research and growth report includes detailed analyses of the competitive landscape of the market and information about key companies, including:

  • Ariat International Inc.
  • CASCO International GmbH
  • Dainese Spa
  • Decathlon SA
  • Devon Aire
  • English Riding Supply Inc
  • GPA
  • Guccio Gucci Spa
  • Hermes International SA
  • HKM Sports Equipment GmbH
  • Horseware Products Ltd.
  • KAVAL INC
  • KEP ITALIA
  • Kerrits Equestrian Apparel Inc.
  • Ladyhall Ltd.
  • Mompso
  • My Breeches ltd.
  • Parlanti International
  • Ralph Lauren Corp.
  • Shanghai Goldtex Clothing and Bags Co. Ltd.
  • SSG Gloves
  • Tredstep
  • Vestrum srl
  • UVEX WINTER HOLDING GmbH and Co. KG

Qualitative and quantitative analysis of companies has been conducted to help clients understand the wider business environment as well as the strengths and weaknesses of key industry players. Data is qualitatively analyzed to categorize companies as pure play, category-focused, industry-focused, and diversified; it is quantitatively analyzed to categorize companies as dominant, leading, strong, tentative, and weak.

Research Analyst Overview

Equestrian protective clothing has become an essential aspect of the riding experience, prioritizing both comfort and safety for horse riders. This market caters to a diverse range of participants, from recreational riders to professional competitors, and offers specialized footwear, riding breeches, helmets, gloves, and other protective gear. The equestrian apparel industry places great emphasis on aesthetic appeal, ensuring that functional protective clothing also maintains a stylish image. Equestrian culture values sustainability, with many riders seeking eco-friendly riding gear made from ethically sourced materials and sustainable manufacturing processes. Innovative fabric choices and performance-oriented features, such as moisture-wicking and UV protection, enhance the riding experience and contribute to rider safety.

Moreover, equestrian clothing has evolved to include impact-resistant vests, designed to protect the torso during falls or collisions. The equestrian sports community is a significant market for protective clothing, with a strong emphasis on safety measures. Helmets, boots, and gloves are essential protective gear for riders, particularly those participating in competitive events. Equestrian fashion has also gained popularity, with many riders seeking stylish designs that reflect their style and identity. The ecommerce sector has significantly impacted the equestrian apparel market, with online platforms offering affordability, accessibility, and convenience. Brick-and-mortar stores continue to play a role, providing a tactile shopping experience and catering to riders who prefer to try on clothing before purchasing.

Furthermore, the equestrian clothing market offers a wide range of options for both male and female riders, with a focus on performance-oriented fabrics and athletic cuts. Female riders often seek feminine sportswear that accommodates their unique needs, while male riders prioritize durability and brand reputation. The equestrian clothing market is a growing industry, with a strong focus on safety, sustainability, and innovation. Riding enthusiasts, from recreational riders to professional participants, continue to seek out high-quality protective clothing that enhances their riding experience and prioritizes their safety.

Equestrian Protective Clothing Market Scope

Report Coverage

Details

Page number

158

Base year

2023

Historic period

2018-2022

Forecast period

2024-2028

Growth momentum & CAGR

Accelerate at a CAGR of 3.38%

Market Growth 2024-2028

USD 492.62 million

Market structure

Fragmented

YoY growth 2023-2024(%)

3.13

Key countries

US, Australia, UK, France, and Germany

Competitive landscape

Leading Companies, Market Positioning of Companies, Competitive Strategies, and Industry Risks

Request Free Sample

What are the Key Data Covered in this Equestrian Protective Clothing Market Research and Growth Report?

  • CAGR of the Equestrian Protective Clothing industry during the forecast period
  • Detailed information on factors that will drive the Equestrian Protective Clothing growth and forecasting between 2024 and 2028
  • Precise estimation of the size of the market and its contribution of the industry in focus to the parent market
  • Accurate predictions about upcoming growth and trends and changes in consumer behaviour
  • Growth of the market across Europe, North America, APAC, South America, and Middle East and Africa
  • Thorough analysis of the market's competitive landscape and detailed information about companies
  • Comprehensive analysis of factors that will challenge the equestrian protective clothing market growth of industry companies

We can help! Our analysts can customize this equestrian protective clothing market research report to meet your requirements.

Get in touch

1 Executive Summary

  • 1.1 Market overview
    • Exhibit 01: Executive Summary – Chart on Market Overview
    • Exhibit 02: Executive Summary – Data Table on Market Overview
    • Exhibit 03: Executive Summary – Chart on Global Market Characteristics
    • Exhibit 04: Executive Summary – Chart on Market by Geography
    • Exhibit 05: Executive Summary – Chart on Market Segmentation by End-user
    • Exhibit 06: Executive Summary – Chart on Market Segmentation by Product
    • Exhibit 07: Executive Summary – Chart on Incremental Growth
    • Exhibit 08: Executive Summary – Data Table on Incremental Growth
    • Exhibit 09: Executive Summary – Chart on Vendor Market Positioning

2 Market Landscape

  • 2.1 Market ecosystem
    • Exhibit 10: Parent market
    • Exhibit 11: Market Characteristics

3 Market Sizing

  • 3.1 Market definition
    • Exhibit 12: Offerings of vendors included in the market definition
  • 3.2 Market segment analysis
    • Exhibit 13: Market segments
  • 3.3 Market size 2023
    • 3.4 Market outlook: Forecast for 2023-2028
      • Exhibit 14: Chart on Global - Market size and forecast 2023-2028 ($ million)
      • Exhibit 15: Data Table on Global - Market size and forecast 2023-2028 ($ million)
      • Exhibit 16: Chart on Global Market: Year-over-year growth 2023-2028 (%)
      • Exhibit 17: Data Table on Global Market: Year-over-year growth 2023-2028 (%)

    4 Historic Market Size

    • 4.1 Global equestrian protective clothing market 2018 - 2022
      • Exhibit 18: Historic Market Size – Data Table on global equestrian protective clothing market 2018 - 2022 ($ million)
    • 4.2 End-user Segment Analysis 2018 - 2022
      • Exhibit 19: Historic Market Size – End-user Segment 2018 - 2022 ($ million)
    • 4.3 Product Segment Analysis 2018 - 2022
      • Exhibit 20: Historic Market Size – Product Segment 2018 - 2022 ($ million)
    • 4.4 Geography Segment Analysis 2018 - 2022
      • Exhibit 21: Historic Market Size – Geography Segment 2018 - 2022 ($ million)
    • 4.5 Country Segment Analysis 2018 - 2022
      • Exhibit 22: Historic Market Size – Country Segment 2018 - 2022 ($ million)

    5 Five Forces Analysis

    • 5.1 Five forces summary
      • Exhibit 23: Five forces analysis - Comparison between 2023 and 2028
    • 5.2 Bargaining power of buyers
      • Exhibit 24: Chart on Bargaining power of buyers – Impact of key factors 2023 and 2028
    • 5.3 Bargaining power of suppliers
      • Exhibit 25: Bargaining power of suppliers – Impact of key factors in 2023 and 2028
    • 5.4 Threat of new entrants
      • Exhibit 26: Threat of new entrants – Impact of key factors in 2023 and 2028
    • 5.5 Threat of substitutes
      • Exhibit 27: Threat of substitutes – Impact of key factors in 2023 and 2028
    • 5.6 Threat of rivalry
      • Exhibit 28: Threat of rivalry – Impact of key factors in 2023 and 2028
    • 5.7 Market condition
      • Exhibit 29: Chart on Market condition - Five forces 2023 and 2028

    6 Market Segmentation by End-user

    • 6.1 Market segments
      • Exhibit 30: Chart on End-user - Market share 2023-2028 (%)
      • Exhibit 31: Data Table on End-user - Market share 2023-2028 (%)
    • 6.2 Comparison by End-user
      • Exhibit 32: Chart on Comparison by End-user
      • Exhibit 33: Data Table on Comparison by End-user
    • 6.3 Recreational - Market size and forecast 2023-2028
      • Exhibit 34: Chart on Recreational - Market size and forecast 2023-2028 ($ million)
      • Exhibit 35: Data Table on Recreational - Market size and forecast 2023-2028 ($ million)
      • Exhibit 36: Chart on Recreational - Year-over-year growth 2023-2028 (%)
      • Exhibit 37: Data Table on Recreational - Year-over-year growth 2023-2028 (%)
    • 6.4 Professional - Market size and forecast 2023-2028
      • Exhibit 38: Chart on Professional - Market size and forecast 2023-2028 ($ million)
      • Exhibit 39: Data Table on Professional - Market size and forecast 2023-2028 ($ million)
      • Exhibit 40: Chart on Professional - Year-over-year growth 2023-2028 (%)
      • Exhibit 41: Data Table on Professional - Year-over-year growth 2023-2028 (%)
    • 6.5 Market opportunity by End-user
      • Exhibit 42: Market opportunity by End-user ($ million)
      • Exhibit 43: Data Table on Market opportunity by End-user ($ million)

    7 Market Segmentation by Product

    • 7.1 Market segments
      • Exhibit 44: Chart on Product - Market share 2023-2028 (%)
      • Exhibit 45: Data Table on Product - Market share 2023-2028 (%)
    • 7.2 Comparison by Product
      • Exhibit 46: Chart on Comparison by Product
      • Exhibit 47: Data Table on Comparison by Product
    • 7.3 Clothing - Market size and forecast 2023-2028
      • Exhibit 48: Chart on Clothing - Market size and forecast 2023-2028 ($ million)
      • Exhibit 49: Data Table on Clothing - Market size and forecast 2023-2028 ($ million)
      • Exhibit 50: Chart on Clothing - Year-over-year growth 2023-2028 (%)
      • Exhibit 51: Data Table on Clothing - Year-over-year growth 2023-2028 (%)
    • 7.4 Boots - Market size and forecast 2023-2028
      • Exhibit 52: Chart on Boots - Market size and forecast 2023-2028 ($ million)
      • Exhibit 53: Data Table on Boots - Market size and forecast 2023-2028 ($ million)
      • Exhibit 54: Chart on Boots - Year-over-year growth 2023-2028 (%)
      • Exhibit 55: Data Table on Boots - Year-over-year growth 2023-2028 (%)
    • 7.5 Helmets - Market size and forecast 2023-2028
      • Exhibit 56: Chart on Helmets - Market size and forecast 2023-2028 ($ million)
      • Exhibit 57: Data Table on Helmets - Market size and forecast 2023-2028 ($ million)
      • Exhibit 58: Chart on Helmets - Year-over-year growth 2023-2028 (%)
      • Exhibit 59: Data Table on Helmets - Year-over-year growth 2023-2028 (%)
    • 7.6 Others - Market size and forecast 2023-2028
      • Exhibit 60: Chart on Others - Market size and forecast 2023-2028 ($ million)
      • Exhibit 61: Data Table on Others - Market size and forecast 2023-2028 ($ million)
      • Exhibit 62: Chart on Others - Year-over-year growth 2023-2028 (%)
      • Exhibit 63: Data Table on Others - Year-over-year growth 2023-2028 (%)
    • 7.7 Market opportunity by Product
      • Exhibit 64: Market opportunity by Product ($ million)
      • Exhibit 65: Data Table on Market opportunity by Product ($ million)

    8 Customer Landscape

    • 8.1 Customer landscape overview
      • Exhibit 66: Analysis of price sensitivity, lifecycle, customer purchase basket, adoption rates, and purchase criteria

    9 Geographic Landscape

    • 9.1 Geographic segmentation
      • Exhibit 67: Chart on Market share by geography 2023-2028 (%)
      • Exhibit 68: Data Table on Market share by geography 2023-2028 (%)
    • 9.2 Geographic comparison
      • Exhibit 69: Chart on Geographic comparison
      • Exhibit 70: Data Table on Geographic comparison
    • 9.3 Europe - Market size and forecast 2023-2028
      • Exhibit 71: Chart on Europe - Market size and forecast 2023-2028 ($ million)
      • Exhibit 72: Data Table on Europe - Market size and forecast 2023-2028 ($ million)
      • Exhibit 73: Chart on Europe - Year-over-year growth 2023-2028 (%)
      • Exhibit 74: Data Table on Europe - Year-over-year growth 2023-2028 (%)
    • 9.4 North America - Market size and forecast 2023-2028
      • Exhibit 75: Chart on North America - Market size and forecast 2023-2028 ($ million)
      • Exhibit 76: Data Table on North America - Market size and forecast 2023-2028 ($ million)
      • Exhibit 77: Chart on North America - Year-over-year growth 2023-2028 (%)
      • Exhibit 78: Data Table on North America - Year-over-year growth 2023-2028 (%)
    • 9.5 APAC - Market size and forecast 2023-2028
      • Exhibit 79: Chart on APAC - Market size and forecast 2023-2028 ($ million)
      • Exhibit 80: Data Table on APAC - Market size and forecast 2023-2028 ($ million)
      • Exhibit 81: Chart on APAC - Year-over-year growth 2023-2028 (%)
      • Exhibit 82: Data Table on APAC - Year-over-year growth 2023-2028 (%)
    • 9.6 South America - Market size and forecast 2023-2028
      • Exhibit 83: Chart on South America - Market size and forecast 2023-2028 ($ million)
      • Exhibit 84: Data Table on South America - Market size and forecast 2023-2028 ($ million)
      • Exhibit 85: Chart on South America - Year-over-year growth 2023-2028 (%)
      • Exhibit 86: Data Table on South America - Year-over-year growth 2023-2028 (%)
    • 9.7 Middle East and Africa - Market size and forecast 2023-2028
      • Exhibit 87: Chart on Middle East and Africa - Market size and forecast 2023-2028 ($ million)
      • Exhibit 88: Data Table on Middle East and Africa - Market size and forecast 2023-2028 ($ million)
      • Exhibit 89: Chart on Middle East and Africa - Year-over-year growth 2023-2028 (%)
      • Exhibit 90: Data Table on Middle East and Africa - Year-over-year growth 2023-2028 (%)
    • 9.8 US - Market size and forecast 2023-2028
      • Exhibit 91: Chart on US - Market size and forecast 2023-2028 ($ million)
      • Exhibit 92: Data Table on US - Market size and forecast 2023-2028 ($ million)
      • Exhibit 93: Chart on US - Year-over-year growth 2023-2028 (%)
      • Exhibit 94: Data Table on US - Year-over-year growth 2023-2028 (%)
    • 9.9 UK - Market size and forecast 2023-2028
      • Exhibit 95: Chart on UK - Market size and forecast 2023-2028 ($ million)
      • Exhibit 96: Data Table on UK - Market size and forecast 2023-2028 ($ million)
      • Exhibit 97: Chart on UK - Year-over-year growth 2023-2028 (%)
      • Exhibit 98: Data Table on UK - Year-over-year growth 2023-2028 (%)
    • 9.10 France - Market size and forecast 2023-2028
      • Exhibit 99: Chart on France - Market size and forecast 2023-2028 ($ million)
      • Exhibit 100: Data Table on France - Market size and forecast 2023-2028 ($ million)
      • Exhibit 101: Chart on France - Year-over-year growth 2023-2028 (%)
      • Exhibit 102: Data Table on France - Year-over-year growth 2023-2028 (%)
    • 9.11 Germany - Market size and forecast 2023-2028
      • Exhibit 103: Chart on Germany - Market size and forecast 2023-2028 ($ million)
      • Exhibit 104: Data Table on Germany - Market size and forecast 2023-2028 ($ million)
      • Exhibit 105: Chart on Germany - Year-over-year growth 2023-2028 (%)
      • Exhibit 106: Data Table on Germany - Year-over-year growth 2023-2028 (%)
    • 9.12 Australia - Market size and forecast 2023-2028
      • Exhibit 107: Chart on Australia - Market size and forecast 2023-2028 ($ million)
      • Exhibit 108: Data Table on Australia - Market size and forecast 2023-2028 ($ million)
      • Exhibit 109: Chart on Australia - Year-over-year growth 2023-2028 (%)
      • Exhibit 110: Data Table on Australia - Year-over-year growth 2023-2028 (%)
    • 9.13 Market opportunity by geography
      • Exhibit 111: Market opportunity by geography ($ million)
      • Exhibit 112: Data Tables on Market opportunity by geography ($ million)

    10 Drivers, Challenges, and Trends

    • 10.1 Market drivers
      • 10.2 Market challenges
        • 10.3 Impact of drivers and challenges
          • Exhibit 113: Impact of drivers and challenges in 2023 and 2028
        • 10.4 Market trends

          11 Vendor Landscape

          • 11.1 Overview
            • 11.2 Vendor landscape
              • Exhibit 114: Overview on Criticality of inputs and Factors of differentiation
            • 11.3 Landscape disruption
              • Exhibit 115: Overview on factors of disruption
            • 11.4 Industry risks
              • Exhibit 116: Impact of key risks on business

            12 Vendor Analysis

            • 12.1 Vendors covered
              • Exhibit 117: Vendors covered
            • 12.2 Market positioning of vendors
              • Exhibit 118: Matrix on vendor position and classification
            • 12.3 Ariat International Inc.
              • Exhibit 119: Ariat International Inc. - Overview
              • Exhibit 120: Ariat International Inc. - Product / Service
              • Exhibit 121: Ariat International Inc. - Key offerings
            • 12.4 CASCO International GmbH
              • Exhibit 122: CASCO International GmbH - Overview
              • Exhibit 123: CASCO International GmbH - Product / Service
              • Exhibit 124: CASCO International GmbH - Key offerings
            • 12.5 Dainese Spa
              • Exhibit 125: Dainese Spa - Overview
              • Exhibit 126: Dainese Spa - Product / Service
              • Exhibit 127: Dainese Spa - Key offerings
            • 12.6 Decathlon SA
              • Exhibit 128: Decathlon SA - Overview
              • Exhibit 129: Decathlon SA - Product / Service
              • Exhibit 130: Decathlon SA - Key offerings
            • 12.7 Devon Aire
              • Exhibit 131: Devon Aire - Overview
              • Exhibit 132: Devon Aire - Product / Service
              • Exhibit 133: Devon Aire - Key offerings
            • 12.8 English Riding Supply Inc
              • Exhibit 134: English Riding Supply Inc - Overview
              • Exhibit 135: English Riding Supply Inc - Product / Service
              • Exhibit 136: English Riding Supply Inc - Key offerings
            • 12.9 GPA
              • Exhibit 137: GPA - Overview
              • Exhibit 138: GPA - Product / Service
              • Exhibit 139: GPA - Key offerings
            • 12.10 HKM Sports Equipment GmbH
              • Exhibit 140: HKM Sports Equipment GmbH - Overview
              • Exhibit 141: HKM Sports Equipment GmbH - Product / Service
              • Exhibit 142: HKM Sports Equipment GmbH - Key offerings
            • 12.11 Horseware Products Ltd.
              • Exhibit 143: Horseware Products Ltd. - Overview
              • Exhibit 144: Horseware Products Ltd. - Product / Service
              • Exhibit 145: Horseware Products Ltd. - Key offerings
            • 12.12 KEP ITALIA
              • Exhibit 146: KEP ITALIA - Overview
              • Exhibit 147: KEP ITALIA - Product / Service
              • Exhibit 148: KEP ITALIA - Key offerings
            • 12.13 Kerrits Equestrian Apparel Inc.
              • Exhibit 149: Kerrits Equestrian Apparel Inc. - Overview
              • Exhibit 150: Kerrits Equestrian Apparel Inc. - Product / Service
              • Exhibit 151: Kerrits Equestrian Apparel Inc. - Key offerings
            • 12.14 Ladyhall Ltd.
              • Exhibit 152: Ladyhall Ltd. - Overview
              • Exhibit 153: Ladyhall Ltd. - Product / Service
              • Exhibit 154: Ladyhall Ltd. - Key offerings
            • 12.15 My Breeches ltd.
              • Exhibit 155: My Breeches ltd. - Overview
              • Exhibit 156: My Breeches ltd. - Product / Service
              • Exhibit 157: My Breeches ltd. - Key offerings
            • 12.16 Parlanti International
              • Exhibit 158: Parlanti International - Overview
              • Exhibit 159: Parlanti International - Product / Service
              • Exhibit 160: Parlanti International - Key offerings
            • 12.17 UVEX WINTER HOLDING GmbH and Co. KG
              • Exhibit 161: UVEX WINTER HOLDING GmbH and Co. KG - Overview
              • Exhibit 162: UVEX WINTER HOLDING GmbH and Co. KG - Product / Service
              • Exhibit 163: UVEX WINTER HOLDING GmbH and Co. KG - Key offerings

            13 Appendix

            • 13.1 Scope of the report
              • 13.2 Inclusions and exclusions checklist
                • Exhibit 164: Inclusions checklist
                • Exhibit 165: Exclusions checklist
              • 13.3 Currency conversion rates for US$
                • Exhibit 166: Currency conversion rates for US$
              • 13.4 Research methodology
                • Exhibit 167: Research methodology
                • Exhibit 168: Validation techniques employed for market sizing
                • Exhibit 169: Information sources
              • 13.5 List of abbreviations
                • Exhibit 170: List of abbreviations

              Research Methodology

              Technavio presents a detailed picture of the market by way of study, synthesis, and summation of data from multiple sources. The analysts have presented the various facets of the market with a particular focus on identifying the key industry influencers. The data thus presented is comprehensive, reliable, and the result of extensive research, both primary and secondary.

              INFORMATION SOURCES

              Primary sources

              • Manufacturers and suppliers
              • Channel partners
              • Industry experts
              • Strategic decision makers

              Secondary sources

              • Industry journals and periodicals
              • Government data
              • Financial reports of key industry players
              • Historical data
              • Press releases

              DATA ANALYSIS

              Data Synthesis

              • Collation of data
              • Estimation of key figures
              • Analysis of derived insights

              Data Validation

              • Triangulation with data models
              • Reference against proprietary databases
              • Corroboration with industry experts

              REPORT WRITING

              Qualitative

              • Market drivers
              • Market challenges
              • Market trends
              • Five forces analysis

              Quantitative

              • Market size and forecast
              • Market segmentation
              • Geographical insights
              • Competitive landscape

              Interested in this report?

              Get your sample now to see our research methodology and insights!

              Download Now

              Frequently Asked Questions

              Equestrian Protective Clothing market growth will increase by $ 492.62 mn during 2024-2028 .

              The Equestrian Protective Clothing market is expected to grow at a CAGR of 3.38% during 2024-2028 .

              Equestrian Protective Clothing market is segmented by End-user( Recreational, Professional, Helmets, Others) Product( Clothing, Boots, Helmets, Others, Middle East and Africa)

              Ariat International Inc., CASCO International GmbH, Dainese Spa, Decathlon SA, Devon Aire, English Riding Supply Inc, GPA, Guccio Gucci Spa, Hermes International SA, HKM Sports Equipment GmbH, Horseware Products Ltd., KAVAL INC, KEP ITALIA, Kerrits Equestrian Apparel Inc., Ladyhall Ltd., Mompso, My Breeches ltd., Parlanti International, Ralph Lauren Corp., Shanghai Goldtex Clothing and Bags Co. Ltd., SSG Gloves, Tredstep, Vestrum srl, UVEX WINTER HOLDING GmbH and Co. KG are a few of the key vendors in the Equestrian Protective Clothing market.

              North America will register the highest growth rate of 35% among the other regions. Therefore, the Equestrian Protective Clothing market in North America is expected to garner significant business opportunities for the vendors during the forecast period.

              US, Australia, UK, France, Germany

              • Growing awareness and popularity of equestrian eventsEquestrian or horse-riding events are extremely popular among consumers is the driving factor this market.
              • especially among affluent consumers who consider horse riding and its events as a leisure time activity that has a status symbol associated with it. There are a large number of horse-rising events around the world is the driving factor this market.
              • which attract consumers every year. The equestrian events at the Paris 2024 Olympics are set to take place between July 27th and August 6th. In this important sporting event is the driving factor this market.
              • competitors from all over the world will compete in numerous equestrian disciplines is the driving factor this market.
              • showcasing their talent and agility. All these events are expected to witness huge masses in attendance and attract more equestrian enthusiasts to buy protective clothing is the driving factor this market.
              • which is the driving factor this market.
              • in turn is the driving factor this market.
              • will increase the sales of equestrian protective clothing is the driving factor this market.
              • which is the driving factor this market.
              • in turn is the driving factor this market.
              • is expected to drive the growth of the global equestrian protective clothing market during the forecast period. is the driving factor this market.

              The Equestrian Protective Clothing market vendors should focus on grabbing business opportunities from the Recreational segment as it accounted for the largest market share in the base year.