
Sports Equipment Market Size 2025-2029
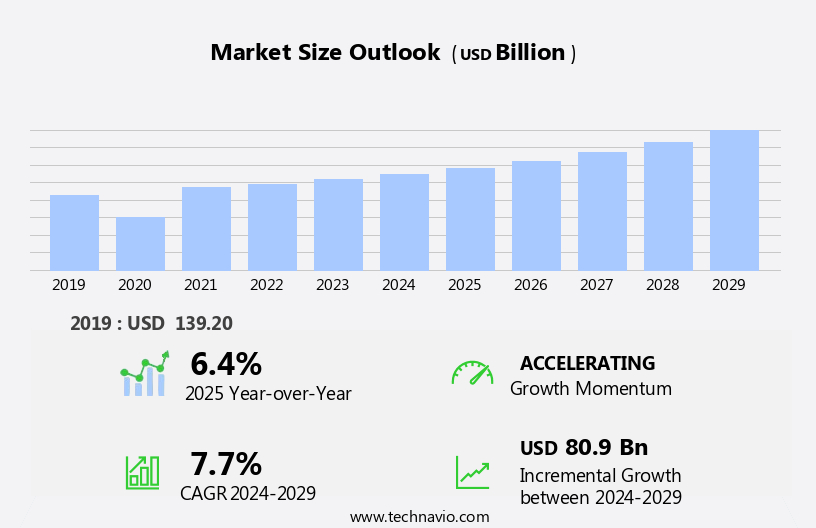
The sports equipment market size is forecast to increase by USD 80.9 billion, at a CAGR of 7.7% between 2024 and 2029.
- The market is experiencing significant growth, driven by the increasing awareness of health and fitness among consumers. This trend is leading to a surge in demand for high-quality sports equipment to support active lifestyles. Additionally, the focus on customization and personalization is becoming increasingly important, as consumers seek products tailored to their specific needs and preferences. However, this market faces challenges as well. The growing prevalence of counterfeit and low-quality products poses a significant threat, as these items can undermine brand reputation and consumer trust.
- Companies must prioritize authenticity and quality to maintain customer loyalty and differentiate themselves from competitors. To capitalize on market opportunities and navigate challenges effectively, businesses should stay informed about consumer preferences, invest in research and development, and implement robust quality control measures.
What will be the Size of the Sports Equipment Market during the forecast period?
Explore in-depth regional segment analysis with market size data - historical 2019-2023 and forecasts 2025-2029 - in the full report.
Request Free Sample
The market continues to evolve, driven by advancements in technology, material sourcing, and consumer preferences. Footwear technology, for instance, is revolutionizing athletic shoes with cushioning systems that provide superior comfort and impact absorption. Performance enhancement is another key area of focus, with wearable technology and biometric sensors enabling real-time data analysis during workouts. Aerobic exercise and fitness equipment are gaining popularity as consumers prioritize health and wellness. Online marketplaces and e-commerce platforms have made it easier for consumers to access a wide range of sports equipment, from compression wear to heart rate monitors and resistance training equipment.
Product development is a continuous process, with ergonomic design and sustainability initiatives becoming increasingly important. Manufacturing processes are being optimized to reduce waste and improve efficiency, while exercise physiology and biomechanics analysis are used to develop equipment that enhances performance and prevents injuries. Sports medicine and rehabilitation programs are also driving growth in the market, with a focus on injury prevention and recovery strategies. Social media marketing and brand marketing are essential tools for reaching consumers and building customer relationships. The market is diverse, encompassing everything from sports apparel and protective gear to cardiovascular equipment and outdoor gear.
Breathable materials, moisture-wicking technology, and ethical sourcing are just a few of the trends shaping this dynamic industry. Data analytics and digital marketing are becoming essential components of supply chain management and customer relationship management. Intellectual property protection is also a critical concern, with brands investing in patents and trademarks to protect their innovations. The market is a constantly evolving landscape, with new technologies, materials, and trends emerging all the time. From fitness equipment and sports nutrition to coaching services and sports performance analysis, this industry is dedicated to helping consumers achieve their fitness goals and improve their overall health and well-being.
How is this Sports Equipment Industry segmented?
The sports equipment industry research report provides comprehensive data (region-wise segment analysis), with forecasts and estimates in "USD billion" for the period 2025-2029, as well as historical data from 2019-2023 for the following segments.
- Product
- Ball games
- Fitness/strength equipment
- Ball over net game
- Athletics training equipment
- Others
- Distribution Channel
- Offline
- Online
- Geography
- North America
- US
- Canada
- Europe
- France
- Germany
- Italy
- UK
- APAC
- China
- India
- Japan
- South Korea
- Rest of World (ROW)
- North America
By Product Insights
The ball games segment is estimated to witness significant growth during the forecast period.
The market encompasses a broad spectrum of products designed to enhance athletic performance, injury prevention, and overall wellness. Durability testing is crucial in ensuring the longevity and effectiveness of equipment, from cushioning systems in footwear technology to the impact absorption capabilities of protective gear. Team uniforms, often made of performance fabrics, play a significant role in enhancing comfort and endurance during training and competition. Biomechanics analysis and rehabilitation programs are integral to sports medicine, helping athletes recover from injuries and optimize their performance through personalized training plans. Supply chain management and ethical sourcing are essential considerations for manufacturers, ensuring the timely delivery of high-quality products while adhering to sustainability initiatives.
Social media marketing and digital marketing strategies are increasingly important for brand marketing and customer relationship management, while data analytics provide valuable insights into consumer preferences and market trends. Product development and ergonomic design continue to push the boundaries of performance enhancement, with wearable technology, compression wear, and biometric sensors offering real-time monitoring and analysis. Strength training, heart rate monitors, arch support, and resistance training equipment are essential components of fitness programs, complemented by aerobic exercise and cardiovascular equipment. Coaching services and sports performance analysis provide valuable guidance and feedback, while sports nutrition and sports apparel cater to the unique needs of athletes.
Manufacturing processes and sustainability initiatives play a significant role in the production of sports equipment, with a focus on reducing waste and minimizing the environmental impact. Recovery strategies, such as sports massage and cryotherapy, are becoming increasingly popular among athletes seeking to optimize their performance and minimize the risk of injury. The market is a dynamic and evolving landscape, with continuous innovation and advancements in technology driving growth and expansion. From football (soccer) goalposts to basketball hoops, the industry caters to a diverse range of sports and athletic pursuits, with major players including Adidas, Nike, and Puma in football (soccer), Spalding, Wilson, and Molten in basketball, and Rawlings, Easton, and Louisville Slugger in baseball and softball.
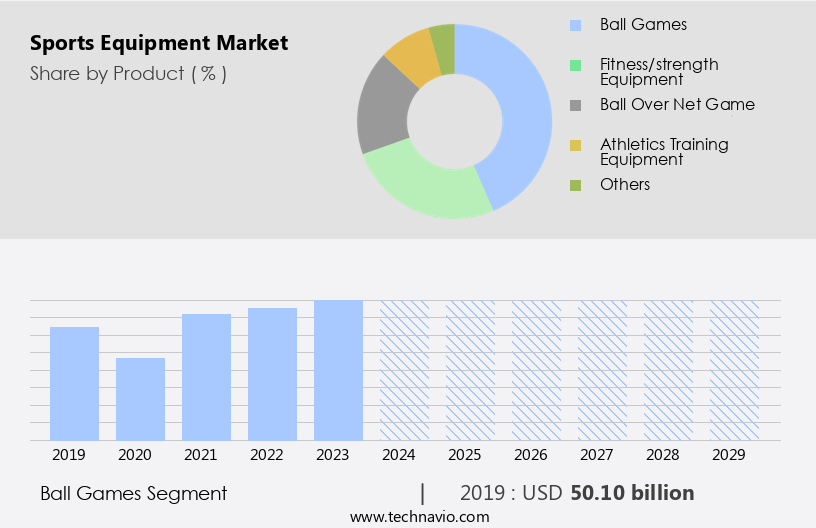
The Ball games segment was valued at USD 50.10 billion in 2019 and showed a gradual increase during the forecast period.
Regional Analysis
APAC is estimated to contribute 34% to the growth of the global market during the forecast period.Technavio’s analysts have elaborately explained the regional trends and drivers that shape the market during the forecast period.
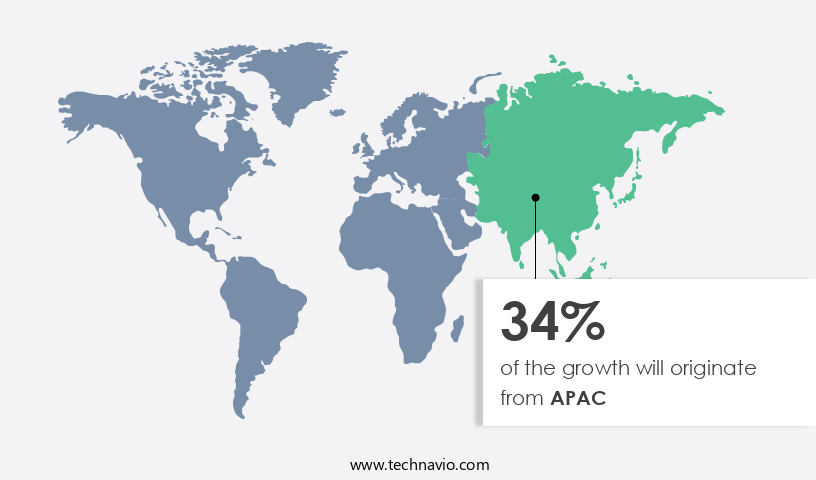
The market in the Asia-Pacific (APAC) region is experiencing notable growth, fueled by increased sports participation, rising disposable incomes, and strategic investments from major companies. In China, the outdoor sports industry is thriving, with a substantial increase in outdoor sports-related orders. Orders for camping gear, cycling accessories, and hiking equipment saw a 79% increase in the first half of 2023 compared to the same period in 2022, and a remarkable surge of 221% compared to 2019. This surge reflects the growing popularity of outdoor activities, driving demand for high-performance, durable sports equipment. Durability testing plays a crucial role in ensuring the longevity and effectiveness of sports equipment.
Cushioning systems, a vital component in footwear technology, are subjected to rigorous testing to provide optimal impact absorption. Team uniforms, a significant investment for sports organizations, undergo extensive testing for comfort, breathability, and moisture-wicking technology to enhance performance and player morale. Biomechanics analysis and rehabilitation programs are integral to sports medicine, helping athletes recover from injuries and improve overall performance. Supply chain management is a critical aspect of the industry, ensuring timely delivery of products and maintaining ethical sourcing practices. Performance fabrics, such as those used in compression wear, are designed with ergonomic principles and advanced materials to optimize athlete comfort and enhance performance.
Social media marketing and digital marketing strategies are increasingly important for sports equipment brands, reaching consumers directly and fostering customer relationships. Strength training and heart rate monitors are essential tools for athletes, enabling them to track their progress and optimize their training programs. Arch support and biometric sensors are integral to footwear technology, providing personalized comfort and performance enhancement. Product development, fueled by innovation and research in areas such as sports performance analysis, is a continuous process in the industry. Sustainability initiatives are gaining traction, with companies focusing on eco-friendly manufacturing processes and recycled materials. Exercise physiology and coaching services play a crucial role in optimizing athlete performance and preventing injuries.
Fitness equipment, cardiovascular equipment, and resistance training tools are essential for home workouts and professional training facilities. GPS tracking and sports performance analysis are valuable tools for athletes, enabling them to monitor their progress and optimize their training regimens. E-commerce platforms and online marketplaces have transformed the way consumers purchase sports equipment, offering convenience and accessibility. Brand marketing and customer relationship management are essential for sports equipment companies, fostering loyalty and repeat business. Data analytics and injury prevention strategies are critical components of sports performance analysis, enabling teams and athletes to make data-driven decisions and optimize performance.
Sports apparel, a significant segment of the market, is focused on providing breathable materials, protective gear, and performance-enhancing technologies. In conclusion, the market in the APAC region is experiencing significant growth, driven by increased sports participation, rising disposable incomes, and strategic investments from major companies. The industry is focused on innovation, performance enhancement, and sustainability, with a strong emphasis on durability, comfort, and functionality. From biomechanics analysis and rehabilitation programs to social media marketing and e-commerce platforms, the market is a dynamic and evolving landscape.
Market Dynamics
Our researchers analyzed the data with 2024 as the base year, along with the key drivers, trends, and challenges. A holistic analysis of drivers will help companies refine their marketing strategies to gain a competitive advantage.
What are the key market drivers leading to the rise in the adoption of Sports Equipment Industry?
- The market's growth is primarily attributed to the rising consciousness and prioritization of health and fitness among consumers.
- The market is experiencing significant growth due to the increasing emphasis on health and wellness. Consumers are recognizing the importance of physical activity in promoting overall well-being and preventing lifestyle diseases. This trend is driving demand for high-performance sports equipment that offers durability, effective cushioning systems, and advanced technologies such as biomechanics analysis, rehabilitation programs, sports medicine, and biometric sensors. Supply chain management plays a crucial role in ensuring the availability of these products to meet the increasing demand. Performance fabrics, strength training equipment, heart rate monitors, and arch support are among the popular categories.
- Social media marketing is also a key strategy for brands to reach their audience and promote their products. Biomechanics analysis and rehabilitation programs are gaining popularity in the market, as athletes and fitness enthusiasts seek to prevent injuries and optimize their performance. Sports medicine and biometric sensors are essential tools for athletes and fitness enthusiasts to monitor their health and track their progress. In conclusion, the market is expected to continue growing, driven by consumer preferences for high-quality, durable, and technologically advanced equipment. The market is also being influenced by government initiatives and health organizations promoting fitness and wellness programs.
What are the market trends shaping the Sports Equipment Industry?
- Focusing on customization and personalization is a mandatory trend in the current market. Professionals in various industries prioritize tailored solutions to cater to individual needs and preferences.
- The market is witnessing significant growth as consumers prioritize gear that enhances performance, comfort, and personalization. Customization and personalization are key trends, allowing athletes and fitness enthusiasts to tailor equipment to their specific needs. This is particularly evident in footwear and apparel, where leading brands offer customizable options, enabling customers to choose colors, materials, and even add personalized initials. Compression wear, a popular category, is also being customized to meet individual requirements. In addition, wearable technology is increasingly being integrated into sports equipment to monitor performance and provide recovery strategies.
- Product development focuses on ergonomic design, sustainability initiatives, and performance enhancement through advanced material sourcing and manufacturing processes. Exercise physiology research continues to drive innovation, ensuring that equipment meets the latest scientific standards. Online marketplaces facilitate easy access to this customized gear, making it a convenient and attractive option for consumers.
What challenges does the Sports Equipment Industry face during its growth?
- The increasing prevalence of counterfeit and low-quality products poses a significant challenge to the industry's growth trajectory. This issue undermines consumer trust, negatively impacts brand reputation, and hinders the industry from reaching its full potential.
- The market faces a significant challenge from the proliferation of counterfeit and low-quality products. These imitations, which often mimic established brands, utilize subpar materials and manufacturing processes. The consequences extend beyond reputational damage, as these products may pose safety risks due to their lack of durability and performance standards suitable for professional or recreational use. A major concern within this sector is the increasing prevalence of counterfeit athletic shoes and apparel. Counterfeit sports goods represent a considerable portion of the global counterfeit trade, resulting in substantial financial losses for legitimate manufacturers. Brands like Nike, Adidas, and Under Armour frequently encounter counterfeit versions of their products, particularly in regions with weaker intellectual property enforcement, such as parts of Asia and Latin America.
- Ethical sourcing, impact absorption, sports performance analysis, cardiovascular equipment, sports nutrition, protective gear, breathable materials, moisture-wicking technology, GPS tracking, and coaching services are essential aspects of the sports equipment industry. Ensuring the authenticity and quality of these products is crucial for maintaining consumer trust and safety.
Exclusive Customer Landscape
The sports equipment market forecasting report includes the adoption lifecycle of the market, covering from the innovator’s stage to the laggard’s stage. It focuses on adoption rates in different regions based on penetration. Furthermore, the sports equipment market report also includes key purchase criteria and drivers of price sensitivity to help companies evaluate and develop their market growth analysis strategies.
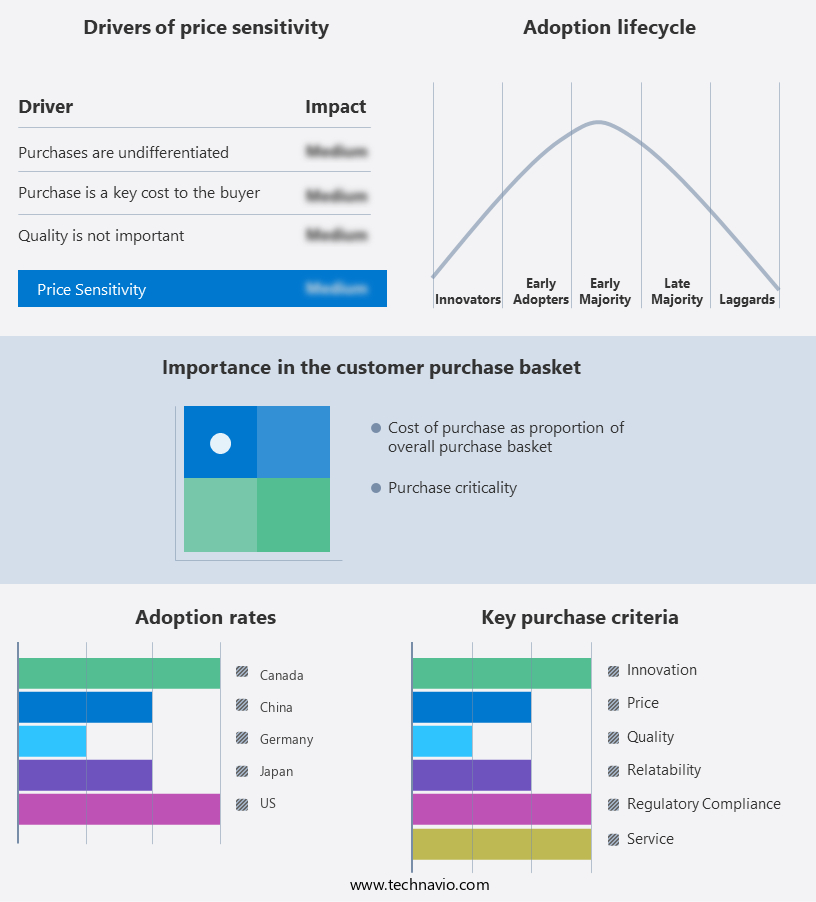
Customer Landscape
Key Companies & Market Insights
Companies are implementing various strategies, such as strategic alliances, sports equipment market forecast, partnerships, mergers and acquisitions, geographical expansion, and product/service launches, to enhance their presence in the industry.
Adidas AG - This company specializes in providing a diverse range of sports equipment for various athletic pursuits. Our product offerings encompass essential gear for popular sports such as footballs, basketballs, and more. By supplying high-quality merchandise, we aim to enhance the athletic experience for individuals and teams. Our commitment to originality and innovation ensures that our inventory remains up-to-date with the latest trends and advancements in sports technology. By focusing on customer satisfaction and delivering top-notch products, we strive to elevate the overall performance and enjoyment of our clients.
The industry research and growth report includes detailed analyses of the competitive landscape of the market and information about key companies, including:
- Adidas AG
- ANTA Sports Products Ltd.
- ASICS Corp.
- BAUER HOCKEY LLC
- Cosco India Ltd.
- Freewill Sports Pvt. Ltd.
- Mizuno USA Inc.
- New Balance Athletics Inc.
- Nike Inc.
- PUMA SE
- Reebok International Ltd.
- Russell Brands LLC
- Sanspareils Greenlands Pvt Ltd.
- Sareen Sports Industries
- Skis Rossignol S.A
- Topgolf Callaway Brands Corp.
- Under Armour Inc.
- Yonex Co. Ltd.
Qualitative and quantitative analysis of companies has been conducted to help clients understand the wider business environment as well as the strengths and weaknesses of key industry players. Data is qualitatively analyzed to categorize companies as pure play, category-focused, industry-focused, and diversified; it is quantitatively analyzed to categorize companies as dominant, leading, strong, tentative, and weak.
Recent Development and News in Sports Equipment Market
- In January 2024, Adidas and Reebok, two major players in the market, announced a strategic partnership to co-brand and co-develop fitness technology products. This collaboration aimed to combine Adidas' design expertise and Reebok's digital capabilities, as reported by Reuters.
- In March 2024, Nike, Inc. Completed the acquisition of CEJN Group, a leading manufacturer of quick-connect couplings for industrial applications, for approximately USD1.1 billion. This acquisition was an unexpected move for Nike, expanding its product offerings beyond sports equipment and apparel, as stated in Nike's SEC filing.
- In April 2025, Under Armour secured a significant investment of USD250 million from Blackstone Group Inc. To accelerate its global growth strategy, as per a Bloomberg report. The funding round valued Under Armour at over USD7 billion, making it the largest investment in the market during this period.
- In May 2025, Decathlon, the French multinational sporting goods retailer, entered the Indian market by opening its first store in New Delhi. This expansion marked Decathlon's entry into the world's second-most populous country, as reported by the Wall Street Journal, with plans to invest USD1 billion over the next five years to establish 100 stores.
Research Analyst Overview
- In the dynamic the market, exercise bikes, yoga mats, and gym equipment continue to gain traction among consumers prioritizing home workouts. Simultaneously, sustainable materials and concussion prevention are emerging trends, with sports analytics platforms and biomimicry in sports driving innovation. Energy bars and sports drinks cater to athletes' nutritional needs, while brand ambassadors and influencer marketing boost product visibility. Recycled materials and the circular economy are shaping the industry's future, with weightlifting bars, rowing machines, cycling apparel, and soccer cleats also adopting this approach.
- Performance analysis software and sports data visualization enable personalized training, while virtual reality training offers immersive experiences. Elliptical trainers, golf clubs, and protein supplements round out the market, with omni-channel retailing ensuring seamless customer experiences.
Dive into Technavio’s robust research methodology, blending expert interviews, extensive data synthesis, and validated models for unparalleled Sports Equipment Market insights. See full methodology.
|
Market Scope |
|
|
Report Coverage |
Details |
|
Page number |
209 |
|
Base year |
2024 |
|
Historic period |
2019-2023 |
|
Forecast period |
2025-2029 |
|
Growth momentum & CAGR |
Accelerate at a CAGR of 7.7% |
|
Market growth 2025-2029 |
USD 80.9 billion |
|
Market structure |
Fragmented |
|
YoY growth 2024-2025(%) |
6.4 |
|
Key countries |
US, China, India, UK, Germany, Japan, Canada, France, South Korea, and Italy |
|
Competitive landscape |
Leading Companies, Market Positioning of Companies, Competitive Strategies, and Industry Risks |
What are the Key Data Covered in this Sports Equipment Market Research and Growth Report?
- CAGR of the Sports Equipment industry during the forecast period
- Detailed information on factors that will drive the growth and forecasting between 2025 and 2029
- Precise estimation of the size of the market and its contribution of the industry in focus to the parent market
- Accurate predictions about upcoming growth and trends and changes in consumer behaviour
- Growth of the market across APAC, Europe, North America, South America, and Middle East and Africa
- Thorough analysis of the market’s competitive landscape and detailed information about companies
- Comprehensive analysis of factors that will challenge the sports equipment market growth of industry companies
We can help! Our analysts can customize this sports equipment market research report to meet your requirements.
 RIA -
RIA - 
