Ergonomic Chairs Market Size 2025-2029
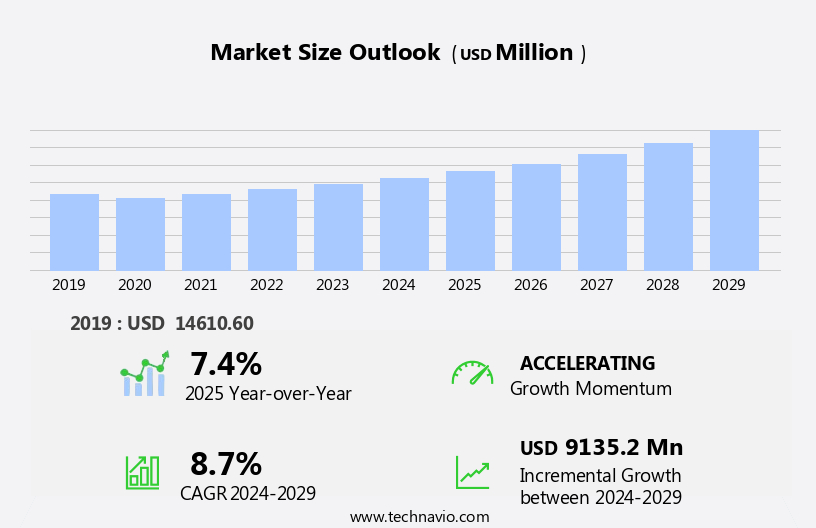
The ergonomic chairs market size is forecast to increase by USD 9.14 billion at a CAGR of 8.7% between 2024 and 2029.
- The market is experiencing significant growth, driven by the increasing awareness of the importance of workplace health and productivity. A key trend in this market is the emergence of ergonomic gaming chairs, which cater to the growing number of remote workers and avid gamers seeking comfort and support during long hours of use. However, uncertainty in the prices of raw materials, such as foam and steel, poses a challenge for manufacturers and could impact market growth. Additionally, the in the number of startups offering ergonomic chair solutions presents both opportunities and intensified competition.
- Companies seeking to capitalize on market opportunities must focus on innovation, quality, and competitive pricing to differentiate themselves. Navigating raw material price fluctuations through strategic sourcing and supply chain management will also be crucial for long-term success.
What will be the Size of the Ergonomic Chairs Market during the forecast period?

Request Free Sample
- The market encompasses office furniture designed to promote employee comfort and wellness, with a focus on addressing health issues such as back pain, poor circulation, and tension headaches. This market is experiencing significant growth due to the increasing prevalence of remote work and the need for ergonomic seating solutions in both corporate and home offices. Ergonomic chairs come in various segments, including swivel chairs and adjustable chairs, made from materials like steel and plastic. The market caters to both commercial and residential sectors, with home office furniture becoming increasingly popular as more individuals set up workspaces at home.
- Building owners and domestic and international manufacturers continue to invest in this market, driven by the economic impact studies demonstrating the benefits of ergonomic seating for employee collaboration, workplace comfort, and productivity enhancement. Online sales and social media play a crucial role in marketing and distribution, with many consumers researching and purchasing ergonomic chairs through these channels. The market's direction reflects a growing awareness of the importance of employee wellness and the role of ergonomic seating in creating a healthier and more productive workforce.
How is this Ergonomic Chairs Industry segmented?
The ergonomic chairs industry research report provides comprehensive data (region-wise segment analysis), with forecasts and estimates in "USD million" for the period 2025-2029, as well as historical data from 2019-2023 for the following segments.
- End-user
- Type
- 2-3 degree of freedom adjustment
- More than 3 degree of freedom adjustment
- Application
- Office
- Gaming
- Hybrid
- Exercise
- Product Type
- Swivel chair
- Adjustable chair
- Fixed chair
- Material
- Geography
- North America
- APAC
- Australia
- China
- India
- Japan
- South Korea
- Europe
- South America
- Middle East and Africa
By End-user Insights
The commercial segment is estimated to witness significant growth during the forecast period.
The market is a significant sector within the office furniture industry, with the commercial segment being the largest contributor in 2024. The growth of this segment can be attributed to the increasing number of office buildings and technology parks worldwide. Multinational companies are expanding their operations into new cities and countries, leading to an increase in demand for ergonomic chairs. For instance, Google's new campus in Bangalore, India, is one such example. Ergonomic chairs are essential in office environments to prevent health problems such as back pain, poor circulation, and tension headaches. These chairs cater to various user needs, including adjustable desks, keyboard trays, and adjustable lumbar support.
The market also includes multipurpose ergonomic chairs, adjustable beds, and student comfort chairs. Product innovations, such as mesh backrests, Synchro-Tilt mechanisms, and smart technologies, are driving the market's growth. Moreover, eco-friendly materials and manufacturing methods are gaining popularity, making ergonomic chairs a viable option for both commercial and residential applications. The home office market is also growing due to the increasing trend of remote work. Building owners, domestic and international manufacturers, brick-and-mortar stores, and online sales channels are the key players in this market. Ergonomic chairs are essential for employee collaboration, patient comfort in healthcare settings, and industrial sector productivity.
The economic impact study indicates that ergonomic chairs contribute significantly to worker productivity and physical and mental health.

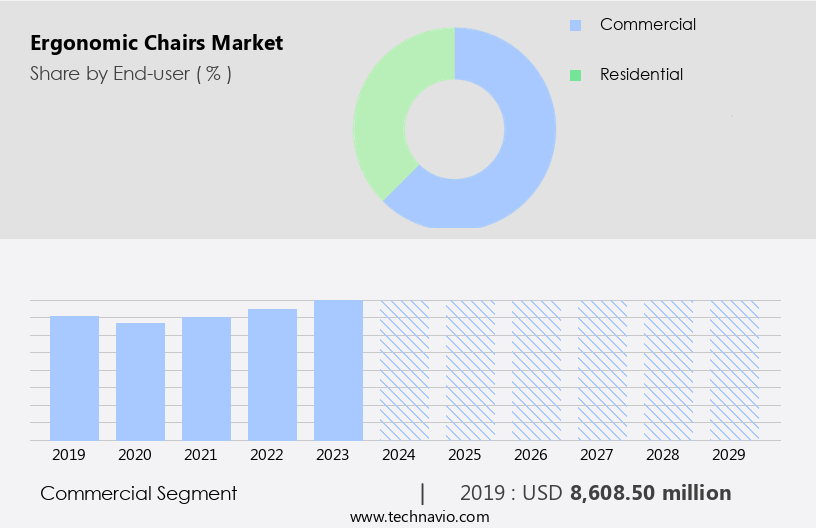
Get a glance at the market report of share of various segments Request Free Sample
The Commercial segment was valued at USD 8.61 billion in 2019 and showed a gradual increase during the forecast period.
Regional Analysis
APAC is estimated to contribute 55% to the growth of the global market during the forecast period.Technavio’s analysts have elaborately explained the regional trends and drivers that shape the market during the forecast period.

For more insights on the market size of various regions, Request Free Sample
The market in North America is experiencing significant growth due to the increasing economic demand for modern office spaces and the shift towards remote work. In the US, this market is poised for substantial expansion, driven by corporate investments in office infrastructure improvements. The commercial segment in North America is witnessing a rapid adoption of ergonomic chairs to enhance employee comfort and productivity. Ergonomic chairs are essential for preventing health issues such as back pain, poor circulation, and tension headaches, particularly in home office setups. These chairs come in various product types, including adjustable and fixed, with seat materials ranging from steel to plastic.
Key market research firms, including , , and , have conducted Economic Impact Studies to highlight the importance of ergonomic seating in office environments. Building owners, domestic and international manufacturers, brick-and-mortar stores, and online sales platforms are all contributing to the market's growth. Product innovations, such as adjustable lumbar support, mesh backrests, and smart technologies, are also driving demand. Additionally, eco-friendly materials and manufacturing methods are gaining popularity. The market encompasses adjustable desks, keyboard trays, adjustable beds, and other seating solutions for various sectors, including the industrial sector, computer labs, and student comfort. The market's growth is expected to continue, with key players focusing on product development and strategic partnerships to meet the increasing demand.
Market Dynamics
Our researchers analyzed the data with 2024 as the base year, along with the key drivers, trends, and challenges. A holistic analysis of drivers will help companies refine their marketing strategies to gain a competitive advantage.
What are the key market drivers leading to the rise in the adoption of Ergonomic Chairs Industry?
in number of startups is the key driver of the market.
- The market is experiencing significant growth due to the expanding startup ecosystem and the resulting increase in office spaces. Favorable governmental policies, such as legal protections and business incentives, have fueled the growth of startups worldwide, leading to a in demand for ergonomic chairs. This trend is particularly prominent in entrepreneurial hubs like Silicon Valley, where the American government supports capital expansions, bridges mentors and entrepreneurs, and introduces policy changes to foster innovation and market opportunities.
- The increasing number of tech parks and innovative work environments further contributes to the market's growth during the forecast period.
What are the market trends shaping the Ergonomic Chairs Industry?
Emergence of ergonomic gaming chairs is the upcoming market trend.
- Ergonomic gaming chairs offer gamers comfort and support, reducing the risk of discomfort and potential health issues such as herniated lumbar discs. These chairs are designed with a focus on natural hand positions and sitting postures, enabling users to play for extended periods without causing strain on the back muscles and hands. Conventional chairs may lead to pain and discomfort due to prolonged sitting.
- Ergonomic gaming chairs provide additional features such as swivel and tilt capabilities, seat-side controls, and neck pillows, allowing gamers to relax and rest their postural muscles. By adhering to a more ergonomic seating arrangement, gamers can enhance their gaming experience and minimize the negative effects of extended playtime.
What challenges does the Ergonomic Chairs Industry face during its growth?
Uncertainty in prices of raw materials is a key challenge affecting the industry growth.
- The market experiences significant challenges due to the volatile cost of raw materials and manufacturing. The price fluctuations of essential components, such as steel, plastics, textiles, wood particleboard, and cartons, impact the profitability of manufacturers and retailers. Among these, steel, wood, and wood-related products, as well as aluminum, are crucial raw materials for ergonomic chair production. The escalating cost of wood particleboard is particularly noteworthy, attributable to input and transportation cost instability and shrinking furniture manufacturing capacities.
- This market dynamic necessitates careful cost management strategies for businesses in the sector.
Exclusive Customer Landscape
The ergonomic chairs market forecasting report includes the adoption lifecycle of the market, covering from the innovator’s stage to the laggard’s stage. It focuses on adoption rates in different regions based on penetration. Furthermore, the ergonomic chairs market report also includes key purchase criteria and drivers of price sensitivity to help companies evaluate and develop their market growth analysis strategies.
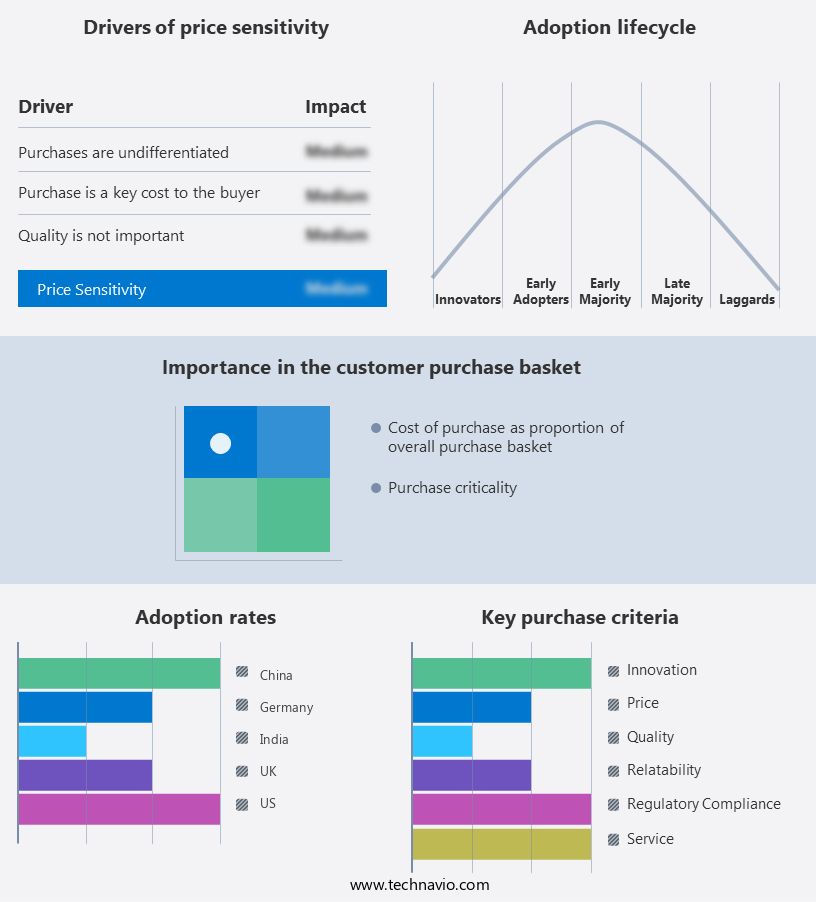
Customer Landscape
Key Companies & Market Insights
Companies are implementing various strategies, such as strategic alliances, ergonomic chairs market forecast, partnerships, mergers and acquisitions, geographical expansion, and product/service launches, to enhance their presence in the industry.
Chair Factory - The company provides a selection of ergonomic chairs, including the Peta High Back Chair and Quint High Back Chair, designed to promote comfort and productivity in the workplace. These chairs prioritize user comfort with adjustable features and supportive designs, enhancing overall work efficiency. By investing in ergonomic seating solutions, individuals can reduce the risk of work-related discomfort and improve their focus and concentration.
The industry research and growth report includes detailed analyses of the competitive landscape of the market and information about key companies, including:
- Chair Factory
- Damro Furnitures Pvt. Ltd.
- Durian Pvt. Ltd.
- Ergo lab
- Eurotech Design Systems Pvt. Ltd.
- Featherlite
- GM Seaing LLC
- Haworth Inc.
- HNI Corp.
- MillerKnoll Inc.
- Nilkamal Ltd.
- Okamura Corp.
- PSI Seating Ltd.
- Roots Group of Companies
- Steelcase Inc.
- Stellar India
- Teknion Group
- TOPSTAR GMBH
- True Innovations
- Zivella Office Furniture
Qualitative and quantitative analysis of companies has been conducted to help clients understand the wider business environment as well as the strengths and weaknesses of key industry players. Data is qualitatively analyzed to categorize companies as pure play, category-focused, industry-focused, and diversified; it is quantitatively analyzed to categorize companies as dominant, leading, strong, tentative, and weak.
Research Analyst Overview
The market encompasses a broad range of seating solutions designed to promote comfort and support for individuals in various office environments. With the increasing trend toward remote work and the growing recognition of the importance of employee well-being, the demand for ergonomic chairs has d in recent years. Ergonomic chairs cater to the needs of diverse sectors, including commercial offices, residential settings, and industrial workplaces. In commercial environments, ergonomic chairs are essential for enhancing productivity and reducing musculoskeletal disorders among employees. In residential settings, ergonomic chairs have gained popularity as part of home office setups, enabling individuals to work comfortably and efficiently from home.
The market comprises several segments, including those made of steel and plastic. Steel chairs offer durability and adjustability, making them a popular choice for commercial applications. Plastic chairs, on the other hand, are more lightweight and cost-effective, making them suitable for residential and home office use. Ergonomic chairs come in various product types, such as adjustable and fixed chairs. Adjustable chairs offer the flexibility to customize the seating position, ensuring optimal comfort and support for different body types and postures. Fixed chairs, while less adjustable, provide a more stable and supportive seating experience. Seat materials also vary, with options including mesh backrests and various fabric coverings.
Mesh backrests provide excellent breathability and airflow, making them an ideal choice for long hours of sitting. Fabric coverings offer a more traditional look and feel, with a range of colors and textures to suit different design preferences. Ergonomic chairs are not only beneficial for physical health but also contribute to mental well-being. Sitting in a comfortable and supportive chair can help reduce stress and tension, leading to improved focus and concentration. The market is driven by several factors, including the increasing prevalence of remote work, the need to address health problems such as back pain, poor circulation, and tension headaches, and the growing emphasis on employee collaboration and productivity.
Product innovations continue to shape the market, with new features such as adjustable lumbar support, synchro-tilt mechanisms, and smart technologies that enhance comfort and functionality. Additionally, eco-friendly materials and manufacturing methods are gaining popularity, reflecting the growing importance of sustainability in the business world. Ergonomic chairs are available through various channels, including brick-and-mortar stores and online sales. Social media platforms have also emerged as a significant marketing tool for ergonomic chair manufacturers and retailers, enabling them to reach a wider audience and engage with customers directly. In , the market is a dynamic and evolving industry that caters to the growing demand for comfortable and supportive seating solutions in various office environments.
With a focus on innovation, sustainability, and employee well-being, ergonomic chairs are poised to play a crucial role in enhancing productivity, reducing health issues, and promoting overall workplace satisfaction.
Market Scope
|
Report Coverage
|
Details
|
Page number
|
251
|
Base year
|
2024
|
Historic period
|
2019-2023 |
Forecast period
|
2025-2029
|
Growth momentum & CAGR
|
Accelerate at a CAGR of 8.7%
|
Market growth 2025-2029
|
USD 9135.2 million
|
Market structure
|
Fragmented
|
YoY growth 2024-2025(%)
|
7.4
|
Key countries
|
US, China, UK, Germany, India, Canada, Japan, Australia, France, and South Korea
|
Competitive landscape
|
Leading Companies, Market Positioning of Companies, Competitive Strategies, and Industry Risks
|
Request Free Sample
What are the Key Data Covered in this Ergonomic Chairs Market Research and Growth Report?
- CAGR of the Ergonomic Chairs industry during the forecast period
- Detailed information on factors that will drive the growth and forecasting between 2025 and 2029
- Precise estimation of the size of the market and its contribution of the industry in focus to the parent market
- Accurate predictions about upcoming growth and trends and changes in consumer behaviour
- Growth of the market across North America, APAC, Europe, South America, and Middle East and Africa
- Thorough analysis of the market’s competitive landscape and detailed information about companies
- Comprehensive analysis of factors that will challenge the ergonomic chairs market growth of industry companies
We can help! Our analysts can customize this ergonomic chairs market research report to meet your requirements.
Get in touch
1 Executive Summary
- 1.1 Market overview
- Executive Summary - Chart on Market Overview
- Executive Summary - Data Table on Market Overview
- Executive Summary - Chart on Global Market Characteristics
- Executive Summary - Chart on Market by Geography
- Executive Summary - Chart on Market Segmentation by End-user
- Executive Summary - Chart on Market Segmentation by Type
- Executive Summary - Chart on Market Segmentation by Application
- Executive Summary - Chart on Market Segmentation by Product Type
- Executive Summary - Chart on Market Segmentation by Material
- Executive Summary - Chart on Incremental Growth
- Executive Summary - Data Table on Incremental Growth
- Executive Summary - Chart on Company Market Positioning
2 Technavio Analysis
- 2.1 Analysis of price sensitivity, lifecycle, customer purchase basket, adoption rates, and purchase criteria
- Analysis of price sensitivity, lifecycle, customer purchase basket, adoption rates, and purchase criteria
- 2.2 Criticality of inputs and Factors of differentiation
- Overview on criticality of inputs and factors of differentiation
- 2.3 Factors of disruption
- Overview on factors of disruption
- 2.4 Impact of drivers and challenges
- Impact of drivers and challenges in 2024 and 2029
3 Market Landscape
- 3.1 Market ecosystem
- Parent Market
- Data Table on - Parent Market
- 3.2 Market characteristics
- Market characteristics analysis
4 Market Sizing
- 4.1 Market definition
- Offerings of companies included in the market definition
- 4.2 Market segment analysis
- 4.4 Market outlook: Forecast for 2024-2029
- Chart on Global - Market size and forecast 2024-2029 ($ million)
- Data Table on Global - Market size and forecast 2024-2029 ($ million)
- Chart on Global Market: Year-over-year growth 2024-2029 (%)
- Data Table on Global Market: Year-over-year growth 2024-2029 (%)
5 Historic Market Size
- 5.1 Global Ergonomic Chairs Market 2019 - 2023
- Historic Market Size - Data Table on Global Ergonomic Chairs Market 2019 - 2023 ($ million)
- 5.2 End-user segment analysis 2019 - 2023
- Historic Market Size - End-user Segment 2019 - 2023 ($ million)
- 5.3 Type segment analysis 2019 - 2023
- Historic Market Size - Type Segment 2019 - 2023 ($ million)
- 5.4 Application segment analysis 2019 - 2023
- Historic Market Size - Application Segment 2019 - 2023 ($ million)
- 5.5 Product Type segment analysis 2019 - 2023
- Historic Market Size - Product Type Segment 2019 - 2023 ($ million)
- 5.6 Material segment analysis 2019 - 2023
- Historic Market Size - Material Segment 2019 - 2023 ($ million)
- 5.7 Geography segment analysis 2019 - 2023
- Historic Market Size - Geography Segment 2019 - 2023 ($ million)
- 5.8 Country segment analysis 2019 - 2023
- Historic Market Size - Country Segment 2019 - 2023 ($ million)
6 Qualitative Analysis
- 6.1 The AI impact on Global Ergonomic Chairs Market
7 Five Forces Analysis
- 7.1 Five forces summary
- Five forces analysis - Comparison between 2024 and 2029
- 7.2 Bargaining power of buyers
- Bargaining power of buyers - Impact of key factors 2024 and 2029
- 7.3 Bargaining power of suppliers
- Bargaining power of suppliers - Impact of key factors in 2024 and 2029
- 7.4 Threat of new entrants
- Threat of new entrants - Impact of key factors in 2024 and 2029
- 7.5 Threat of substitutes
- Threat of substitutes - Impact of key factors in 2024 and 2029
- 7.6 Threat of rivalry
- Threat of rivalry - Impact of key factors in 2024 and 2029
- 7.7 Market condition
- Chart on Market condition - Five forces 2024 and 2029
8 Market Segmentation by End-user
- 8.1 Market segments
- Chart on End-user - Market share 2024-2029 (%)
- Data Table on End-user - Market share 2024-2029 (%)
- 8.2 Comparison by End-user
- Chart on Comparison by End-user
- Data Table on Comparison by End-user
- 8.3 Commercial - Market size and forecast 2024-2029
- Chart on Commercial - Market size and forecast 2024-2029 ($ million)
- Data Table on Commercial - Market size and forecast 2024-2029 ($ million)
- Chart on Commercial - Year-over-year growth 2024-2029 (%)
- Data Table on Commercial - Year-over-year growth 2024-2029 (%)
- 8.4 Residential - Market size and forecast 2024-2029
- Chart on Residential - Market size and forecast 2024-2029 ($ million)
- Data Table on Residential - Market size and forecast 2024-2029 ($ million)
- Chart on Residential - Year-over-year growth 2024-2029 (%)
- Data Table on Residential - Year-over-year growth 2024-2029 (%)
- 8.5 Market opportunity by End-user
- Market opportunity by End-user ($ million)
- Data Table on Market opportunity by End-user ($ million)
9 Market Segmentation by Type
- 9.1 Market segments
- Chart on Type - Market share 2024-2029 (%)
- Data Table on Type - Market share 2024-2029 (%)
- 9.2 Comparison by Type
- Chart on Comparison by Type
- Data Table on Comparison by Type
- 2-3 degree of freedom adjustment - Market size and forecast 2024-2029
- Chart on 2-3 degree of freedom adjustment - Market size and forecast 2024-2029 ($ million)
- Data Table on 2-3 degree of freedom adjustment - Market size and forecast 2024-2029 ($ million)
- Chart on 2-3 degree of freedom adjustment - Year-over-year growth 2024-2029 (%)
- Data Table on 2-3 degree of freedom adjustment - Year-over-year growth 2024-2029 (%)
- 9.4 More than 3 degree of freedom adjustment - Market size and forecast 2024-2029
- Chart on More than 3 degree of freedom adjustment - Market size and forecast 2024-2029 ($ million)
- Data Table on More than 3 degree of freedom adjustment - Market size and forecast 2024-2029 ($ million)
- Chart on More than 3 degree of freedom adjustment - Year-over-year growth 2024-2029 (%)
- Data Table on More than 3 degree of freedom adjustment - Year-over-year growth 2024-2029 (%)
- 9.5 Market opportunity by Type
- Market opportunity by Type ($ million)
- Data Table on Market opportunity by Type ($ million)
10 Market Segmentation by Application
- 10.1 Market segments
- Chart on Application - Market share 2024-2029 (%)
- Data Table on Application - Market share 2024-2029 (%)
- 10.2 Comparison by Application
- Chart on Comparison by Application
- Data Table on Comparison by Application
- 10.3 Office - Market size and forecast 2024-2029
- Chart on Office - Market size and forecast 2024-2029 ($ million)
- Data Table on Office - Market size and forecast 2024-2029 ($ million)
- Chart on Office - Year-over-year growth 2024-2029 (%)
- Data Table on Office - Year-over-year growth 2024-2029 (%)
- 10.4 Gaming - Market size and forecast 2024-2029
- Chart on Gaming - Market size and forecast 2024-2029 ($ million)
- Data Table on Gaming - Market size and forecast 2024-2029 ($ million)
- Chart on Gaming - Year-over-year growth 2024-2029 (%)
- Data Table on Gaming - Year-over-year growth 2024-2029 (%)
- 10.5 Hybrid - Market size and forecast 2024-2029
- Chart on Hybrid - Market size and forecast 2024-2029 ($ million)
- Data Table on Hybrid - Market size and forecast 2024-2029 ($ million)
- Chart on Hybrid - Year-over-year growth 2024-2029 (%)
- Data Table on Hybrid - Year-over-year growth 2024-2029 (%)
- 10.6 Exercise - Market size and forecast 2024-2029
- Chart on Exercise - Market size and forecast 2024-2029 ($ million)
- Data Table on Exercise - Market size and forecast 2024-2029 ($ million)
- Chart on Exercise - Year-over-year growth 2024-2029 (%)
- Data Table on Exercise - Year-over-year growth 2024-2029 (%)
- 10.7 Market opportunity by Application
- Market opportunity by Application ($ million)
- Data Table on Market opportunity by Application ($ million)
11 Market Segmentation by Product Type
- 11.1 Market segments
- Chart on Product Type - Market share 2024-2029 (%)
- Data Table on Product Type - Market share 2024-2029 (%)
- 11.2 Comparison by Product Type
- Chart on Comparison by Product Type
- Data Table on Comparison by Product Type
- 11.3 Swivel chair - Market size and forecast 2024-2029
- Chart on Swivel chair - Market size and forecast 2024-2029 ($ million)
- Data Table on Swivel chair - Market size and forecast 2024-2029 ($ million)
- Chart on Swivel chair - Year-over-year growth 2024-2029 (%)
- Data Table on Swivel chair - Year-over-year growth 2024-2029 (%)
- 11.4 Adjustable chair - Market size and forecast 2024-2029
- Chart on Adjustable chair - Market size and forecast 2024-2029 ($ million)
- Data Table on Adjustable chair - Market size and forecast 2024-2029 ($ million)
- Chart on Adjustable chair - Year-over-year growth 2024-2029 (%)
- Data Table on Adjustable chair - Year-over-year growth 2024-2029 (%)
- 11.5 Fixed chair - Market size and forecast 2024-2029
- Chart on Fixed chair - Market size and forecast 2024-2029 ($ million)
- Data Table on Fixed chair - Market size and forecast 2024-2029 ($ million)
- Chart on Fixed chair - Year-over-year growth 2024-2029 (%)
- Data Table on Fixed chair - Year-over-year growth 2024-2029 (%)
- 11.6 Market opportunity by Product Type
- Market opportunity by Product Type ($ million)
- Data Table on Market opportunity by Product Type ($ million)
12 Market Segmentation by Material
- 12.1 Market segments
- Chart on Material - Market share 2024-2029 (%)
- Data Table on Material - Market share 2024-2029 (%)
- 12.2 Comparison by Material
- Chart on Comparison by Material
- Data Table on Comparison by Material
- 12.3 Plastic - Market size and forecast 2024-2029
- Chart on Plastic - Market size and forecast 2024-2029 ($ million)
- Data Table on Plastic - Market size and forecast 2024-2029 ($ million)
- Chart on Plastic - Year-over-year growth 2024-2029 (%)
- Data Table on Plastic - Year-over-year growth 2024-2029 (%)
- 12.4 Steel - Market size and forecast 2024-2029
- Chart on Steel - Market size and forecast 2024-2029 ($ million)
- Data Table on Steel - Market size and forecast 2024-2029 ($ million)
- Chart on Steel - Year-over-year growth 2024-2029 (%)
- Data Table on Steel - Year-over-year growth 2024-2029 (%)
- 12.5 Others - Market size and forecast 2024-2029
- Chart on Others - Market size and forecast 2024-2029 ($ million)
- Data Table on Others - Market size and forecast 2024-2029 ($ million)
- Chart on Others - Year-over-year growth 2024-2029 (%)
- Data Table on Others - Year-over-year growth 2024-2029 (%)
- 12.6 Market opportunity by Material
- Market opportunity by Material ($ million)
- Data Table on Market opportunity by Material ($ million)
13 Customer Landscape
- 13.1 Customer landscape overview
- Analysis of price sensitivity, lifecycle, customer purchase basket, adoption rates, and purchase criteria
14 Geographic Landscape
- 14.1 Geographic segmentation
- Chart on Market share by geography 2024-2029 (%)
- Data Table on Market share by geography 2024-2029 (%)
- 14.2 Geographic comparison
- Chart on Geographic comparison
- Data Table on Geographic comparison
- 14.3 North America - Market size and forecast 2024-2029
- Chart on North America - Market size and forecast 2024-2029 ($ million)
- Data Table on North America - Market size and forecast 2024-2029 ($ million)
- Chart on North America - Year-over-year growth 2024-2029 (%)
- Data Table on North America - Year-over-year growth 2024-2029 (%)
- 14.4 APAC - Market size and forecast 2024-2029
- Chart on APAC - Market size and forecast 2024-2029 ($ million)
- Data Table on APAC - Market size and forecast 2024-2029 ($ million)
- Chart on APAC - Year-over-year growth 2024-2029 (%)
- Data Table on APAC - Year-over-year growth 2024-2029 (%)
- 14.5 Europe - Market size and forecast 2024-2029
- Chart on Europe - Market size and forecast 2024-2029 ($ million)
- Data Table on Europe - Market size and forecast 2024-2029 ($ million)
- Chart on Europe - Year-over-year growth 2024-2029 (%)
- Data Table on Europe - Year-over-year growth 2024-2029 (%)
- 14.6 South America - Market size and forecast 2024-2029
- Chart on South America - Market size and forecast 2024-2029 ($ million)
- Data Table on South America - Market size and forecast 2024-2029 ($ million)
- Chart on South America - Year-over-year growth 2024-2029 (%)
- Data Table on South America - Year-over-year growth 2024-2029 (%)
- 14.7 Middle East and Africa - Market size and forecast 2024-2029
- Chart on Middle East and Africa - Market size and forecast 2024-2029 ($ million)
- Data Table on Middle East and Africa - Market size and forecast 2024-2029 ($ million)
- Chart on Middle East and Africa - Year-over-year growth 2024-2029 (%)
- Data Table on Middle East and Africa - Year-over-year growth 2024-2029 (%)
- 14.8 US - Market size and forecast 2024-2029
- Chart on US - Market size and forecast 2024-2029 ($ million)
- Data Table on US - Market size and forecast 2024-2029 ($ million)
- Chart on US - Year-over-year growth 2024-2029 (%)
- Data Table on US - Year-over-year growth 2024-2029 (%)
- 14.9 China - Market size and forecast 2024-2029
- Chart on China - Market size and forecast 2024-2029 ($ million)
- Data Table on China - Market size and forecast 2024-2029 ($ million)
- Chart on China - Year-over-year growth 2024-2029 (%)
- Data Table on China - Year-over-year growth 2024-2029 (%)
- 14.10 UK - Market size and forecast 2024-2029
- Chart on UK - Market size and forecast 2024-2029 ($ million)
- Data Table on UK - Market size and forecast 2024-2029 ($ million)
- Chart on UK - Year-over-year growth 2024-2029 (%)
- Data Table on UK - Year-over-year growth 2024-2029 (%)
- 14.11 Germany - Market size and forecast 2024-2029
- Chart on Germany - Market size and forecast 2024-2029 ($ million)
- Data Table on Germany - Market size and forecast 2024-2029 ($ million)
- Chart on Germany - Year-over-year growth 2024-2029 (%)
- Data Table on Germany - Year-over-year growth 2024-2029 (%)
- 14.12 India - Market size and forecast 2024-2029
- Chart on India - Market size and forecast 2024-2029 ($ million)
- Data Table on India - Market size and forecast 2024-2029 ($ million)
- Chart on India - Year-over-year growth 2024-2029 (%)
- Data Table on India - Year-over-year growth 2024-2029 (%)
- 14.13 Canada - Market size and forecast 2024-2029
- Chart on Canada - Market size and forecast 2024-2029 ($ million)
- Data Table on Canada - Market size and forecast 2024-2029 ($ million)
- Chart on Canada - Year-over-year growth 2024-2029 (%)
- Data Table on Canada - Year-over-year growth 2024-2029 (%)
- 14.14 Japan - Market size and forecast 2024-2029
- Chart on Japan - Market size and forecast 2024-2029 ($ million)
- Data Table on Japan - Market size and forecast 2024-2029 ($ million)
- Chart on Japan - Year-over-year growth 2024-2029 (%)
- Data Table on Japan - Year-over-year growth 2024-2029 (%)
- 14.15 Australia - Market size and forecast 2024-2029
- Chart on Australia - Market size and forecast 2024-2029 ($ million)
- Data Table on Australia - Market size and forecast 2024-2029 ($ million)
- Chart on Australia - Year-over-year growth 2024-2029 (%)
- Data Table on Australia - Year-over-year growth 2024-2029 (%)
- 14.16 France - Market size and forecast 2024-2029
- Chart on France - Market size and forecast 2024-2029 ($ million)
- Data Table on France - Market size and forecast 2024-2029 ($ million)
- Chart on France - Year-over-year growth 2024-2029 (%)
- Data Table on France - Year-over-year growth 2024-2029 (%)
- 14.17 South Korea - Market size and forecast 2024-2029
- Chart on South Korea - Market size and forecast 2024-2029 ($ million)
- Data Table on South Korea - Market size and forecast 2024-2029 ($ million)
- Chart on South Korea - Year-over-year growth 2024-2029 (%)
- Data Table on South Korea - Year-over-year growth 2024-2029 (%)
- 14.18 Market opportunity by geography
- Market opportunity by geography ($ million)
- Data Tables on Market opportunity by geography ($ million)
15 Drivers, Challenges, and Opportunity/Restraints
- 15.3 Impact of drivers and challenges
- Impact of drivers and challenges in 2024 and 2029
- 15.4 Market opportunities/restraints
16 Competitive Landscape
- 16.2 Competitive Landscape
- Overview on criticality of inputs and factors of differentiation
- 16.3 Landscape disruption
- Overview on factors of disruption
- 16.4 Industry risks
- Impact of key risks on business
17 Competitive Analysis
- 17.2 Company ranking index
- 17.3 Market positioning of companies
- Matrix on companies position and classification
- 17.4 Damro Furnitures Pvt. Ltd.
- Damro Furnitures Pvt. Ltd. - Overview
- Damro Furnitures Pvt. Ltd. - Product / Service
- Damro Furnitures Pvt. Ltd. - Key offerings
- SWOT
- 17.5 Durian Pvt. Ltd.
- Durian Pvt. Ltd. - Overview
- Durian Pvt. Ltd. - Product / Service
- Durian Pvt. Ltd. - Key offerings
- SWOT
- 17.6 Ergo lab
- Ergo lab - Overview
- Ergo lab - Product / Service
- Ergo lab - Key offerings
- SWOT
- 17.7 Eurotech Design Systems Pvt. Ltd.
- Eurotech Design Systems Pvt. Ltd. - Overview
- Eurotech Design Systems Pvt. Ltd. - Product / Service
- Eurotech Design Systems Pvt. Ltd. - Key offerings
- SWOT
- 17.8 GM Seaing LLC
- GM Seaing LLC - Overview
- GM Seaing LLC - Product / Service
- GM Seaing LLC - Key offerings
- SWOT
- 17.9 Haworth Inc.
- Haworth Inc. - Overview
- Haworth Inc. - Product / Service
- Haworth Inc. - Key offerings
- SWOT
- 17.10 HNI Corp.
- HNI Corp. - Overview
- HNI Corp. - Business segments
- HNI Corp. - Key news
- HNI Corp. - Key offerings
- HNI Corp. - Segment focus
- SWOT
- 17.11 MillerKnoll Inc.
- MillerKnoll Inc. - Overview
- MillerKnoll Inc. - Business segments
- MillerKnoll Inc. - Key offerings
- MillerKnoll Inc. - Segment focus
- SWOT
- 17.12 Nilkamal Ltd.
- Nilkamal Ltd. - Overview
- Nilkamal Ltd. - Product / Service
- Nilkamal Ltd. - Key offerings
- SWOT
- 17.13 Okamura Corp.
- Okamura Corp. - Overview
- Okamura Corp. - Business segments
- Okamura Corp. - Key offerings
- Okamura Corp. - Segment focus
- SWOT
- 17.14 PSI Seating Ltd.
- PSI Seating Ltd. - Overview
- PSI Seating Ltd. - Product / Service
- PSI Seating Ltd. - Key offerings
- SWOT
- 17.15 Steelcase Inc.
- Steelcase Inc. - Overview
- Steelcase Inc. - Business segments
- Steelcase Inc. - Key news
- Steelcase Inc. - Key offerings
- Steelcase Inc. - Segment focus
- SWOT
- 17.16 TOPSTAR GMBH
- TOPSTAR GMBH - Overview
- TOPSTAR GMBH - Product / Service
- TOPSTAR GMBH - Key offerings
- SWOT
- 17.17 True Innovations
- True Innovations - Overview
- True Innovations - Product / Service
- True Innovations - Key offerings
- SWOT
- 17.18 Zivella Office Furniture
- Zivella Office Furniture - Overview
- Zivella Office Furniture - Product / Service
- Zivella Office Furniture - Key offerings
- SWOT
18 Appendix
- 18.2 Inclusions and exclusions checklist
- Inclusions checklist
- Exclusions checklist
- 18.3 Currency conversion rates for US$
- Currency conversion rates for US$
- 18.4 Research methodology
- 18.7 Validation techniques employed for market sizing
- Validation techniques employed for market sizing
- 18.9 360 degree market analysis
- 360 degree market analysis
- 18.10 List of abbreviations