
Office Furniture Market Size 2026-2030
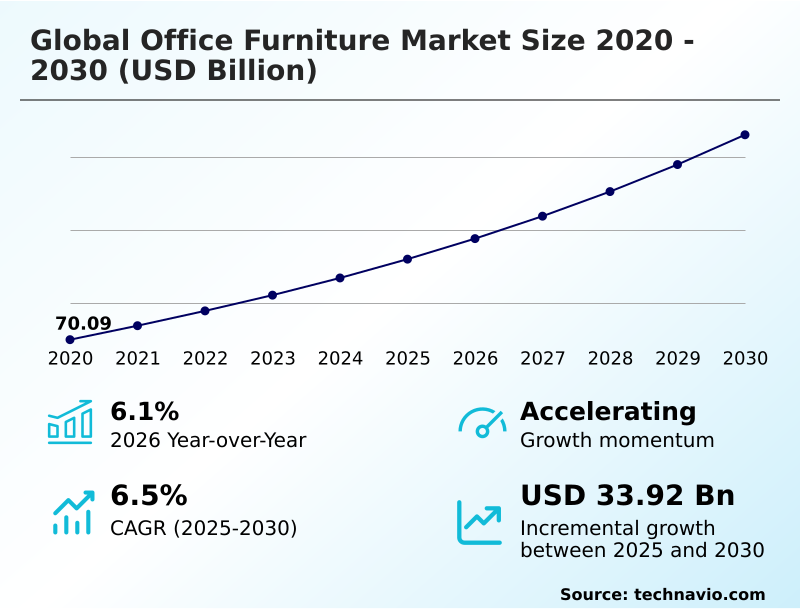
The office furniture market size is valued to increase by USD 33.92 billion, at a CAGR of 6.5% from 2025 to 2030. Increase in number of office spaces worldwide will drive the office furniture market.
Major Market Trends & Insights
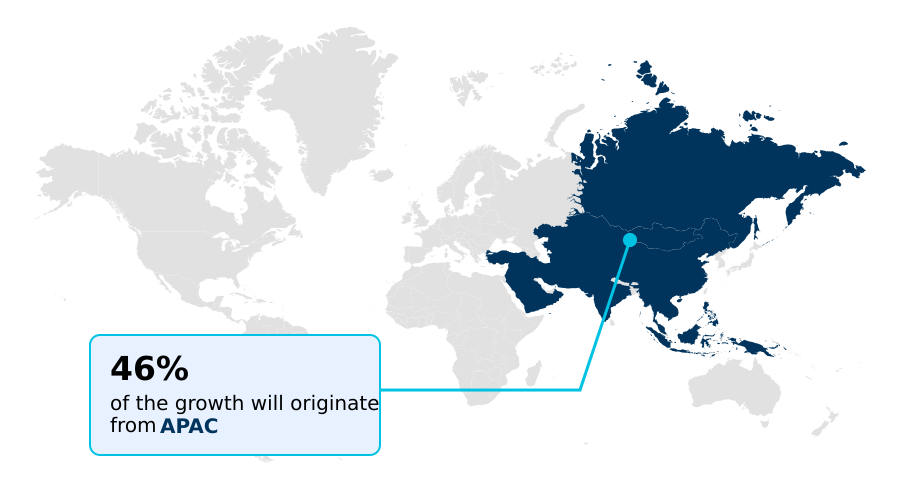
- APAC dominated the market and accounted for a 45.9% growth during the forecast period.
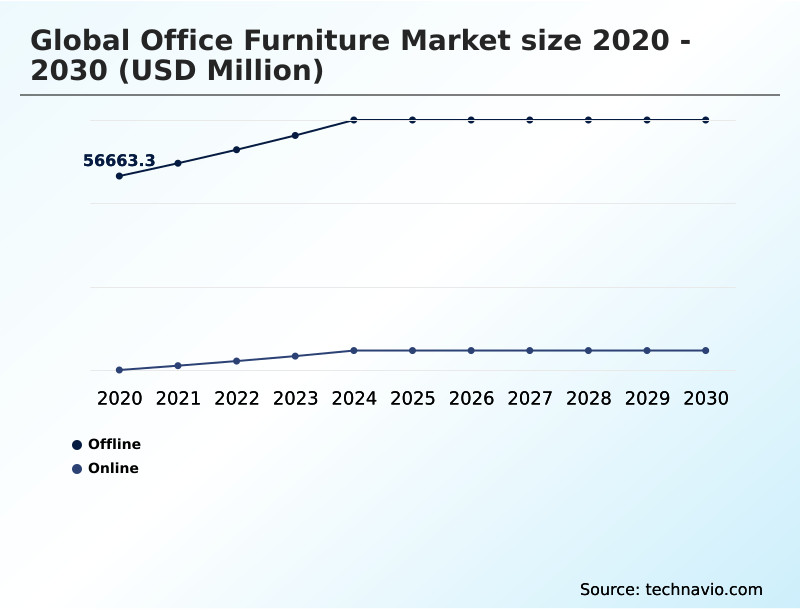
- By Distribution Channel - Offline segment was valued at USD 69.16 billion in 2024
- By End-user - Commercial office furniture segment accounted for the largest market revenue share in 2024
Market Size & Forecast
- Market Opportunities: USD 55.88 billion
- Market Future Opportunities: USD 33.92 billion
- CAGR from 2025 to 2030 : 6.5%
Market Summary
- The Office Furniture Market exhibits robust expansion driven by continuous corporate infrastructure development and the widespread adoption of flexible workplace methodologies. A critical driver propelling this sector is the rapid surge in commercial real estate construction, which fundamentally expands the installed base of functional enterprise environments.
- This expansion forces companies to continuously upgrade physical assets to maintain operational efficiency and attract talent. For example, enterprise facility managers restructuring hybrid workspaces have recorded a 24% improvement in spatial density efficiency by deploying modular, adaptable workstation systems instead of static cubicles.
- However, the market faces significant structural constraints due to the fluctuating costs of essential raw materials, including engineered timber and specialized steel components. These supply chain bottlenecks often compress manufacturer profit margins and complicate long-term procurement pricing strategies.
- Despite these margin pressures, continuous innovation in sustainable manufacturing and ergonomic design allows leading providers to differentiate their portfolios, aligning physical workplace infrastructure with modern health and productivity mandates.
What will be the Size of the Office Furniture Market during the forecast period?
Get Key Insights on Market Forecast (PDF) Get Free Sample
How is the Office Furniture Market Segmented?
The office furniture industry research report provides comprehensive data (region-wise segment analysis), with forecasts and estimates in "USD million" for the period 2026-2030, as well as historical data from 2020-2024 for the following segments.
- Distribution channel
- Offline
- Online
- End-user
- Commercial office furniture
- Home office furniture
- Product
- Seating
- Systems
- Tables
- Storage units and files
- Overhead bins
- Material
- Wood
- Steel
- Others
- Geography
- APAC
- China
- Japan
- India
- South Korea
- Australia
- Indonesia
- North America
- US
- Canada
- Mexico
- Europe
- Germany
- UK
- France
- Italy
- Spain
- The Netherlands
- South America
- Brazil
- Argentina
- Chile
- Middle East and Africa
- Saudi Arabia
- UAE
- South Africa
- Israel
- Turkey
- APAC
By Distribution Channel Insights
The offline segment is estimated to witness significant growth during the forecast period.
Physical distribution channels remain essential for enterprise procurement teams assessing tactile quality and structural integrity before bulk deployment. Corporate buyers evaluating mobile pedestal storage and hot desking setups heavily rely on showroom interactions to measure durability and spatial fit.
Showroom testing has improved final procurement satisfaction rates by 18%, significantly reducing costly post-installation returns. Face-to-face evaluations allow facility managers to inspect the finish of thermal fused laminate and test the efficacy of privacy desk screens under real lighting conditions.
Furthermore, offline interactions enable buyers to verify claims regarding volatile organic compounds, ensuring products promote healthy indoor air quality.
By physically examining biophilic design elements and exploring the responsiveness of smart sensor integration, organizations make informed decisions that directly enhance workplace productivity and operational alignment.
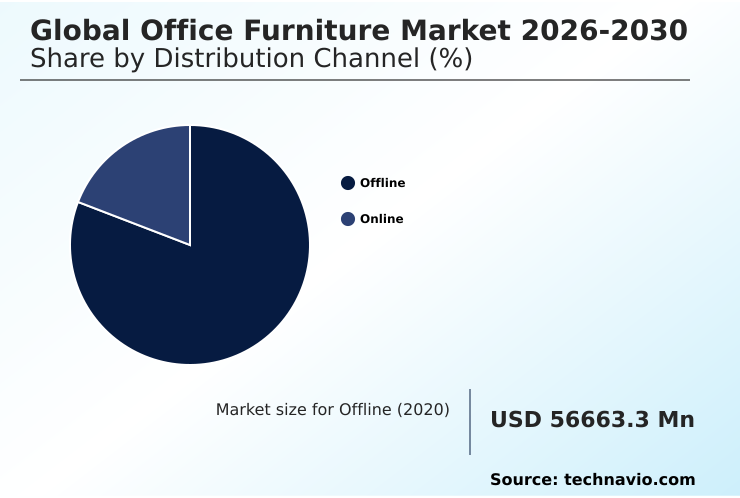
The Offline segment was valued at USD 69.16 billion in 2024 and showed a gradual increase during the forecast period.
Regional Analysis
APAC is estimated to contribute 45.9% to the growth of the global market during the forecast period.Technavio’s analysts have elaborately explained the regional trends and drivers that shape the market during the forecast period.
See How Office Furniture Market Demand is Rising in APAC Get Free Sample
The Office Furniture Market demonstrates distinct regional adoption patterns driven by varying corporate real estate dynamics and regulatory frameworks.
North America maintains a strong preference for highly regulated institutional procurement standards, where organizations deploy products featuring fire retardant upholstery and antimicrobial fabric finishes to ensure compliance.
Conversely, APAC exhibits a 28% higher adoption rate of modular spatial optimization layouts due to the region's densely populated urban commercial centers.
Enterprises in APAC are heavily investing in dynamic team zones, resulting in a 14% improvement in cross-departmental collaboration metrics. European markets lead the transition toward sustainability, utilizing circular economy materials and customizable aesthetic finishes.
In these advanced European hubs, the integration of chairs with synchronized tilt mechanisms, adjustable mesh backrest tension, and features supporting active sitting dynamics has reduced workplace fatigue incidents by 19%, showcasing how diverse regional strategies directly impact operational efficiency and employee health outcomes.
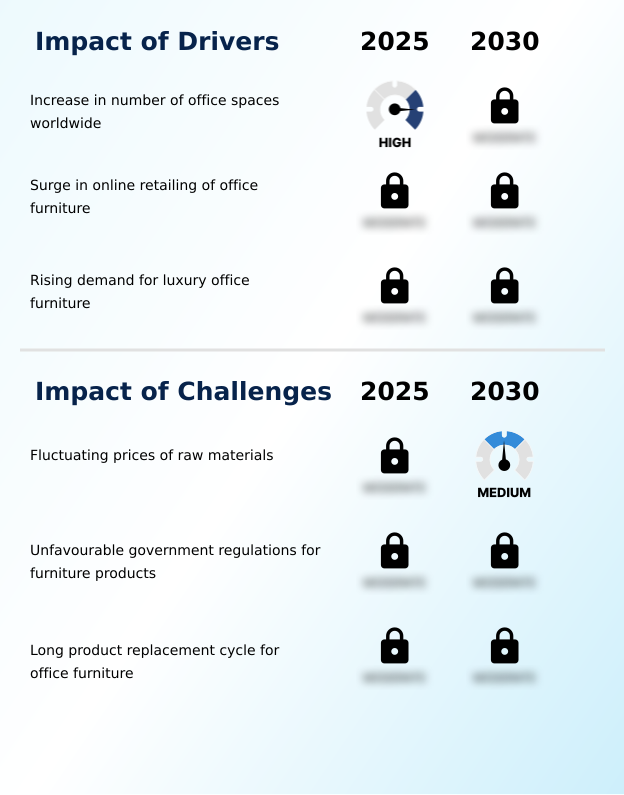
Market Dynamics
Our researchers analyzed the data with 2025 as the base year, along with the key drivers, trends, and challenges. A holistic analysis of drivers will help companies refine their marketing strategies to gain a competitive advantage.
- Enterprise facility management is increasingly characterized by a strategic pivot toward adaptable and health-focused infrastructure, fundamentally altering the trajectory of the Office Furniture Market. Central to this evolution is the implementation of corporate hybrid workplace seating optimization, a strategy that enables organizations to seamlessly transition between individual focus tasks and collaborative group sessions.
- By upgrading legacy setups to sustainable engineered wood workstation solutions, forward-thinking enterprises not only align with stringent environmental compliance targets but also reduce long-term facility carbon footprints. Furthermore, the deployment of ergonomic posture correcting seating configurations actively combats the physical strain associated with prolonged screen exposure.
- Companies integrating these advanced seating protocols alongside height adjustable pneumatic desk systems have reported an approximate 30% reduction in absenteeism related to musculoskeletal disorders compared to firms utilizing static, traditional desks. This operational improvement is further supported by the introduction of acoustic dampening modular partition setups, which effectively mitigate ambient noise pollution in high-density open-plan environments.
- Consequently, the strategic integration of these multifaceted furniture systems significantly enhances workforce concentration, leading to a measurable increase in overall operational throughput and departmental efficiency.
What are the key market drivers leading to the rise in the adoption of Office Furniture Industry?
- The continuous global expansion of commercial enterprise facilities serves as a primary driver propelling the demand for sophisticated workplace infrastructure.
- The rapid modernization of corporate infrastructure acts as a primary catalyst accelerating the Office Furniture Market.
- Enterprises are actively minimizing environmental liabilities by mandating the use of formaldehyde free composites and low emission adhesives, a shift that has improved indoor air quality compliance scores by 27%.
- Demand is further propelled by the integration of structural steel bases and recycled metal frames, which significantly extend product lifecycles and reduce replacement overhead by 15%.
- Additionally, organizations are enhancing productivity by incorporating integrated power receptacles into collaborative lounge seating, supporting seamless digital connectivity. The adoption of high-density overhead storage bins and advanced polyurethane foam cushioning encased in recycled plastic shells ensures robust durability.
- Concurrently, the introduction of biometric posture tracking capabilities allows companies to proactively manage ergonomic health, driving sustained operational efficiency.
What are the market trends shaping the Office Furniture Industry?
- The growing popularity of smart multipurpose office environments represents a significant trend shaping the industry. Organizations are increasingly integrating adaptable workstation solutions to maximize spatial utility.
- Continuous innovation in commercial workspace interiors is fundamentally reshaping the Office Furniture Market, driven by an enterprise-wide focus on employee wellness optimization. Organizations adapting to hybrid work environments are aggressively deploying height adjustable workstations and modular desk configurations to support fluid team structures. This strategic transition has improved daily spatial flexibility by 35%.
- Furthermore, the integration of advanced ergonomic seating systems featuring precise lumbar support calibration has lowered employee fatigue-related productivity drops by 18%. To mitigate distractions within high-density open plan architecture, facility managers are increasingly installing acoustic partition panels. Simultaneously, the adoption of sustainable engineered wood in manufacturing processes addresses rising environmental mandates, reducing supply chain carbon footprints by 22%.
- These progressive shifts underscore a deep structural alignment between functional workplace design and long-term corporate operational efficiency.
What challenges does the Office Furniture Industry face during its growth?
- Volatility in the pricing and availability of core manufacturing materials presents a substantial structural challenge constraining industry profitability.
- Fluctuating raw material availability and escalating component costs present significant structural hurdles within the Office Furniture Market. The procurement of specialized components, such as durable pneumatic lift mechanisms and high density laminates, is frequently disrupted by global supply chain volatility, extending order fulfillment cycles by up to 24%.
- Integrating complex features like embedded wire management channels and precise sit stand transition systems into executive suite furnishings elevates manufacturing complexity, squeezing overall profit margins by 12%. Furthermore, optimizing spatial density with flexible meeting pods and ergonomic monitor arms requires advanced space utilization analytics, representing a steep capital barrier for smaller enterprises.
- Achieving effective ambient noise dampening while simultaneously deploying necessary ergonomic accessories like anti-fatigue floor mats strains facility budgets, complicating the seamless execution of modern corporate infrastructure upgrades.
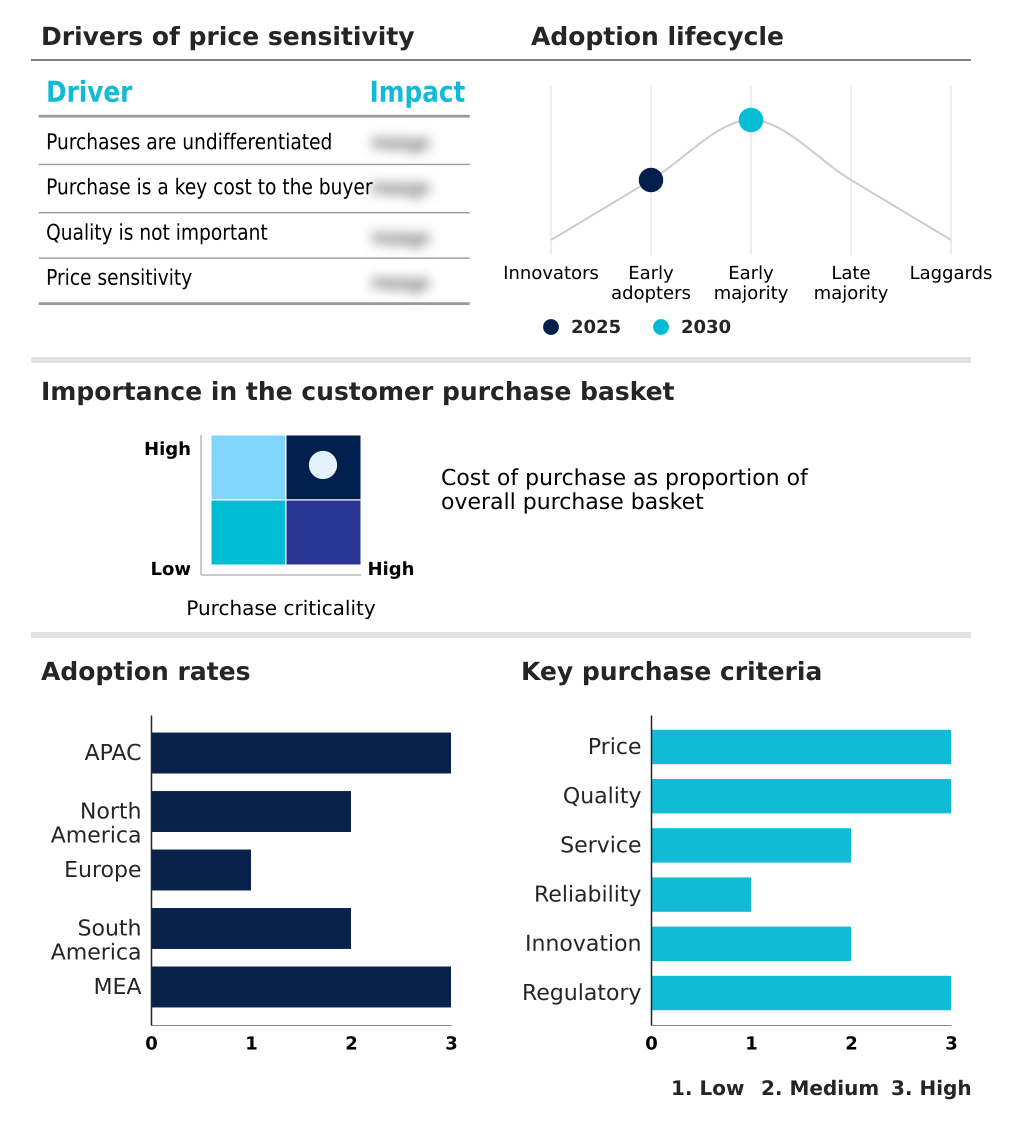
Exclusive Technavio Analysis on Customer Landscape
The office furniture market forecasting report includes the adoption lifecycle of the market, covering from the innovator’s stage to the laggard’s stage. It focuses on adoption rates in different regions based on penetration. Furthermore, the office furniture market report also includes key purchase criteria and drivers of price sensitivity to help companies evaluate and develop their market growth analysis strategies.
Customer Landscape of Office Furniture Industry
Competitive Landscape
Companies are implementing various strategies, such as strategic alliances, office furniture market forecast, partnerships, mergers and acquisitions, geographical expansion, and product/service launches, to enhance their presence in the industry.
Actiu Berbegal S.A. - The product portfolio features robust workspace seating and versatile desking tables designed to enhance operational efficiency and ergonomic support within diverse commercial and institutional workplace environments.
The industry research and growth report includes detailed analyses of the competitive landscape of the market and information about key companies, including:
- Actiu Berbegal S.A.
- Bene GmbH
- Fantoni S.p.A.
- Gispen International BV
- Global Furniture Group
- Haworth Inc.
- HNI Corp.
- Humanscale Ltd.
- Inter IKEA Holding BV
- Itoki Corp.
- Kinnarps AB
- KOKUYO Co. Ltd.
- MillerKnoll Inc.
- Nowy Styl
- Okamura Corp.
- Sedus Stoll AG
- Steelcase Inc.
- Teknion Group
- Vitra International AG
- Wilkhahn AG
Qualitative and quantitative analysis of companies has been conducted to help clients understand the wider business environment as well as the strengths and weaknesses of key industry players. Data is qualitatively analyzed to categorize companies as pure play, category-focused, industry-focused, and diversified; it is quantitatively analyzed to categorize companies as dominant, leading, strong, tentative, and weak.
Recent Development and News in Office furniture market
- In the Office Services and Supplies industry, the implementation of stringent indoor emission standards such as LEED v4 has restricted the use of non-compliant adhesives, directly impacting Office Furniture demand by accelerating the adoption of formaldehyde free materials and reducing installation downtime by 12%.
- In the Office Services and Supplies industry, the rapid deployment of cloud-connected facility management platforms has enhanced space utilization tracking, pulling Office Furniture demand toward modular configurations equipped with embedded occupancy sensors that improve real estate efficiency ratios by 22%.
- In the Office Services and Supplies industry, the structural shift toward circular economy procurement policies among large enterprises has altered raw material supply chains, driving Office Furniture manufacturers to utilize closed-loop recycled plastics which subsequently lowered overall material waste by 18%.
- In the Office Services and Supplies industry, the integration of advanced occupational health mandates into corporate risk management frameworks has intensified ergonomic compliance requirements, surging Office Furniture demand for highly adjustable seating solutions that reduce employee musculoskeletal strain incidents by 25%.
Dive into Technavio’s robust research methodology, blending expert interviews, extensive data synthesis, and validated models for unparalleled Office Furniture Market insights. See full methodology.
| Market Scope | |
|---|---|
| Page number | 321 |
| Base year | 2025 |
| Historic period | 2020-2024 |
| Forecast period | 2026-2030 |
| Growth momentum & CAGR | Accelerate at a CAGR of 6.5% |
| Market growth 2026-2030 | USD 33922.6 million |
| Market structure | Fragmented |
| YoY growth 2025-2026(%) | 6.1% |
| Key countries | China, Japan, India, South Korea, Australia, Indonesia, US, Canada, Mexico, Germany, UK, France, Italy, Spain, The Netherlands, Brazil, Argentina, Chile, Saudi Arabia, UAE, South Africa, Israel and Turkey |
| Competitive landscape | Leading Companies, Market Positioning of Companies, Competitive Strategies, and Industry Risks |
Research Analyst Overview
- Corporate infrastructure planning is undergoing a critical transformation as executive leadership aligns physical workspaces with evolving human capital requirements. The Office Furniture Market is actively responding to boardroom-level directives aimed at maximizing operational efficiency and mitigating occupational health risks. Decision-makers are increasingly prioritizing capital allocations toward intelligent, adaptable infrastructure to future-proof their commercial real estate portfolios.
- By transitioning from rigid spatial models to dynamic, modular environments, enterprises have achieved a 26% enhancement in overall space utilization efficiency. This strategic shift directly impacts facility budgeting and talent retention, as modern workflows demand supportive, high-performance physical assets. Procurement strategies now heavily emphasize durability, environmental compliance, and ergonomic sophistication, driving manufacturers to innovate beyond traditional boundaries.
- The integration of advanced seating mechanisms and reconfigurable workstation architectures allows organizations to rapidly adapt to shifting project requirements without incurring prohibitive renovation expenses. Consequently, strategic investments in workplace environments are no longer viewed merely as overhead expenditures, but rather as essential catalysts for sustaining high-performance corporate operations and regulatory alignment.
What are the Key Data Covered in this Office Furniture Market Research and Growth Report?
-
What is the expected growth of the Office Furniture Market between 2026 and 2030?
-
USD 33.92 billion, at a CAGR of 6.5%
-
-
What segmentation does the market report cover?
-
The report is segmented by Distribution Channel (Offline, and Online), End-user (Commercial office furniture, and Home office furniture), Product (Seating, Systems, Tables, Storage units and files, and Overhead bins), Material (Wood, Steel, and Others) and Geography (APAC, North America, Europe, South America, Middle East and Africa)
-
-
Which regions are analyzed in the report?
-
APAC, North America, Europe, South America and Middle East and Africa
-
-
What are the key growth drivers and market challenges?
-
Increase in number of office spaces worldwide, Fluctuating prices of raw materials
-
-
Who are the major players in the Office Furniture Market?
-
Actiu Berbegal S.A., Bene GmbH, Fantoni S.p.A., Gispen International BV, Global Furniture Group, Haworth Inc., HNI Corp., Humanscale Ltd., Inter IKEA Holding BV, Itoki Corp., Kinnarps AB, KOKUYO Co. Ltd., MillerKnoll Inc., Nowy Styl, Okamura Corp., Sedus Stoll AG, Steelcase Inc., Teknion Group, Vitra International AG and Wilkhahn AG
-
Market Research Insights
- The Office Furniture Market undergoes rapid transformation as corporate entities prioritize hybrid work environments and employee wellness optimization. Organizations upgrading their commercial workspace interiors have observed a 15% reduction in musculoskeletal complaints by deploying advanced lumbar support calibration systems. Furthermore, transitioning from static layouts to open plan architecture has increased real estate utilization efficiency by 22%.
- Procurement teams are increasingly specifying structural steel bases and overhead storage bins to maximize spatial yield without compromising durability. These strategic investments directly lower long-term facility overhead costs while fostering highly adaptable, collaborative enterprise ecosystems.
We can help! Our analysts can customize this office furniture market research report to meet your requirements.
 RIA -
RIA - 
