Ethical Label Market Size 2024-2028
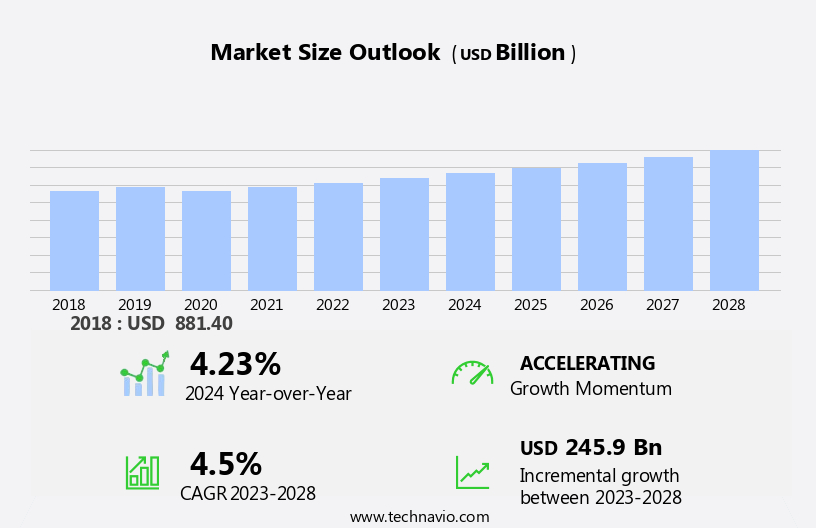
The ethical label market size is forecast to increase by USD 245.9 billion at a CAGR of 4.5% between 2023 and 2028.
- The market is witnessing significant growth due to increasing concerns and awareness surrounding the consumption of responsibly produced food and sustainable meat products. Consumers are becoming more conscious of the environmental impact of their food choices and are seeking out labels that assure the ethical treatment of animals and sustainable farming practices. However, this market faces challenges in keeping up with changing food regulations and ensuring transparency and traceability in the supply chain. Emerging technologies such as blockchain, global positioning system tracking, and artificial intelligence are enhancing traceability and transparency in the supply chain. Producers and retailers must navigate these complexities to meet consumer demands and maintain trust in the market.
What will be the Size of the Ethical Label Market During the Forecast Period?
- The market, also known as the market for environmentally friendly and sustainability-certified food products, has experienced significant growth in recent years. Authorities and consumers alike prioritize food safety and transparency, driving demand for labels indicating organic production, adherence to cancer, diabetes, and cardiovascular disease prevention standards, and certifications for halal food and animal welfare. Ethical labels signaling clean production methods, free from artificial sweeteners and flavors, resonate with flexitarian consumers. Online channels are increasingly important distribution points for these products, catering to diverse populations with specific dietary needs and preferences.
How is the Ethical Label Industry segmented and which is the largest segment?
The industry research report provides comprehensive data (region-wise segment analysis), with forecasts and estimates in "USD billion" for the period 2024-2028, as well as historical data from 2018-2022 for the following segments.
- Product
- Food
- Beverage
- Geography
- North America
- US
- APAC
- China
- Japan
- Europe
- UK
- South America
- Brazil
- Middle East and Africa
- North America
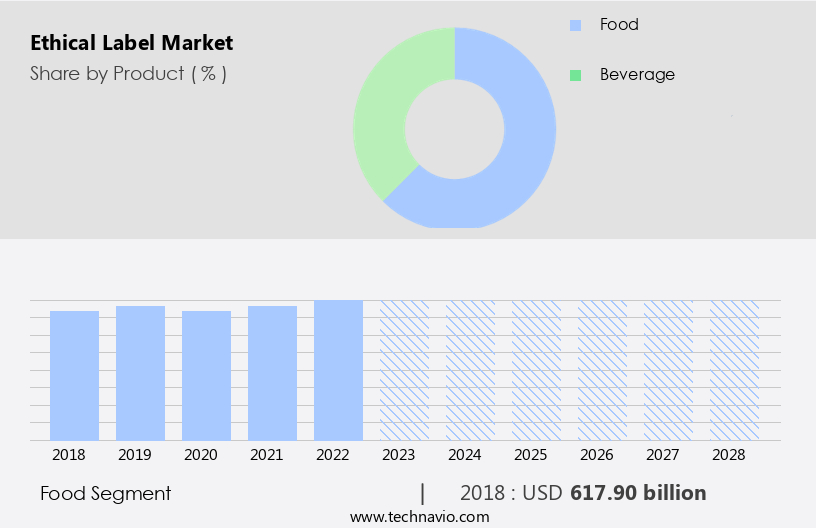
By Product Insights
The food segment is estimated to witness significant growth during the forecast period. The global food market has seen a significant shift towards ethical and sustainable practices in response to international obligations on labor rights and food security established post-World War II. The UN, among other organizations, has played a crucial role in promoting food security and ethical labor conditions. The pendulum swung back towards free trade in the 1970s, leading to the emergence of fair and ethical commerce in the agriculture and food sectors. Ethical labels such as Organic, Halal, Fairtrade, Kosher, Vegan, and Animal Welfare have gained popularity, reflecting consumer preferences for transparency and sustainability. Environmental friendliness, sustainability standards, and food safety are key concerns for authorities and commercial buyers.
Technologies like Blockchain, Global Positioning System, Artificial Intelligence, and Machine Learning are being employed to ensure traceability, temperature, humidity, and air quality control in the production and distribution of foods and beverages. The millennial and baby boomer populations, as well as flexitarian consumers, are driving demand for clean labels, free from artificial sweeteners, flavors, and preservatives. Halal and Organic food segments are particularly significant in catering to the Muslim population and health-conscious consumers, respectively. Online and physical retail channels, including supermarkets, hypermarkets, and commercial buyers, are adapting to these trends.
Get a glance at the market report of share of various segments Request Free Sample
The Food segment was valued at USD 617.90 billion in 2018 and showed a gradual increase during the forecast period.
Regional Analysis
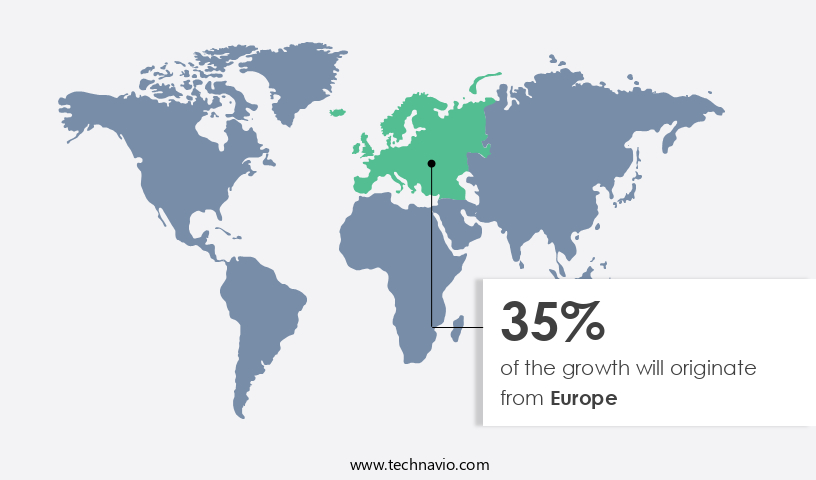
Europe is estimated to contribute 35% to the growth of the global market during the forecast period. Technavio's analysts have elaborately explained the regional trends and drivers that shape the market during the forecast period.
For more insights on the market size of various regions, Request Free Sample
Another region offering significant growth opportunities to companies is North America. The North American food and beverage industry is witnessing an increasing emphasis on ethical labeling in response to stricter food safety regulations. In December 2021, the US Food and Drug Administration (FDA) finalized the Laboratory Accreditation rule under the Food Safety and Modernization Act (FSMA), passed in 2011. This regulation focuses on preventing food contamination rather than just mitigating foodborne diseases, leading to a rise in demand for ethical labeling solutions. Ethical labels such as Environment Friendly Practices, Sustainability Standards, Organic Food, Halal Food, Animal Welfare, Vegan, and Fairtrade are gaining popularity among consumers. Authorities like the FDA and commercial buyers are also favoring these labels to ensure food safety, hygiene, and traceability.
Technologies like Blockchain, Global Positioning System, Artificial Intelligence, and Machine Learning are being integrated to enhance traceability and ensure the authenticity of these labels. The trend is expected to continue during the forecast period, with millennials and baby boomers, as well as the Muslim population, showing a preference for these labels.
Market Dynamics
Our researchers analyzed the data with 2023 as the base year, along with the key drivers, trends, and challenges. A holistic analysis of drivers will help companies refine their marketing strategies to gain a competitive advantage.
What are the key market drivers leading to the rise in the adoption of Ethical Label Industry?
- Concerns over and awareness of consuming the appropriate food is the key driver of the market. The market is experiencing significant growth due to increasing consumer awareness and preference for environmentally friendly practices and sustainability standards. This trend is particularly prominent among Millennials and the Baby Boomer population, who are increasingly shifting towards clean-label and certified food products. Ethical labels, such as organic, vegan, halal, and kosher, are perceived as healthier alternatives to traditional animal-based meals and processed foods. Food safety, hygiene, and animal welfare certifications are becoming essential for commercial buyers and retailers, including physical retail stores, supermarkets, and hypermarkets. The use of technology, such as blockchain, global positioning system, artificial intelligence, and machine learning, is enhancing traceability and ensuring the authenticity of ethical food products.
- Sustainable farming practices, such as those that prioritize temperature, humidity, and air quality, are gaining popularity among consumers concerned about the environmental impact of their food choices. The demand for ethical labels is also expanding to beverages, with a growing focus on non-alcoholic, plant-based alternative beverages. Favorable regulations and online channels are further fueling the growth of the market. Consumers are increasingly turning to online platforms to purchase ethical food and beverage products, and companies are responding by offering convenient and accessible options. The market is expected to continue expanding as more consumers prioritize health, sustainability, and ethical considerations in their purchasing decisions.
What are the market trends shaping the Ethical Label Industry?
- Concerns over and awareness of the environmental sustainability of meat products is the upcoming market trend. The market is experiencing significant growth due to increasing consumer awareness and concern for sustainability and environmental friendliness in food production. Organic food items, free from artificial sweeteners, flavors, and preservatives, are gaining popularity as healthier alternatives. Ethical labels signifying sustainable farming practices, animal welfare certifications, and Fairtrade are becoming essential for food and beverage companies to cater to evolving consumer preferences. Moreover, the rise of veganism and flexitarianism is contributing to the expansion of the ethical label industry. Consumers are becoming more conscious of their consumption patterns and their impact on the environment. Though the number of vegans is still a small percentage of the population, it is expected to grow significantly In the coming years.
- Halal and kosher certifications are also driving demand for ethical labels In the food industry. The integration of technology such as blockchain, global positioning system, artificial intelligence, and machine learning is enhancing traceability and ensuring food safety and hygiene. Sensors for temperature, humidity, and air quality are also essential for maintaining the quality of packaged foods. These factors are making ethical labels a must-have for food and beverage companies to meet the demands of the growing consumer base. The market caters to various demographics, including millennials and baby boomers, who prioritize health and sustainability. Commercial buyers, supermarkets, hypermarkets, and physical retail stores are also adopting ethical labels to cater to the changing consumer preferences.
What challenges does the Ethical Label Industry face during its growth?
- Challenges about changing food regulations is a key challenge affecting the industry's growth. Ethical labels play a significant role in the food industry as consumers increasingly prioritize environmentally friendly practices and sustainability standards. Authorities enforce stringent regulations to ensure food safety, hygiene, and the welfare of the working population. Organic food, free from cancer, diabetes, and cardiovascular diseases, is a growing market segment. Food manufacturers must comply with regulations such as (EC) 178/2002, which highlights their responsibility for product safety. Environmentally conscious consumers seek foods and beverages with certifications like Halal, Organic, Fairtrade, Kosher, and Animal Welfare. Technology innovations like Blockchain, Global Positioning System, Artificial Intelligence, and Machine Learning offer traceability through sensors monitoring temperature, humidity, and air quality.
- Sustainable farming practices are crucial, and clean labels with no artificial sweeteners, flavors, or preservatives appeal to millennials and baby boomers. Flexitarian consumers and commercial buyers prefer foods and beverages with favorable regulations and clean, free tags. Online and physical retail stores, supermarkets, and hypermarkets cater to the Muslim population and their halal food requirements. Food safety and sustainability are essential for businesses, making compliance with regulations a priority.
Exclusive Customer Landscape
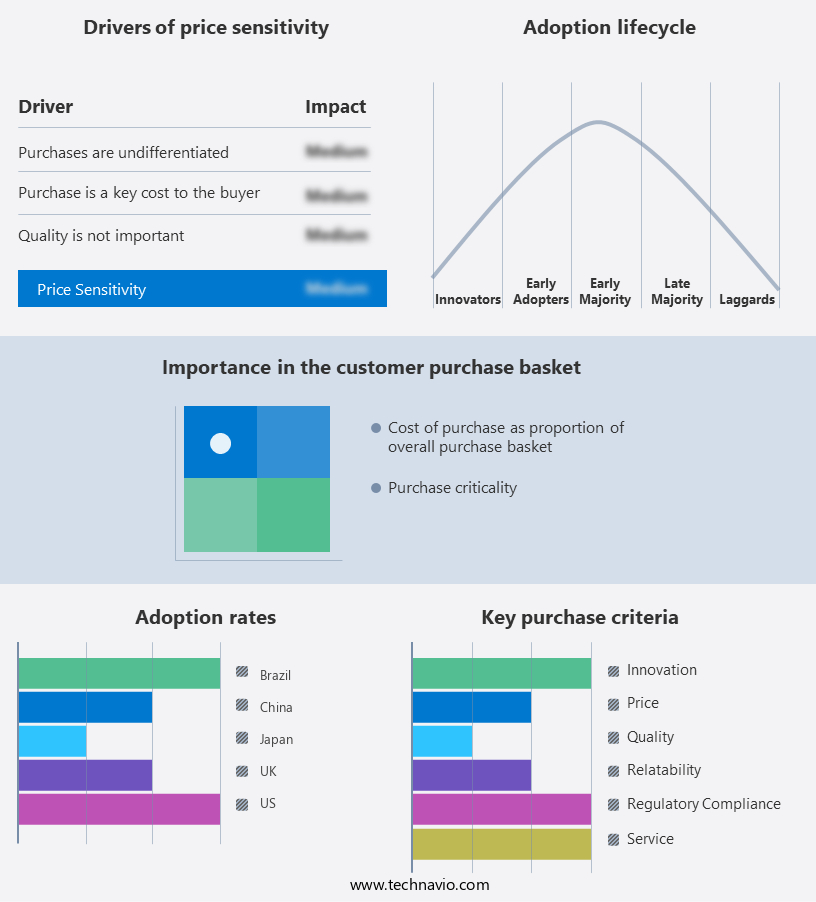
The market forecasting report includes the adoption lifecycle of the market, covering the innovator's stage to the laggard's stage. It focuses on adoption rates in different regions based on penetration. Furthermore, the market report also includes key purchase criteria and drivers of price sensitivity to help companies evaluate and develop their market growth analysis strategies.
Customer Landscape
Key Companies & Market Insights
Companies are implementing various strategies, such as strategic alliances, market forecast, partnerships, mergers and acquisitions, geographical expansion, and product/service launches, to enhance their presence in the industry.
The industry research and growth report includes detailed analyses of the competitive landscape of the market and information about key companies, including:
- Abbots Butcher Inc.
- Archer Daniels Midland Co.
- BASF SE
- Blue Diamond Growers
- Cargill Inc.
- Danone SA
- Earths Own Food Co. Inc.
- Ferrero International S.A.
- Garden of Life LLC
- Kellogg Co.
- Kerry Group Plc
- Koninklijke DSM NV
- Marks and Spencer Group plc
- Mars Inc.
- Nestle SA
- Nuzest Life Pty Ltd.
- PepsiCo Inc.
- Starbucks Corp.
- The American Halal Co. Inc.
- The Hain Celestial Group Inc.
- The Hershey Co.
- The Kraft Heinz Co.
- Unilever PLC
Qualitative and quantitative analysis of companies has been conducted to help clients understand the wider business environment as well as the strengths and weaknesses of key industry players. Data is qualitatively analyzed to categorize companies as pure play, category-focused, industry-focused, and diversified; it is quantitatively analyzed to categorize companies as dominant, leading, strong, tentative, and weak.
Research Analyst Overview
Ethical labels have gained significant traction in the global market as consumers increasingly prioritize environmentally friendly practices and sustainability standards. These labels signify that certain production processes adhere to specific ethical guidelines, ensuring transparency and accountability throughout the supply chain. Authorities play a crucial role in enforcing these standards, which can include regulations related to food safety, hygiene, and the working population. Organic food production, for instance, follows stringent guidelines to maintain the integrity of the organic label. The demand for ethical labels extends beyond food and beverages. Halal food, for example, adheres to Islamic dietary laws, while Fairtrade labels ensure fair wages and safe working conditions for producers.
Moreover, animal welfare certifications, vegan labels, and clean labels without artificial sweeteners, flavors, or preservatives cater to various consumer preferences. The market dynamics for ethical labels are influenced by several factors. Favorable regulations, online and offline sales channels, and the growing population segments, such as millennials and baby boomers, contribute to the growth of this sector. Millennials, in particular, are known for their preference for flexitarian diets and online shopping. They are more likely to seek out clean labels and traceability features, which can be facilitated through technology such as blockchain, global positioning systems, and sensors. These technologies enable real-time monitoring of temperature, humidity, and air quality, ensuring the integrity of the product from farm to table.
Furthermore, the Muslim population is another significant consumer segment that drives demand for ethical labels, particularly for halal food. Halal food production follows strict guidelines related to animal welfare and processing methods, ensuring that the food is permissible under Islamic law. Commercial buyers, such as supermarkets and hypermarkets, also play a crucial role in the market. They often require suppliers to adhere to specific sustainability and ethical standards, which can influence the production processes and labeling practices of food and beverage manufacturers.
|
Market Scope |
|
|
Report Coverage |
Details |
|
Page number |
138 |
|
Base year |
2023 |
|
Historic period |
2018-2022 |
|
Forecast period |
2024-2028 |
|
Growth momentum & CAGR |
Accelerate at a CAGR of 4.5% |
|
Market growth 2024-2028 |
USD 245.9 billion |
|
Market structure |
Fragmented |
|
YoY growth 2023-2024(%) |
4.23 |
|
Key countries |
US, Japan, China, UK, and Brazil |
|
Competitive landscape |
Leading Companies, Market Positioning of Companies, Competitive Strategies, and Industry Risks |
What are the Key Data Covered in this Ethical Label Market Research and Growth Report?
- CAGR of the Ethical Label industry during the forecast period
- Detailed information on factors that will drive the market growth and forecasting between 2024 and 2028
- Precise estimation of the size of the market and its contribution of the industry in focus to the parent market
- Accurate predictions about upcoming growth and trends and changes in consumer behaviour
- Growth of the market across North America, APAC, Europe, South America, and Middle East and Africa
- Thorough analysis of the market's competitive landscape and detailed information about companies
- Comprehensive analysis of factors that will challenge the ethical label market growth of industry companies
We can help! Our analysts can customize this ethical label market research report to meet your requirements.
 RIA -
RIA - 
