Europe Agricultural Tractor Machinery Market Analysis, Size, and Forecast 2025-2029: Europe (France, Germany, Italy, UK)

Europe Agricultural Tractor Machinery Market Analysis, Size, and Forecast 2025-2029:
Europe (France, Germany, Italy, UK)

Published: Mar 2025 183 Pages SKU: IRTNTR77522

Market Overview at a Glance

$7.42 B
Market Opportunity
5.7%
CAGR
5.0
YoY growth 2024-2025(%)

Europe Agricultural Tractor Machinery Market Size 2025-2029 

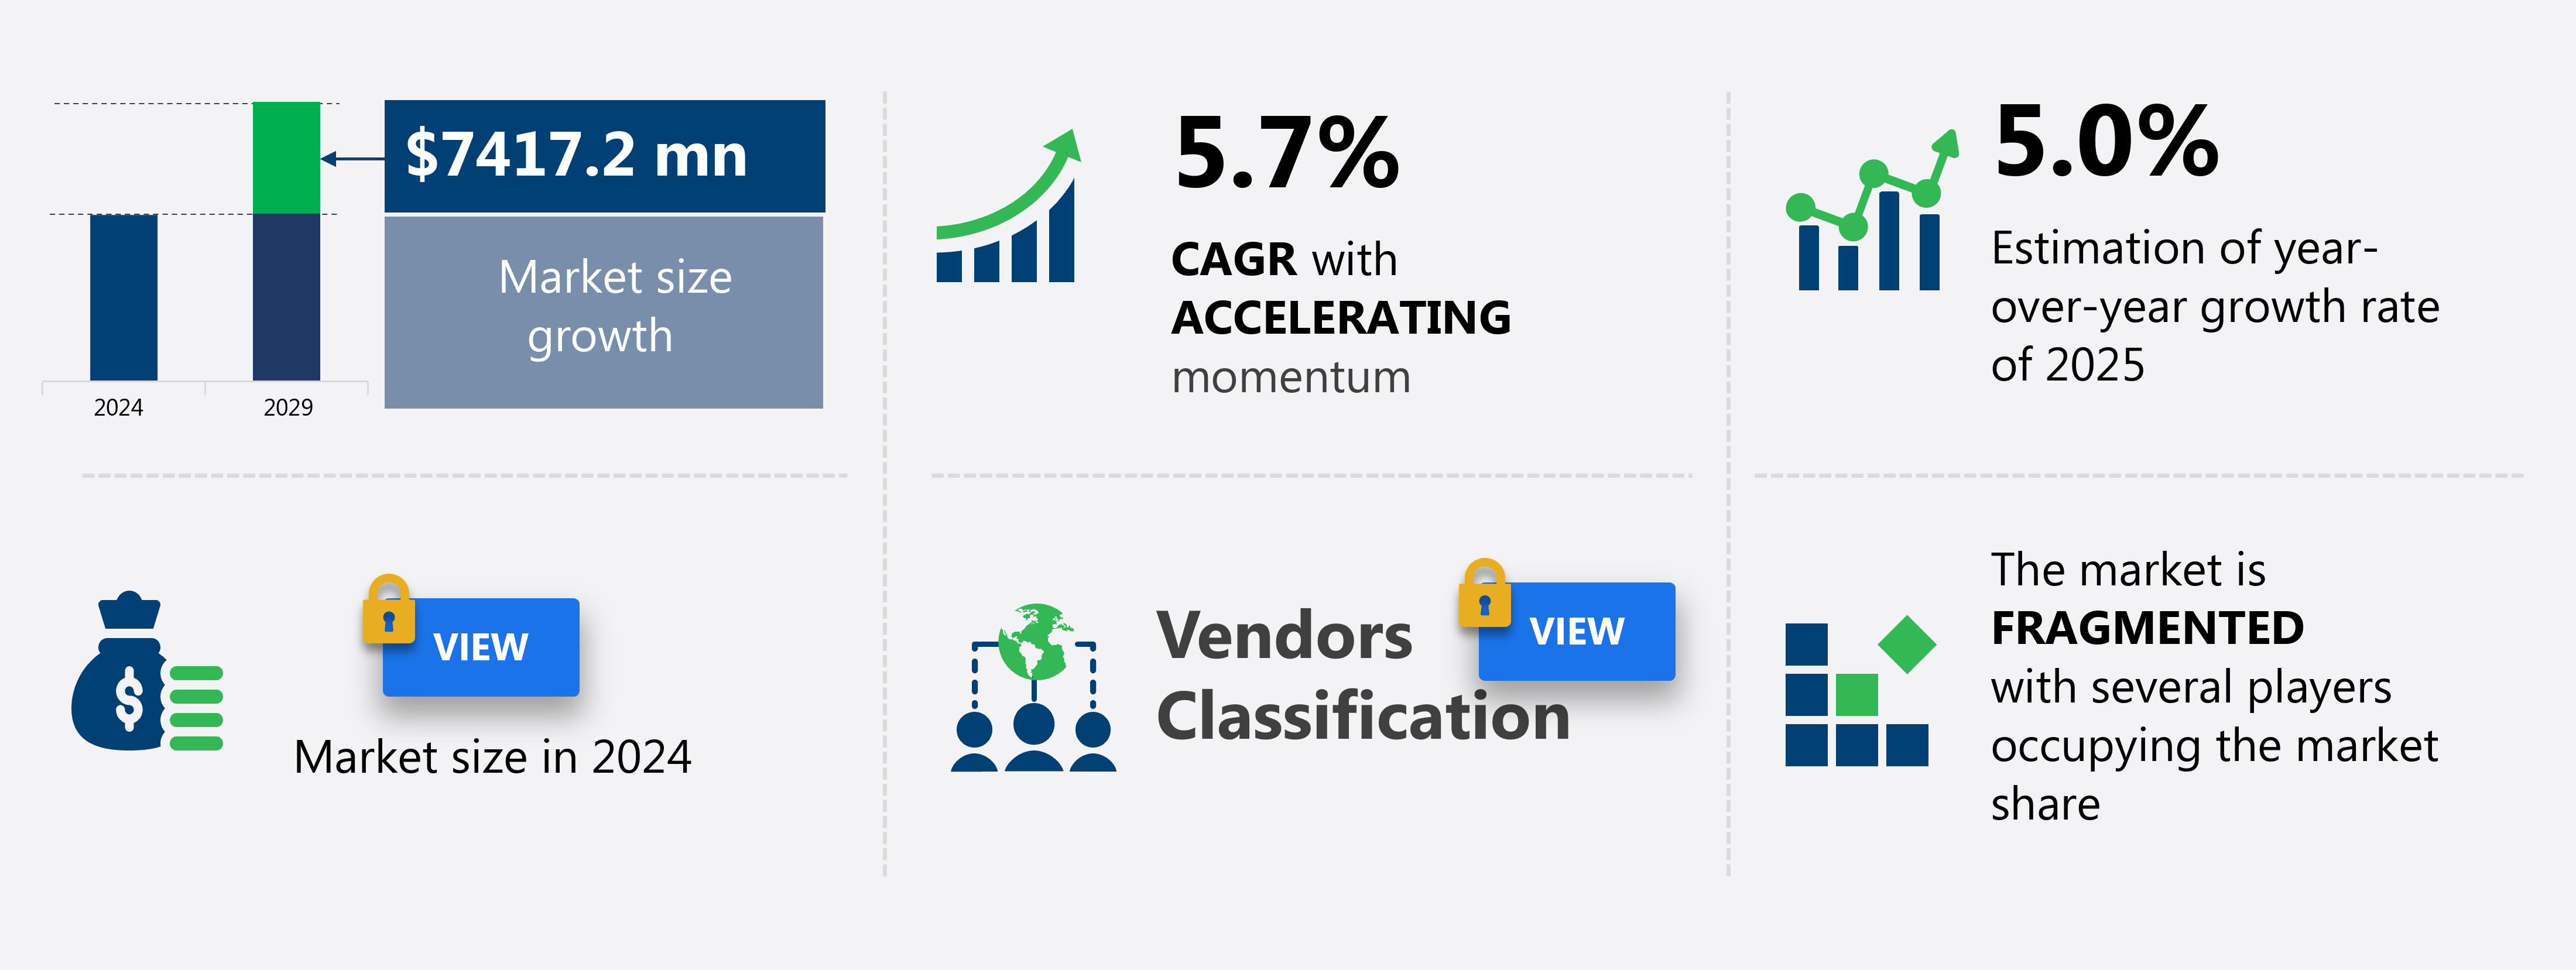
The agricultural tractor machinery market in Europe size is forecast to increase by USD 7.42 billion at a CAGR of 5.7% between 2024 and 2029.

  • The agricultural tractor machinery market is experiencing significant growth due to the increasing demand for food production and the implementation of advanced technologies such as artificial intelligence (AI), semiconductors, big data, and sensors in farm equipment. These technologies enable precision farming practices, including GPS and telematics, which enhance the efficiency and productivity of agricultural machinery. The adoption of digital solutions in tractor engines and precision agriculture techniques is transforming the industry. However, the lack of technically skilled farmers poses a challenge to the widespread implementation of these technologies. The integration of AI and sensor technology in agricultural machinery is revolutionizing the industry, allowing for real-time monitoring of farm conditions and optimizing the use of fertilizers and other resources.

    Education and training programs are essential to equip farmers with the necessary skills to operate and maintain these advanced machines effectively. Overall, the agricultural tractor machinery market is poised for growth as it embraces digitalization and technological innovation to meet the demands of modern farming practices.

What will be the Size of the Market During the Forecast Period?

Agricultural Tractor Machinery Market in Europe Size

 Request Free Sample

  • The agricultural tractor machinery market encompasses a diverse range of equipment essential for modern farming operations. Compact tractors, particularly popular among small farms, represent a significant segment of this market. Notable trends include the integration of telematics for remote monitoring and management, addressing labor shortages through automation and AI applications, and the emergence of electric and driverless tractors. These advancements are driven by the increasing adoption of machine learning algorithms, big data, and computing power in agriculture. However, regulatory scrutiny over environmental impact and safety concerns, as well as supply chain disruptions and inventory level management, pose challenges.

    Additionally, the transition to electric infrastructure and the potential for product substitutes, such as robotic technology, further shape the market's direction. Despite these complexities, the agricultural tractor machinery market continues to evolve, underpinned by the ongoing need for efficient, sustainable, and technologically advanced farming solutions.

How is this market segmented and which is the largest segment?

The market research report provides comprehensive data (region-wise segment analysis), with forecasts and estimates in "USD million" for the period 2025-2029, as well as historical data from 2019-2023 for the following segments.
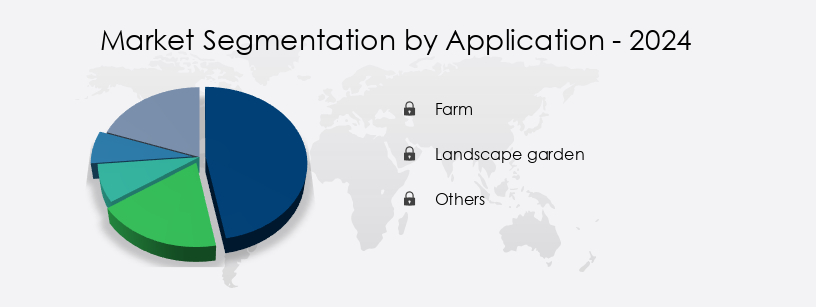
  • Application
    • Farm
    • Landscape garden
    • Others
  • Type
    • Wheel tractor
    • Crawler tractor
  • Fuel Type
    • Diesel
    • Electric/hybrid
    • Petrol/gasoline
    • Alternative fuel
  • Geography
    • Europe
      • France
      • Germany
      • Italy
      • UK

By Application Insights

  • The farm segment is estimated to witness significant growth during the forecast period. The European Agricultural Tractor Machinery Market is driven by the farm segment due to the need for efficient farming solutions. Factors influencing this demand include agricultural practices, farm size, economic conditions, and government policies. Larger farms necessitate powerful and versatile tractors to manage larger areas and heavier workloads, leading to the preference for high-horsepower wheel tractors with advanced features. This trend contributes to the growth of the farm segment in the European Agricultural Tractor Machinery Market. Additionally, technological advancements, such as the integration of telematics, precision farming technologies, and autonomous tractors, are transforming farming operations. Environmental regulations and the adoption of greener technologies, such as electric and ICE tractor engines, are also shaping market dynamics.
  • Farmers, particularly those with smaller operations, are increasingly turning to compact tractors and rental options to optimize resources and reduce operational costs. Despite these opportunities, challenges such as inventory levels and supply chain disruptions persist, requiring effective resource management and weather pattern monitoring. The Agricultural Tractor Machinery Market is expected to witness significant growth due to these trends and the increasing focus on farm productivity and agricultural output.

Agricultural Tractor Machinery Market in Europe Share by Application

Get a glance at the market report of share of various segments Request Free Sample

Market Dynamics

Our Europe Agricultural Tractor Machinery Market researchers analyzed the data with 2024 as the base year, along with the key drivers, trends, and challenges. A holistic analysis of drivers will help companies refine their marketing strategies to gain a competitive advantage.

What are the key market drivers leading to the rise in adoption of Europe Agricultural Tractor Machinery Market?

  • Increasing demand for food production is the key driver of the market. The Market is experiencing growth due to the increasing demand for food production in response to a rising population. Tractor usage is essential for farmers to efficiently cultivate larger land areas and improve agricultural productivity. Farming tasks, from soil preparation to harvesting, are streamlined through the use of tractors. With evolving dietary preferences and consumer demands for diverse, high-quality food products, farmers face pressure to enhance their production capabilities. Compact tractors are particularly popular among small farms, while technological developments such as the integration of telematics, precision farming technologies, and AI applications offer solutions to optimize machine performance and reduce operational costs.
  • Additionally, environmental regulations and the adoption of greener technologies, including electric and driverless tractors, are shaping the market landscape. Farmers, equipped with advanced sensors, data analytics, and GPS navigation, are improving farming efficiency, yield, and tractor design. Operational costs are further reduced through fuel efficiency, automation tools, and rental options. Resource management, including inventory levels, weather patterns, and soil conditions, is enhanced through digital farming and equipment integration. Overall, the Agricultural Tractor Machinery Market is driven by the need for increased farming productivity and efficiency, as well as the integration of advanced technologies.

What are the market trends shaping the Europe Agricultural Tractor Machinery Market?

  • Implementation of AI in agricultural machinery is the upcoming trend in the market. The European Agricultural Tractor Machinery Market is experiencing significant growth due to the integration of AI technology. Precision agriculture, a key application of AI, is transforming traditional farming practices. Advanced tractor machinery equipped with AI capabilities analyzes real-time data on soil conditions, weather patterns, and crop health to optimize tasks. This results in increased productivity, reduced waste, and improved yields. The adoption of AI-integrated tractor machinery aligns with European agricultural sustainability goals and regulatory frameworks, promoting sustainable farming practices. Furthermore, technological developments such as machine learning algorithms, big data, and computing power are driving innovation in the market.
  • The emergence of electric and driverless tractors, as well as autonomous tractor vehicles, is also contributing to the market growth. Inventory levels and supply chain disruptions are being mitigated through digital farming technologies, including GPS navigation and advanced sensors. Despite the initial investment, the long-term benefits of AI technology, including fuel efficiency, automation tools, and yield improvement, outweigh the costs for tech-savvy farmers. Additionally, environmental regulations and the push for greener technologies are increasing demand for electric-powered tractors and other sustainable solutions. After-sales services, rental options, and machine optimization are also key factors driving market growth. Overall, the market is poised for continued growth as farmers embrace the benefits of AI technology and the shift towards mechanized, precision farming.

What challenges does Europe Agricultural Tractor Machinery Market face during the growth?

  • Lack of technically skilled farmers is a key challenge affecting the market growth. The European agricultural tractor machinery market faces challenges due to the insufficient technical skills among farmers. Advanced technologies, such as precision agriculture, GPS navigation, and digital monitoring systems, are increasingly integrated into modern tractor machinery. However, these technologies require a certain level of technical proficiency for optimal usage. The lack of adequate training and education for European farmers may deter them from investing in these sophisticated machines, fearing inefficiency or potential breakdowns. Moreover, the agricultural sector is subject to various market dynamics, including supply chain disruptions, inventory levels, and government policies. Technological developments, such as electric tractors, driverless tractors, and machine learning algorithms, are transforming the industry.
  • Electric infrastructure, product substitutes, and autonomous tractors are gaining popularity due to their environmental benefits and fuel efficiency. Environmental regulations and carbon emissions concerns are driving the adoption of greener technologies. Tractor manufacturers are investing in AI applications, big data, and computing power to optimize tractor performance, energy use, and field operations. Farmers are embracing smart tractors, rental options, and precision farming technologies to improve yield, reduce operational costs, and enhance farming efficiency. Despite these advancements, labor shortages, soil conditions, crop health, and weather patterns continue to impact the agricultural sector. Farmers must manage resources effectively, optimize equipment integration, and employ automation tools to maintain productivity gains.

Exclusive Customer Landscape

The market forecasting report includes the adoption lifecycle of the market, covering from the innovator's stage to the laggard's stage. It focuses on adoption rates in different regions based on penetration. Furthermore, the market report also includes key purchase criteria and drivers of price sensitivity to help companies evaluate and develop their market growth analysis strategies.
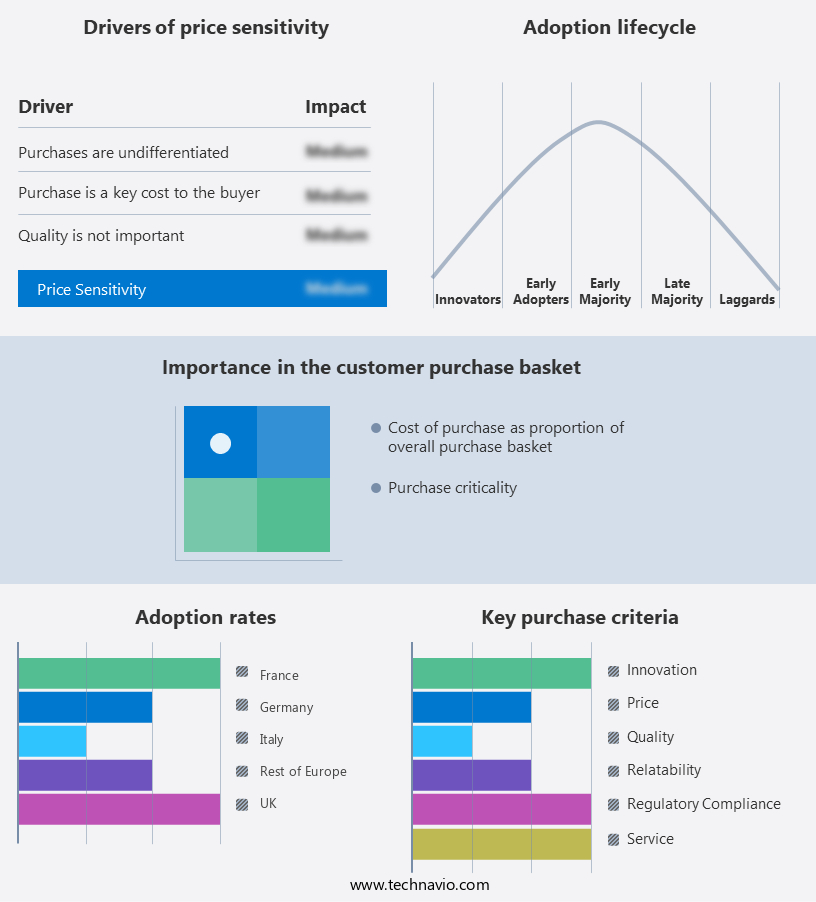
Agricultural Tractor Machinery Market in Europe Share by Geography

 Customer Landscape

Key Companies & Market Insights

Companies are implementing various strategies, such as strategic alliances, market forecast , partnerships, mergers and acquisitions, geographical expansion, and product/service launches, to enhance their presence in the market.

AGCO Corp. -  Agricultural tractor machinery from the company plays a pivotal role in maximizing productivity in extensive farming operations. These advanced machines cater to large-scale agricultural enterprises, delivering superior performance and efficiency.

The market research and growth report includes detailed analyses of the competitive landscape of the market and information about key companies, including:

  • AGCO Corp.
  • Argo Tractors SpA
  • Carraro SpA
  • Caterpillar Inc.
  • CLAAS KGaA mBH
  • CNH Industrial NV
  • Daedong Corp.
  • Deere and Co.
  • ISEKI and Co. Ltd.
  • J C Bamford Excavators Ltd.
  • Kubota Corp.
  • KUHN SAS
  • Mahindra and Mahindra Ltd.
  • Pronar Sp. z o.o
  • SDF SpA
  • Tractors and Farm Equipment Ltd.
  • Wacker Neuson SE
  • Weichei Lovol Heavy Industry Co. Ltd.
  • Yanmar Holdings Co. Ltd.
  • Zetor Tractors as

Qualitative and quantitative analysis of companies has been conducted to help clients understand the wider business environment as well as the strengths and weaknesses of key market players. Data is qualitatively analyzed to categorize companies as pure play, category-focused, industry-focused, and diversified; it is quantitatively analyzed to categorize companies as dominant, leading, strong, tentative, and weak.

Research Analyst Overview

The agricultural tractor market encompasses a broad range of machinery utilized in the farming industry for land cultivation and food production. Compact tractors, with their versatility and maneuverability, have gained significant traction among small farms and tech-savvy farmers. The integration of telematics in tractor machinery has revolutionized farm operations by enabling real-time monitoring of inventory levels, supply chain disruptions, and equipment performance. Government policies and technological developments have significantly influenced the agricultural tractor market. The shift towards greener technologies and carbon emissions reduction has led to the emergence of electric tractors and autonomous tractor vehicles. These advancements aim to improve farming efficiency and reduce operational costs.

Electric infrastructure and semiconductor devices have become essential components in the development of electric-powered tractors. Machine learning algorithms and big data analysis are increasingly being employed to optimize tractor performance and improve yield. Ice tractor engines have also gained popularity due to their ability to operate in extreme weather conditions. Precision farming technologies, such as GPS navigation, advanced sensors, and data analytics, have transformed agriculture by enabling farmers to make informed decisions based on real-time data. These technologies have led to significant improvements in farming efficiency, fuel efficiency, and resource management. The agricultural sector faces various challenges, including labor shortages, soil conditions, crop health, and weather patterns.

Autonomous tractors and robotic technology are being explored as potential solutions to address labor shortages and improve farming productivity. Precision agriculture and digital farming are also gaining traction as farmers seek to optimize their operations and enhance their technical skills. Environmental regulations and the need for sustainable farming practices have led to the adoption of various technologies, including precision agriculture, autonomous tractors, and greener technologies. Rental options have also become increasingly popular as farmers seek to minimize their capital expenditures and focus on operational costs. The agricultural tractor market is dynamic and constantly evolving, with new technologies and innovations emerging regularly.

High-power tractors, driverless tractors, and autonomous tractor vehicles are some of the latest developments in the market. The market is expected to continue growing as farmers seek to improve farming efficiency, reduce operational costs, and adapt to changing market conditions. The agricultural tractor market is a critical component of the farming industry, providing farmers with the tools they need to cultivate land, produce food, and adapt to the challenges of modern agriculture. The integration of telematics, precision farming technologies, and autonomous tractors is transforming the industry, enabling farmers to make informed decisions, optimize their operations, and improve their productivity. The market is expected to continue growing as farmers seek to address labor shortages, improve farming efficiency, and adapt to changing market conditions.

Market Scope

Report Coverage

Details

Page number

183

Base year

2024

Historic period

2019-2023

Forecast period

2025-2029

Growth momentum & CAGR

Accelerate at a CAGR of 5.7%

Market growth 2025-2029

USD 7.42 billion

Market structure

Fragmented

YoY growth 2024-2025(%)

5.0

Key countries

France, Germany, Italy, UK, and Rest of Europe

Competitive landscape

Leading Companies, Market Positioning of Companies, Competitive Strategies, and Industry Risks

Request Free Sample

What are the Key Data Covered in this Market Research and Growth Report?

  • CAGR of the market during the forecast period
  • Detailed information on factors that will drive the market growth and forecasting between 2025 and 2029
  • Precise estimation of the size of the market  and its contribution of the market in focus to the parent market
  • Accurate predictions about upcoming market growth and trends and changes in consumer behaviour
  • Growth of the market across Europe
  • Thorough analysis of the market's competitive landscape and detailed information about companies
  • Comprehensive analysis of factors that will challenge the growth of market companies

We can help! Our analysts can customize this market research report to meet your requirements. Get in touch

1 Executive Summary

  • 1.1 Market overview
    • Executive Summary - Chart on Market Overview
    • Executive Summary - Data Table on Market Overview
    • Executive Summary - Chart on Country Market Characteristics
    • Executive Summary - Chart on Market by Geography
    • Executive Summary - Chart on Market Segmentation by Application
    • Executive Summary - Chart on Market Segmentation by Type
    • Executive Summary - Chart on Market Segmentation by Fuel Type
    • Executive Summary - Chart on Incremental Growth
    • Executive Summary - Data Table on Incremental Growth
    • Executive Summary - Chart on Company Market Positioning

2 Technavio Analysis

  • 2.1 Analysis of price sensitivity, lifecycle, customer purchase basket, adoption rates, and purchase criteria
    • Analysis of price sensitivity, lifecycle, customer purchase basket, adoption rates, and purchase criteria
  • 2.2 Criticality of inputs and Factors of differentiation
    • Overview on criticality of inputs and factors of differentiation
  • 2.3 Factors of disruption
    • Overview on factors of disruption
  • 2.4 Impact of drivers and challenges
    • Impact of drivers and challenges in 2024 and 2029

3 Market Landscape

  • 3.1 Market ecosystem
    • Parent Market
    • Data Table on - Parent Market
  • 3.2 Market characteristics
    • Market characteristics analysis
  • 3.3 Value chain analysis
    • Value chain analysis

4 Market Sizing

  • 4.1 Market definition
    • Offerings of companies included in the market definition
  • 4.2 Market segment analysis
    • Market segments
  • 4.3 Market size 2024
    • 4.4 Market outlook: Forecast for 2024-2029
      • Chart on Europe - Market size and forecast 2024-2029 ($ million)
      • Data Table on Regional - Market size and forecast 2024-2029 ($ million)
      • Chart on Europe: Year-over-year growth 2024-2029 (%)
      • Data Table on Regional - Market size and forecast 2024-2029 ($ million)

    5 Historic Market Size

    • 5.1 Agricultural Tractor Machinery Market in Europe 2019 - 2023
      • Historic Market Size - Data Table on Agricultural Tractor Machinery Market in Europe 2019 - 2023 ($ million)
    • 5.2 Application segment analysis 2019 - 2023
      • Historic Market Size - Application Segment 2019 - 2023 ($ million)
    • 5.3 Type segment analysis 2019 - 2023
      • Historic Market Size - Type Segment 2019 - 2023 ($ million)
    • 5.4 Fuel Type segment analysis 2019 - 2023
      • Historic Market Size - Fuel Type Segment 2019 - 2023 ($ million)
    • 5.5 Geography segment analysis 2019 - 2023
      • Historic Market Size - Geography Segment 2019 - 2023 ($ million)

    6 Qualitative Analysis

    • 6.1 Impact of AI on Agricultural Tractor Machinery Market in Europe

      7 Five Forces Analysis

      • 7.1 Five forces summary
        • Five forces analysis - Comparison between 2024 and 2029
      • 7.2 Bargaining power of buyers
        • Bargaining power of buyers - Impact of key factors 2024 and 2029
      • 7.3 Bargaining power of suppliers
        • Bargaining power of suppliers - Impact of key factors in 2024 and 2029
      • 7.4 Threat of new entrants
        • Threat of new entrants - Impact of key factors in 2024 and 2029
      • 7.5 Threat of substitutes
        • Threat of substitutes - Impact of key factors in 2024 and 2029
      • 7.6 Threat of rivalry
        • Threat of rivalry - Impact of key factors in 2024 and 2029
      • 7.7 Market condition
        • Chart on Market condition - Five forces 2024 and 2029

      8 Market Segmentation by Application

      • 8.1 Market segments
        • Chart on Application - Market share 2024-2029 (%)
        • Data Table on Application - Market share 2024-2029 (%)
      • 8.2 Comparison by Application
        • Chart on Comparison by Application
        • Data Table on Comparison by Application
      • 8.3 Farm - Market size and forecast 2024-2029
        • Chart on Farm - Market size and forecast 2024-2029 ($ million)
        • Data Table on Farm - Market size and forecast 2024-2029 ($ million)
        • Chart on Farm - Year-over-year growth 2024-2029 (%)
        • Data Table on Farm - Year-over-year growth 2024-2029 (%)
      • 8.4 Landscape garden - Market size and forecast 2024-2029
        • Chart on Landscape garden - Market size and forecast 2024-2029 ($ million)
        • Data Table on Landscape garden - Market size and forecast 2024-2029 ($ million)
        • Chart on Landscape garden - Year-over-year growth 2024-2029 (%)
        • Data Table on Landscape garden - Year-over-year growth 2024-2029 (%)
      • 8.5 Others - Market size and forecast 2024-2029
        • Chart on Others - Market size and forecast 2024-2029 ($ million)
        • Data Table on Others - Market size and forecast 2024-2029 ($ million)
        • Chart on Others - Year-over-year growth 2024-2029 (%)
        • Data Table on Others - Year-over-year growth 2024-2029 (%)
      • 8.6 Market opportunity by Application
        • Market opportunity by Application ($ million)
        • Data Table on Market opportunity by Application ($ million)

      9 Market Segmentation by Type

      • 9.1 Market segments
        • Chart on Type - Market share 2024-2029 (%)
        • Data Table on Type - Market share 2024-2029 (%)
      • 9.2 Comparison by Type
        • Chart on Comparison by Type
        • Data Table on Comparison by Type
      • 9.3 Wheel tractor - Market size and forecast 2024-2029
        • Chart on Wheel tractor - Market size and forecast 2024-2029 ($ million)
        • Data Table on Wheel tractor - Market size and forecast 2024-2029 ($ million)
        • Chart on Wheel tractor - Year-over-year growth 2024-2029 (%)
        • Data Table on Wheel tractor - Year-over-year growth 2024-2029 (%)
      • 9.4 Crawler tractor - Market size and forecast 2024-2029
        • Chart on Crawler tractor - Market size and forecast 2024-2029 ($ million)
        • Data Table on Crawler tractor - Market size and forecast 2024-2029 ($ million)
        • Chart on Crawler tractor - Year-over-year growth 2024-2029 (%)
        • Data Table on Crawler tractor - Year-over-year growth 2024-2029 (%)
      • 9.5 Market opportunity by Type
        • Market opportunity by Type ($ million)
        • Data Table on Market opportunity by Type ($ million)

      10 Market Segmentation by Fuel Type

      • 10.1 Market segments
        • Chart on Fuel Type - Market share 2024-2029 (%)
        • Data Table on Fuel Type - Market share 2024-2029 (%)
      • 10.2 Comparison by Fuel Type
        • Chart on Comparison by Fuel Type
        • Data Table on Comparison by Fuel Type
      • 10.3 Diesel - Market size and forecast 2024-2029
        • Chart on Diesel - Market size and forecast 2024-2029 ($ million)
        • Data Table on Diesel - Market size and forecast 2024-2029 ($ million)
        • Chart on Diesel - Year-over-year growth 2024-2029 (%)
        • Data Table on Diesel - Year-over-year growth 2024-2029 (%)
      • 10.4 Electric/hybrid - Market size and forecast 2024-2029
        • Chart on Electric/hybrid - Market size and forecast 2024-2029 ($ million)
        • Data Table on Electric/hybrid - Market size and forecast 2024-2029 ($ million)
        • Chart on Electric/hybrid - Year-over-year growth 2024-2029 (%)
        • Data Table on Electric/hybrid - Year-over-year growth 2024-2029 (%)
      • 10.5 Petrol/gasoline - Market size and forecast 2024-2029
        • Chart on Petrol/gasoline - Market size and forecast 2024-2029 ($ million)
        • Data Table on Petrol/gasoline - Market size and forecast 2024-2029 ($ million)
        • Chart on Petrol/gasoline - Year-over-year growth 2024-2029 (%)
        • Data Table on Petrol/gasoline - Year-over-year growth 2024-2029 (%)
      • 10.6 Alternative fuel - Market size and forecast 2024-2029
        • Chart on Alternative fuel - Market size and forecast 2024-2029 ($ million)
        • Data Table on Alternative fuel - Market size and forecast 2024-2029 ($ million)
        • Chart on Alternative fuel - Year-over-year growth 2024-2029 (%)
        • Data Table on Alternative fuel - Year-over-year growth 2024-2029 (%)
      • 10.7 Market opportunity by Fuel Type
        • Market opportunity by Fuel Type ($ million)
        • Data Table on Market opportunity by Fuel Type ($ million)

      11 Customer Landscape

      • 11.1 Customer landscape overview
        • Analysis of price sensitivity, lifecycle, customer purchase basket, adoption rates, and purchase criteria

      12 Geographic Landscape

      • 12.1 Geographic segmentation
        • Chart on Market share by geography - 2024-2029 (%)
        • Data Table on Market share by geography - 2024-2029 (%)
      • 12.2 Geographic comparison
        • Chart on Geographic comparison
        • Data Table on Geographic comparison
      • 12.3 France - Market size and forecast 2024-2029
        • Chart on France - Market size and forecast 2024-2029 ($ million)
        • Data Table on France - Market size and forecast 2024-2029 ($ million)
        • Chart on France - Year-over-year growth 2024-2029 (%)
        • Data Table on France - Year-over-year growth 2024-2029 (%)
      • 12.4 Germany - Market size and forecast 2024-2029
        • Chart on Germany - Market size and forecast 2024-2029 ($ million)
        • Data Table on Germany - Market size and forecast 2024-2029 ($ million)
        • Chart on Germany - Year-over-year growth 2024-2029 (%)
        • Data Table on Germany - Year-over-year growth 2024-2029 (%)
      • 12.5 Italy - Market size and forecast 2024-2029
        • Chart on Italy - Market size and forecast 2024-2029 ($ million)
        • Data Table on Italy - Market size and forecast 2024-2029 ($ million)
        • Chart on Italy - Year-over-year growth 2024-2029 (%)
        • Data Table on Italy - Year-over-year growth 2024-2029 (%)
      • 12.6 UK - Market size and forecast 2024-2029
        • Chart on UK - Market size and forecast 2024-2029 ($ million)
        • Data Table on UK - Market size and forecast 2024-2029 ($ million)
        • Chart on UK - Year-over-year growth 2024-2029 (%)
        • Data Table on UK - Year-over-year growth 2024-2029 (%)
      • 12.7 Rest of Europe - Market size and forecast 2024-2029
        • Chart on Rest of Europe - Market size and forecast 2024-2029 ($ million)
        • Data Table on Rest of Europe - Market size and forecast 2024-2029 ($ million)
        • Chart on Rest of Europe - Year-over-year growth 2024-2029 (%)
        • Data Table on Rest of Europe - Year-over-year growth 2024-2029 (%)
      • 12.8 Market opportunity by geography
        • Market opportunity by geography ($ million)
        • Data Table on Market opportunity by geography ($ million)

      13 Drivers, Challenges, and Opportunity/Restraints

      • 13.1 Market drivers
        • 13.2 Market challenges
          • 13.3 Impact of drivers and challenges
            • Impact of drivers and challenges in 2024 and 2029
          • 13.4 Market opportunities/restraints

            14 Competitive Landscape

            • 14.1 Overview
              • 14.2 Competitive Landscape
                • Overview on criticality of inputs and factors of differentiation
              • 14.3 Landscape disruption
                • Overview on factors of disruption
              • 14.4 Industry risks
                • Impact of key risks on business

              15 Competitive Analysis

              • 15.1 Companies profiled
                • Companies covered
              • 15.2 Company ranking index
                • Company ranking index
              • 15.3 Market positioning of companies
                • Matrix on companies position and classification
              • 15.4 AGCO Corp.
                • AGCO Corp. - Overview
                • AGCO Corp. - Business segments
                • AGCO Corp. - Key news
                • AGCO Corp. - Key offerings
                • AGCO Corp. - Segment focus
                • SWOT
              • 15.5 Argo Tractors SpA
                • Argo Tractors SpA - Overview
                • Argo Tractors SpA - Product / Service
                • Argo Tractors SpA - Key offerings
                • SWOT
              • 15.6 Caterpillar Inc.
                • Caterpillar Inc. - Overview
                • Caterpillar Inc. - Business segments
                • Caterpillar Inc. - Key news
                • Caterpillar Inc. - Key offerings
                • Caterpillar Inc. - Segment focus
                • SWOT
              • 15.7 CLAAS KGaA mBH
                • CLAAS KGaA mBH - Overview
                • CLAAS KGaA mBH - Product / Service
                • CLAAS KGaA mBH - Key news
                • CLAAS KGaA mBH - Key offerings
                • SWOT
              • 15.8 CNH Industrial NV
                • CNH Industrial NV - Overview
                • CNH Industrial NV - Business segments
                • CNH Industrial NV - Key offerings
                • CNH Industrial NV - Segment focus
                • SWOT
              • 15.9 Daedong Corp.
                • Daedong Corp. - Overview
                • Daedong Corp. - Product / Service
                • Daedong Corp. - Key news
                • Daedong Corp. - Key offerings
                • SWOT
              • 15.10 Deere and Co.
                • Deere and Co. - Overview
                • Deere and Co. - Business segments
                • Deere and Co. - Key news
                • Deere and Co. - Key offerings
                • Deere and Co. - Segment focus
                • SWOT
              • 15.11 J C Bamford Excavators Ltd.
                • J C Bamford Excavators Ltd. - Overview
                • J C Bamford Excavators Ltd. - Product / Service
                • J C Bamford Excavators Ltd. - Key offerings
                • SWOT
              • 15.12 Kubota Corp.
                • Kubota Corp. - Overview
                • Kubota Corp. - Business segments
                • Kubota Corp. - Key offerings
                • Kubota Corp. - Segment focus
                • SWOT
              • 15.13 KUHN SAS
                • KUHN SAS - Overview
                • KUHN SAS - Product / Service
                • KUHN SAS - Key offerings
                • SWOT
              • 15.14 Mahindra and Mahindra Ltd.
                • Mahindra and Mahindra Ltd. - Overview
                • Mahindra and Mahindra Ltd. - Business segments
                • Mahindra and Mahindra Ltd. - Key news
                • Mahindra and Mahindra Ltd. - Key offerings
                • Mahindra and Mahindra Ltd. - Segment focus
                • SWOT
              • 15.15 Pronar Sp. z o.o
                • Pronar Sp. z o.o - Overview
                • Pronar Sp. z o.o - Product / Service
                • Pronar Sp. z o.o - Key offerings
                • SWOT
              • 15.16 SDF SpA
                • SDF SpA - Overview
                • SDF SpA - Product / Service
                • SDF SpA - Key offerings
                • SWOT
              • 15.17 Wacker Neuson SE
                • Wacker Neuson SE - Overview
                • Wacker Neuson SE - Business segments
                • Wacker Neuson SE - Key offerings
                • Wacker Neuson SE - Segment focus
                • SWOT
              • 15.18 Yanmar Holdings Co. Ltd.
                • Yanmar Holdings Co. Ltd. - Overview
                • Yanmar Holdings Co. Ltd. - Product / Service
                • Yanmar Holdings Co. Ltd. - Key offerings
                • SWOT

              16 Appendix

              • 16.1 Scope of the report
                • 16.2 Inclusions and exclusions checklist
                  • Inclusions checklist
                  • Exclusions checklist
                • 16.3 Currency conversion rates for US$
                  • Currency conversion rates for US$
                • 16.4 Research methodology
                  • Research methodology
                • 16.5 Data procurement
                  • Information sources
                • 16.6 Data validation
                  • Data validation
                • 16.7 Validation techniques employed for market sizing
                  • Validation techniques employed for market sizing
                • 16.8 Data synthesis
                  • Data synthesis
                • 16.9 360 degree market analysis
                  • 360 degree market analysis
                • 16.10 List of abbreviations
                  • List of abbreviations

                Research Methodology

                Technavio presents a detailed picture of the market by way of study, synthesis, and summation of data from multiple sources. The analysts have presented the various facets of the market with a particular focus on identifying the key industry influencers. The data thus presented is comprehensive, reliable, and the result of extensive research, both primary and secondary.

                INFORMATION SOURCES

                Primary sources

                • Manufacturers and suppliers
                • Channel partners
                • Industry experts
                • Strategic decision makers

                Secondary sources

                • Industry journals and periodicals
                • Government data
                • Financial reports of key industry players
                • Historical data
                • Press releases

                DATA ANALYSIS

                Data Synthesis

                • Collation of data
                • Estimation of key figures
                • Analysis of derived insights

                Data Validation

                • Triangulation with data models
                • Reference against proprietary databases
                • Corroboration with industry experts

                REPORT WRITING

                Qualitative

                • Market drivers
                • Market challenges
                • Market trends
                • Five forces analysis

                Quantitative

                • Market size and forecast
                • Market segmentation
                • Geographical insights
                • Competitive landscape

                Interested in this report?

                Get your sample now to see our research methodology and insights!

                Download Now

                Frequently Asked Questions

                Agricultural Tractor Machinery market growth will increase by $ 7417.2 mn during 2025-2029 .

                The Agricultural Tractor Machinery market is expected to grow at a CAGR of 5.7% during 2025-2029 .

                Agricultural Tractor Machinery market is segmented by Application( Farm, Landscape garden, Others) Type( Wheel tractor, Crawler tractor) Fuel Type( Diesel, Electric/hybrid, Petrol/gasoline, Alternative fuel)

                AGCO Corp., Argo Tractors SpA, Carraro SpA, Caterpillar Inc., CLAAS KGaA mBH, CNH Industrial NV, Daedong Corp., Deere and Co., ISEKI and Co. Ltd., J C Bamford Excavators Ltd., Kubota Corp., KUHN SAS, Mahindra and Mahindra Ltd., Pronar Sp. z o.o, SDF SpA, Tractors and Farm Equipment Ltd., Wacker Neuson SE, Weichei Lovol Heavy Industry Co. Ltd., Yanmar Holdings Co. Ltd., Zetor Tractors as are a few of the key vendors in the Agricultural Tractor Machinery market.

                Europe will register the highest growth rate of 100% among the other regions. Therefore, the Agricultural Tractor Machinery market in Europe is expected to garner significant business opportunities for the vendors during the forecast period.

                France, Germany, Italy, UK, Rest of Europe

                • Increasing demand for food productionThe increasing demand for food production is a primary driver behind the growth of the agricultural tractor machinery market in Europe. With the rising population in Europe is the driving factor this market.
                • the demand for food is expected to rise significantly during the forecast period. Agricultural tractors serve as indispensable tools in meeting this demand by enabling farmers to efficiently cultivate larger areas of land and boost agricultural productivity. From soil preparation and planting to crop maintenance and harvesting is the driving factor this market.
                • tractors streamline essential farming tasks is the driving factor this market.
                • allowing farmers to scale up their operations to meet the growing food requirements. Furthermore is the driving factor this market.
                • as dietary preferences evolve and consumer demands for diverse and high-quality food products increase is the driving factor this market.
                • farmers are under pressure to enhance their production capabilities. Agricultural tractors equipped with advanced technologies play a crucial role in modernizing farming practices to meet these evolving demands. These technologies include GPS guidance systems is the driving factor this market.
                • automated steering is the driving factor this market.
                • variable rate technology is the driving factor this market.
                • and precision farming tools is the driving factor this market.
                • which optimize resource utilization is the driving factor this market.
                • minimize input wastage is the driving factor this market.
                • and improve overall farm efficiency. By adopting such innovations is the driving factor this market.
                • farmers can increase crop yields while maintaining cost-effectiveness is the driving factor this market.
                • thus contributing to the sustainable growth of the agricultural sector.The expansion of agricultural activities into previously uncultivated or underutilized land areas also drives the demand for agricultural tractors. As urbanization in Europe intensifies is the driving factor this market.
                • there is a need to reclaim marginal lands and employ modern farming techniques to maximize their agricultural potential. Tractors enable farmers to mechanize operations in challenging terrains is the driving factor this market.
                • such as hillsides or remote areas is the driving factor this market.
                • thereby unlocking new opportunities for agricultural production. Additionally is the driving factor this market.
                • the adoption of mechanized farming practices helps mitigate labor shortages is the driving factor this market.
                • particularly in regions experiencing rural-to-urban migration trends is the driving factor this market.
                • ensuring continuity in food production and supply. Therefore is the driving factor this market.
                • the increasing demand for food production in Europe will drive the growth of the agricultural tractor machinery market in Europe during the forecast period. is the driving factor this market.

                The Agricultural Tractor Machinery market vendors should focus on grabbing business opportunities from the Farm segment as it accounted for the largest market share in the base year.