EV Charger Service Market Analysis, Size, and Forecast 2025-2029: APAC (China, Japan, and India), Europe (Germany, UK, and France), North America (US, Canada, and Mexico), South America (Brazil and Argentina), Middle East and Africa (Saudi Arabia, UAE, and South Africa), and Rest of World (ROW)

EV Charger Service Market Analysis, Size, and Forecast 2025-2029:
APAC (China, Japan, and India), Europe (Germany, UK, and France), North America (US, Canada, and Mexico), South America (Brazil and Argentina), Middle East and Africa (Saudi Arabia, UAE, and South Africa), and Rest of World (ROW)

Published: Dec 2025 313 Pages SKU: IRTNTR73091

Market Overview at a Glance

$6.31 B
Market Opportunity
12.9%
CAGR 2024 - 2029
44.3%
APAC Growth
$4.30 B
AC segment 2023

EV Charger Service Market Size 2025-2029

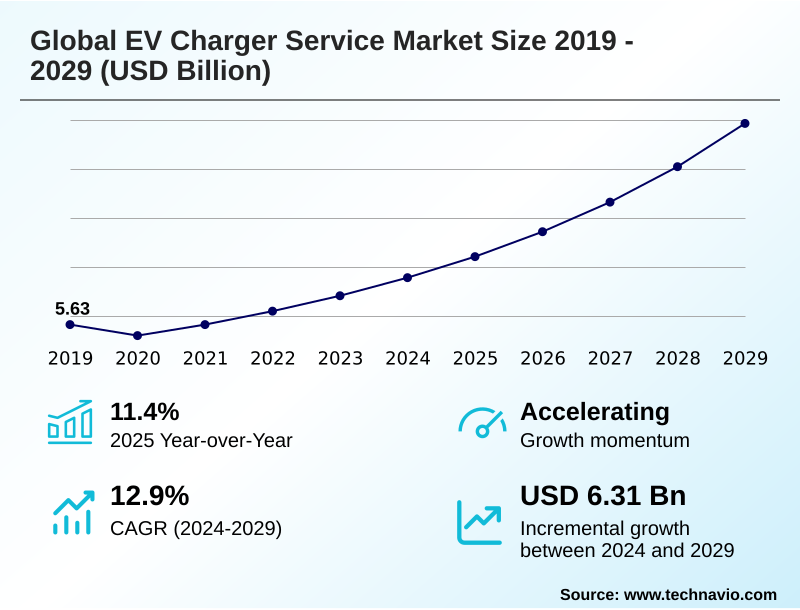
The ev charger service market size is valued to increase by USD 6.31 billion, at a CAGR of 12.9% from 2024 to 2029. Government incentives and subsidies for EV charging infrastructure developments will drive the ev charger service market.

Major Market Trends & Insights

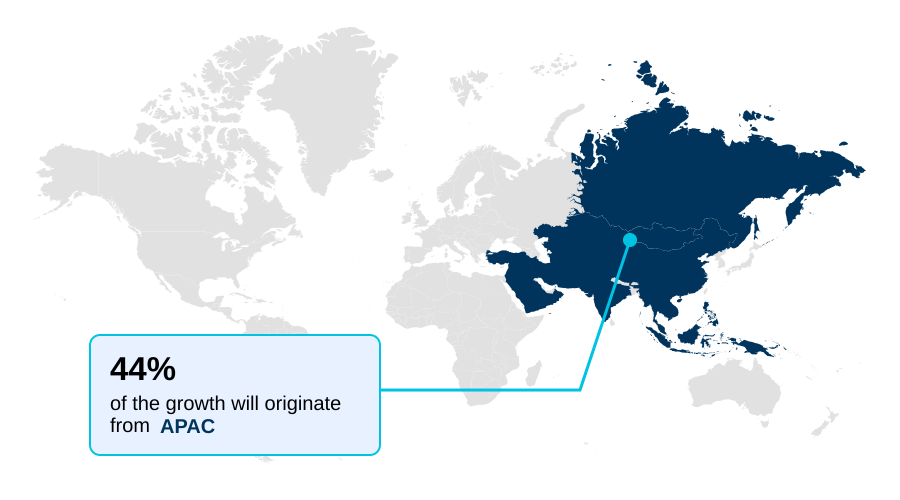
  • APAC dominated the market and accounted for a 44.3% growth during the forecast period.
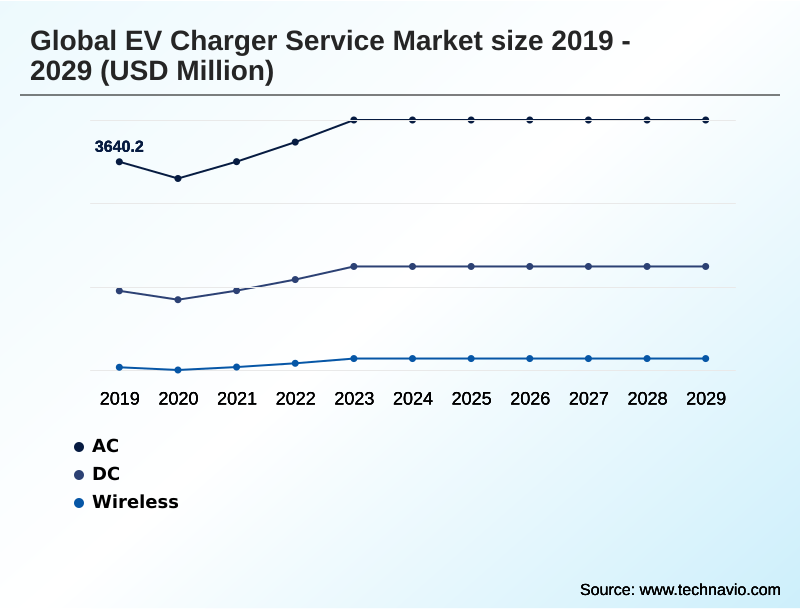
  • By Type - AC segment was valued at USD 4.30 billion in 2023
  • By Power Output - 10-50 kW segment accounted for the largest market revenue share in 2023

Market Size & Forecast

  • Market Opportunities: USD 8.23 billion
  • Market Future Opportunities: USD 6.31 billion
  • CAGR from 2024 to 2029 : 12.9%

Market Summary

  • The EV charger service market is undergoing a significant transformation, driven by stringent emissions regulations and rising consumer demand for sustainable transport. Growth is propelled by advancements in high-power charging and smart charging technologies that optimize grid integration and energy consumption.
  • For instance, commercial fleet operators are increasingly adopting charging-as-a-service models, which bundle hardware, software, and maintenance into a subscription, shifting capital expenditure to operational expenditure. This approach allows them to achieve fleet electrification targets while ensuring high uptime reliability and leveraging energy management systems for cost-effective charging.
  • However, the market faces challenges related to interoperability between different charging standards and the high initial cost of deploying extensive public charging networks. The development of turnkey solutions and roaming agreements is becoming crucial to create a seamless user experience.
  • Furthermore, integrating renewable energy sources and bidirectional charging capabilities represents a key trend, positioning EV charging as a vital component of a smarter, more resilient energy ecosystem. Progress in battery technology and the expansion of charging hubs will be critical for overcoming range anxiety and accelerating mass-market EV adoption.

What will be the Size of the EV Charger Service Market during the forecast period?

Get Key Insights on Market Forecast (PDF) Request Free Sample

How is the EV Charger Service Market Segmented?

The ev charger service industry research report provides comprehensive data (region-wise segment analysis), with forecasts and estimates in "USD million" for the period 2025-2029, as well as historical data from 2019-2023 for the following segments.

  • Type
    • AC
    • DC
    • Wireless
  • Power output
    • 10-50 kW
    • Up to 10 kW
    • 50-150 kW
    • Above 150 kW
  • Installation type
    • Residential chargers
    • Commercial chargers
    • Workplace chargers
    • Public chargers
  • Geography
    • APAC
      • China
      • Japan
      • India
    • Europe
      • Germany
      • UK
      • France
    • North America
      • US
      • Canada
      • Mexico
    • South America
      • Brazil
      • Argentina
    • Middle East and Africa
      • Saudi Arabia
      • UAE
      • South Africa
    • Rest of World (ROW)

By Type Insights

The ac segment is estimated to witness significant growth during the forecast period.

The EV charger service market is segmented by type, power output, and installation. These segments include innovations in ac charging, dc fast charging, and emerging wireless charging.

Power output ranges from low-kilowatt units to high-power charging systems, while installation types cover residential, commercial, and public applications.

A key dynamic is the need for enhanced charging station management to support the diverse requirements of commercial fleet charging and public charging networks.

APAC accounts for over 44% of the market's incremental growth, underscoring the importance of regional deployment strategies.

Effective charging-as-a-service models and strong charging infrastructure investment are essential for supporting rising ev adoption rates and advancing emobility services, shaping the competitive landscape.

Request Free Sample

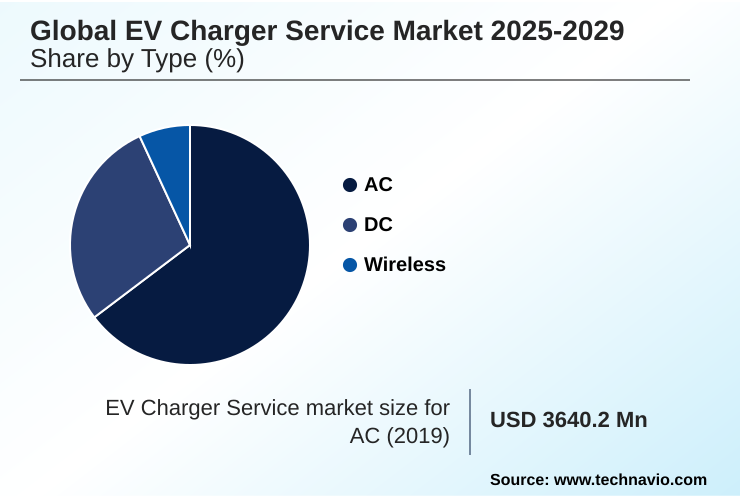
The AC segment was valued at USD 4.30 billion in 2023 and showed a gradual increase during the forecast period.

Request Free Sample

Regional Analysis

APAC is estimated to contribute 44.3% to the growth of the global market during the forecast period.Technavio’s analysts have elaborately explained the regional trends and drivers that shape the market during the forecast period.

See How EV Charger Service Market Demand is Rising in APAC Request Free Sample

The geographic landscape is characterized by distinct regional dynamics and varying levels of market maturity. APAC contributes 44.3% to the market's incremental growth, driven by massive ev charging infrastructure deployment and fleet electrification initiatives.

In North America, government ev incentives and private investment in a public charging network are accelerating the adoption of the north american charging standard and turnkey solutions.

Europe focuses on stringent regulatory compliance, pushing interoperability standards and roaming agreements to create a unified ecosystem. The expansion of charging hubs and deployment of on-street charging address urban density challenges.

Across all regions, successful ev charging technology deployment depends on effective grid integration and the availability of robust predictive maintenance services to ensure high uptime reliability and manage overall charging station economics.

Market Dynamics

Our researchers analyzed the data with 2024 as the base year, along with the key drivers, trends, and challenges. A holistic analysis of drivers will help companies refine their marketing strategies to gain a competitive advantage.

  • The successful deployment of a robust charging ecosystem hinges on addressing specific technical and operational challenges. For commercial fleet charging management, optimizing charging schedules through workplace ev charging load balancing is critical to minimize operational costs and avoid placing undue electrical grid strain.
  • The proliferation of ac level 2 smart charger technology in residential and commercial settings provides a foundation for this, but ensuring public ev charging station uptime requires sophisticated ev charging station maintenance services. The industry is moving toward predictive maintenance for ev chargers to preempt failures.
  • The dc fast charging station cost remains a barrier for widespread deployment, although residential ev charger installation incentives are helping drive home adoption. For long-distance travel, high power charging for long-haul routes is being enabled by the development of megawatt charging for electric trucks.
  • Interoperability remains paramount, with advancements in iso 15118 plug and charge and efforts to standardize ev charging interoperability ccs nacs. Concurrently, ev charging network roaming agreements are essential for a seamless user experience.
  • Innovations like wireless ev charging pad installation and vehicle to grid pilot programs are creating new service opportunities, while solar powered off grid ev charging and ev battery swapping station logistics address infrastructure gaps in remote areas. Ultimately, managing ev charging station profitability while expanding urban on-street charging solutions will determine long-term success.

What are the key market drivers leading to the rise in the adoption of EV Charger Service Industry?

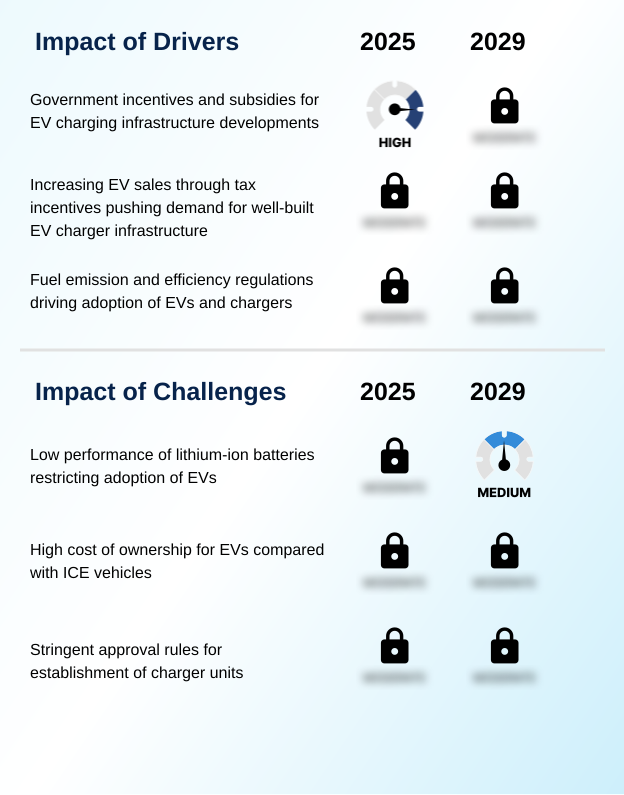
  • Government incentives and subsidies for the development of EV charging infrastructure represent a key driver for market growth.

  • Government policies and technological advancements are primary drivers of market expansion. Supportive regulatory frameworks, including government ev incentives and utility integration programs, are lowering deployment costs.
  • For instance, some tax credit programs cover up to 30% of installation expenses for commercial entities. These financial supports are critical for the build-out of a comprehensive ev charging infrastructure, particularly for highway fast charging.
  • At the same time, improvements in ev battery performance and the standardization of protocols like ocpp 2.0.1 are boosting consumer confidence.
  • The widespread availability of evse hardware compatible with both the combined charging system and north american charging standard is simplifying the user experience and encouraging investment in the sector, furthering market penetration.

What are the market trends shaping the EV Charger Service Industry?

  • A significant market trend is the accelerated installation of DC fast charging stations. This development is crucial for addressing range anxiety and supporting long-distance electric travel.

  • Key trends are reshaping the service landscape, with a strong focus on enhancing charging speed and convenience. The development of v2h technology is advancing, with pilot programs demonstrating that bidirectional charging can reduce household energy bills by up to 15%. This innovation transforms residential charging solutions into active grid assets.
  • Concurrently, the demand for workplace charging stations is surging; one analysis showed that charging sessions grew by 64% in a single year, far outpacing new hardware installations. This highlights a significant opportunity in charging-as-a-service.
  • Progress in battery swapping and the deployment of the megawatt charging system are critical for commercial and fleet depot charging, directly addressing operational downtime and range anxiety solutions for heavy-duty vehicles.

What challenges does the EV Charger Service Industry face during its growth?

  • The restricted adoption of EVs due to the performance limitations of lithium-ion batteries presents a key challenge to industry growth.

  • Despite strong growth drivers, the market faces significant operational and infrastructural challenges. Achieving consistent uptime reliability across vast networks remains a primary concern, with data indicating that over 20% of public charging attempts fail due to equipment malfunctions or payment system errors. This directly impacts consumer trust in the public charging network.
  • The high initial capital required for high-power charging infrastructure, coupled with the long-term uncertainty of charging station economics, also constrains rapid expansion. Furthermore, the electrical grid strain from unmanaged charging events is a growing issue, as peak demand can increase by up to 25% in areas with high EV concentration.
  • Addressing these hurdles requires advanced load balancing, robust energy management systems, and a strategic approach to grid integration.

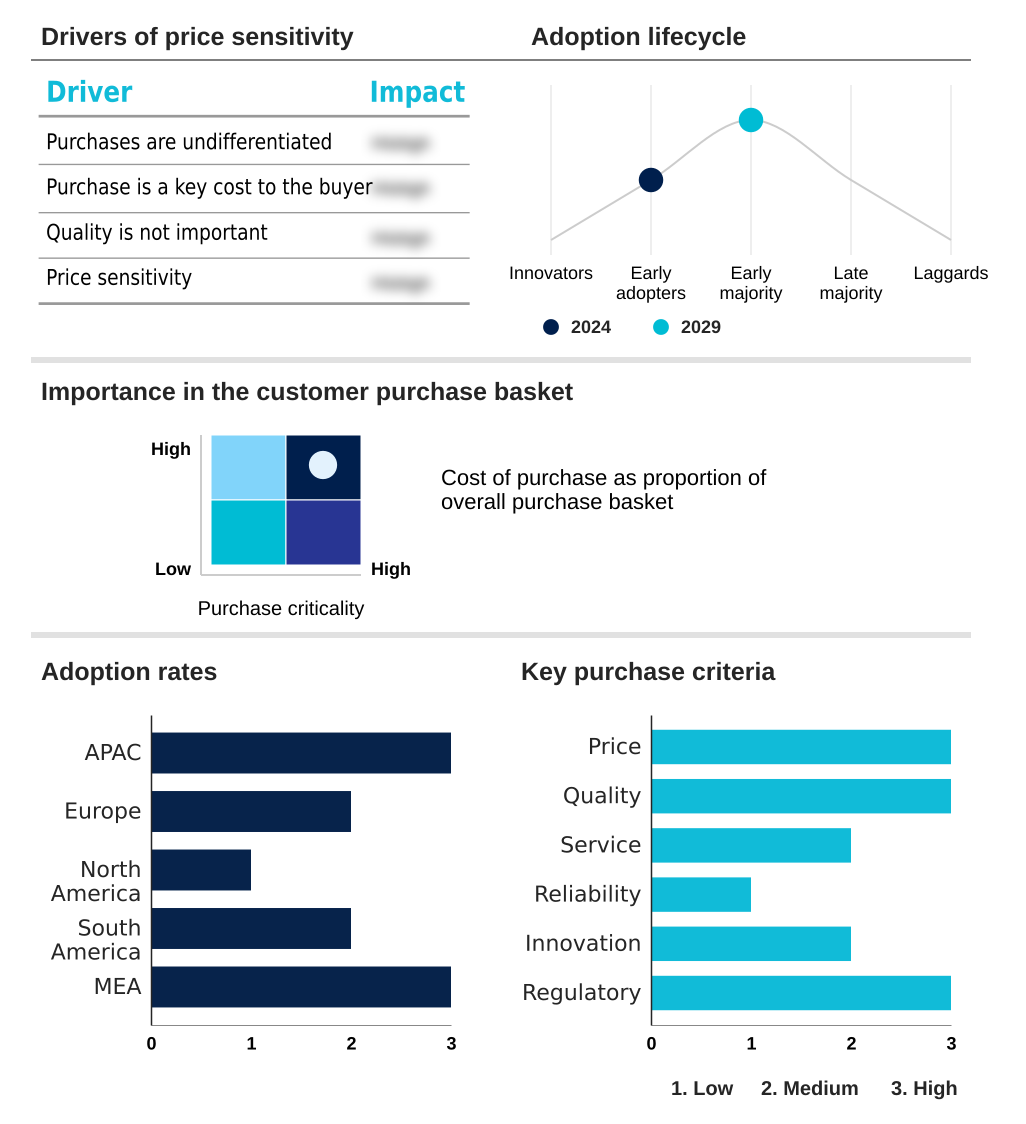
Exclusive Technavio Analysis on Customer Landscape

The ev charger service market forecasting report includes the adoption lifecycle of the market, covering from the innovator’s stage to the laggard’s stage. It focuses on adoption rates in different regions based on penetration. Furthermore, the ev charger service market report also includes key purchase criteria and drivers of price sensitivity to help companies evaluate and develop their market growth analysis strategies.

Customer Landscape of EV Charger Service Industry

Competitive Landscape

Companies are implementing various strategies, such as strategic alliances, ev charger service market forecast, partnerships, mergers and acquisitions, geographical expansion, and product/service launches, to enhance their presence in the industry.

ABB Ltd. - Offerings center on turnkey solutions, providing integrated hardware, advanced energy management systems, and scalable service models to support diverse electric vehicle charging applications.

The industry research and growth report includes detailed analyses of the competitive landscape of the market and information about key companies, including:

  • ABB Ltd.
  • Bayerische Motoren Werke AG
  • BP Plc
  • BYD Co. Ltd.
  • ChargePoint Holdings Inc.
  • Diebold Nixdorf Incorp.
  • Eaton Corp. Plc
  • Efacec Power Solutions SGPS SA
  • ENGIE SA
  • Enphase Energy Inc.
  • Gridserve Sustainable Energy Ltd.
  • Schaffner Group
  • Schneider Electric SE
  • Shell plc
  • Siemens AG
  • SparkCharge Inc.
  • SWTCH Energy Inc.
  • Tesla Inc.
  • TotalEnergies SE

Qualitative and quantitative analysis of companies has been conducted to help clients understand the wider business environment as well as the strengths and weaknesses of key industry players. Data is qualitatively analyzed to categorize companies as pure play, category-focused, industry-focused, and diversified; it is quantitatively analyzed to categorize companies as dominant, leading, strong, tentative, and weak.

Recent Development and News in Ev charger service market

  • In September 2024, Allego announced the full network rollout of its Plug and Charge technology, based on the OCPP 2.0.1 protocol, which commenced in the fourth quarter of 2024 across its pan-European network.
  • In September 2025, the collaboration between Pilot Company, General Motors, and EVgo announced its fast-charging network had expanded to over 200 locations across nearly 40 states, focusing on bridging charging gaps along key travel routes.
  • In February 2025, Shell announced its plan to double its charging points at service stations beginning in 2025, aimed at creating fast-charging corridors connecting Argentina with Chile, Uruguay, and Brazil.
  • In May 2025, Volkswagen began the rollout of its own branded ultra-fast charging stations in Europe, as part of a broader strategy to build out a comprehensive and reliable charging infrastructure.

Dive into Technavio’s robust research methodology, blending expert interviews, extensive data synthesis, and validated models for unparalleled EV Charger Service Market insights. See full methodology.

Market Scope
Page number 313
Base year 2024
Historic period 2019-2023
Forecast period 2025-2029
Growth momentum & CAGR Accelerate at a CAGR of 12.9%
Market growth 2025-2029 USD 6305.5 million
Market structure Fragmented
YoY growth 2024-2025(%) 11.4%
Key countries China, Japan, India, South Korea, Australia, Indonesia, Germany, UK, France, Italy, Spain, The Netherlands, US, Canada, Mexico, Brazil, Argentina, Chile, Saudi Arabia, UAE, South Africa, Egypt and Nigeria
Competitive landscape Leading Companies, Market Positioning of Companies, Competitive Strategies, and Industry Risks

Request Free Sample

Research Analyst Overview

  • The ev charger service market is defined by a rapid technological evolution centered on enhancing efficiency and user convenience. The shift toward high-power charging is evident, with the megawatt charging system and liquid-cooled chargers enabling faster turnaround for commercial vehicles, a critical factor in fleet electrification strategies.
  • Concurrently, advancements in smart charging, load balancing, and demand-response programs are crucial for mitigating electrical grid strain. The adoption of open standards like ocpp 2.0.1 and the mandated iso 15118 for plug and charge functionality are streamlining the charging session and fostering interoperability across networks through roaming agreements.
  • For service providers, ensuring uptime reliability through predictive maintenance and offering flexible charging-as-a-service models are key differentiators. The development of power modules and battery energy storage system integration at charging hubs facilitates off-grid charging and supports grid integration.
  • In residential and commercial spaces, bidirectional charging and v2h technology are transforming EVs into distributed energy assets, supported by turnkey solutions and sophisticated energy management systems. The market is also seeing niche growth in on-street charging and battery swapping, while the convergence of combined charging system and north american charging standard protocols simplifies the ecosystem.
  • A critical boardroom focus is the transition to service-based revenue models, where data from evse hardware is leveraged to optimize power output and operational efficiency, reducing costs by over 15% for network operators.

What are the Key Data Covered in this EV Charger Service Market Research and Growth Report?

  • What is the expected growth of the EV Charger Service Market between 2025 and 2029?

    • USD 6.31 billion, at a CAGR of 12.9%

  • What segmentation does the market report cover?

    • The report is segmented by Type (AC, DC, Wireless), Power Output (10-50 kW, Up to 10 kW, 50-150 kW, Above 150 kW), Installation Type (Residential chargers, Commercial chargers, Workplace chargers, Public chargers) and Geography (APAC, Europe, North America, South America, Middle East and Africa)

  • Which regions are analyzed in the report?

    • APAC, Europe, North America, South America and Middle East and Africa

  • What are the key growth drivers and market challenges?

    • Government incentives and subsidies for EV charging infrastructure developments, Low performance of lithium-ion batteries restricting adoption of EVs

  • Who are the major players in the EV Charger Service Market?

    • ABB Ltd., Bayerische Motoren Werke AG, BP Plc, BYD Co. Ltd., ChargePoint Holdings Inc., Diebold Nixdorf Incorp., Eaton Corp. Plc, Efacec Power Solutions SGPS SA, ENGIE SA, Enphase Energy Inc., Gridserve Sustainable Energy Ltd., Schaffner Group, Schneider Electric SE, Shell plc, Siemens AG, SparkCharge Inc., SWTCH Energy Inc., Tesla Inc. and TotalEnergies SE

Market Research Insights

  • The market's momentum is defined by strategic charging network expansion and a focus on interoperability standards to enhance user experience. The demand for workplace charging stations is surging, with session volume growing 64% year-over-year, significantly outpacing new port installations at just 22%. This gap highlights a major opportunity in emobility services and commercial fleet charging.
  • Concurrently, utility integration programs are becoming more sophisticated, supporting renewable energy integration and mitigating the grid impact of EV charging. These initiatives are critical as public charging network utilization rates have increased by over 25%, driven by rising EV adoption rates.
  • Fleet depot charging and destination charging are evolving with smart technology to manage charging station economics, while government EV incentives continue to spur charging infrastructure investment and broader market development.

We can help! Our analysts can customize this ev charger service market research report to meet your requirements.

Get in touch

1. Executive Summary

1.1 Market overview

Executive Summary - Chart on Market Overview
Executive Summary - Data Table on Market Overview
Executive Summary - Chart on Global Market Characteristics
Executive Summary - Chart on Market by Geography
Executive Summary - Chart on Market Segmentation by Type
Executive Summary - Chart on Market Segmentation by Power Output
Executive Summary - Chart on Market Segmentation by Installation Type
Executive Summary - Chart on Incremental Growth
Executive Summary - Data Table on Incremental Growth
Executive Summary - Chart on Company Market Positioning

2. Technavio Analysis

2.1 Analysis of price sensitivity, lifecycle, customer purchase basket, adoption rates, and purchase criteria

2.2 Criticality of inputs and Factors of differentiation

Chart on Overview on criticality of inputs and factors of differentiation

2.3 Factors of disruption

Chart on Overview on factors of disruption

2.4 Impact of drivers and challenges

Chart on Impact of drivers and challenges in 2024 and 2029

3. Market Landscape

3.1 Market ecosystem

Chart on Parent Market
Data Table on - Parent Market

3.2 Market characteristics

Chart on Market characteristics analysis

3.3 Value chain analysis

Chart on Value chain analysis

4. Market Sizing

4.1 Market definition

Data Table on Offerings of companies included in the market definition

4.2 Market segment analysis

Market segments

4.3 Market size 2024

4.4 Market outlook: Forecast for 2024-2029

Chart on Global - Market size and forecast 2024-2029 ($ million)
Data Table on Global - Market size and forecast 2024-2029 ($ million)
Chart on Global Market: Year-over-year growth 2024-2029 (%)
Data Table on Global Market: Year-over-year growth 2024-2029 (%)

5. Historic Market Size

5.1 Global EV Charger Service Market 2019 - 2023

Historic Market Size - Data Table on Global EV Charger Service Market 2019 - 2023 ($ million)

5.2 Type segment analysis 2019 - 2023

Historic Market Size - Type Segment 2019 - 2023 ($ million)

5.3 Power Output segment analysis 2019 - 2023

Historic Market Size - Power Output Segment 2019 - 2023 ($ million)

5.4 Installation Type segment analysis 2019 - 2023

Historic Market Size - Installation Type Segment 2019 - 2023 ($ million)

5.5 Geography segment analysis 2019 - 2023

Historic Market Size - Geography Segment 2019 - 2023 ($ million)

5.6 Country segment analysis 2019 - 2023

Historic Market Size - Country Segment 2019 - 2023 ($ million)

6. Qualitative Analysis

6.1 Impact of AI on the Global EV Charger Service Market

7. Five Forces Analysis

7.1 Five forces summary

Five forces analysis - Comparison between 2024 and 2029

7.2 Bargaining power of buyers

Bargaining power of buyers - Impact of key factors 2024 and 2029

7.3 Bargaining power of suppliers

Bargaining power of suppliers - Impact of key factors in 2024 and 2029

7.4 Threat of new entrants

Threat of new entrants - Impact of key factors in 2024 and 2029

7.5 Threat of substitutes

Threat of substitutes - Impact of key factors in 2024 and 2029

7.6 Threat of rivalry

Threat of rivalry - Impact of key factors in 2024 and 2029

7.7 Market condition

Chart on Market condition - Five forces 2024 and 2029

8. Market Segmentation by Type

8.1 Market segments

Chart on Type - Market share 2024-2029 (%)
Data Table on Type - Market share 2024-2029 (%)

8.2 Comparison by Type

Chart on Comparison by Type
Data Table on Comparison by Type

8.3 AC - Market size and forecast 2024-2029

Chart on AC - Market size and forecast 2024-2029 ($ million)
Data Table on AC - Market size and forecast 2024-2029 ($ million)
Chart on AC - Year-over-year growth 2024-2029 (%)
Data Table on AC - Year-over-year growth 2024-2029 (%)

8.4 DC - Market size and forecast 2024-2029

Chart on DC - Market size and forecast 2024-2029 ($ million)
Data Table on DC - Market size and forecast 2024-2029 ($ million)
Chart on DC - Year-over-year growth 2024-2029 (%)
Data Table on DC - Year-over-year growth 2024-2029 (%)

8.5 Wireless - Market size and forecast 2024-2029

Chart on Wireless - Market size and forecast 2024-2029 ($ million)
Data Table on Wireless - Market size and forecast 2024-2029 ($ million)
Chart on Wireless - Year-over-year growth 2024-2029 (%)
Data Table on Wireless - Year-over-year growth 2024-2029 (%)

8.6 Market opportunity by Type

Market opportunity by Type ($ million)
Data Table on Market opportunity by Type ($ million)

9. Market Segmentation by Power Output

9.1 Market segments

Chart on Power Output - Market share 2024-2029 (%)
Data Table on Power Output - Market share 2024-2029 (%)

9.2 Comparison by Power Output

Chart on Comparison by Power Output
Data Table on Comparison by Power Output

9.3 10-50 kW - Market size and forecast 2024-2029

Chart on 10-50 kW - Market size and forecast 2024-2029 ($ million)
Data Table on 10-50 kW - Market size and forecast 2024-2029 ($ million)
Chart on 10-50 kW - Year-over-year growth 2024-2029 (%)
Data Table on 10-50 kW - Year-over-year growth 2024-2029 (%)

9.4 Up to 10 kW - Market size and forecast 2024-2029

Chart on Up to 10 kW - Market size and forecast 2024-2029 ($ million)
Data Table on Up to 10 kW - Market size and forecast 2024-2029 ($ million)
Chart on Up to 10 kW - Year-over-year growth 2024-2029 (%)
Data Table on Up to 10 kW - Year-over-year growth 2024-2029 (%)

9.5 50-150 kW - Market size and forecast 2024-2029

Chart on 50-150 kW - Market size and forecast 2024-2029 ($ million)
Data Table on 50-150 kW - Market size and forecast 2024-2029 ($ million)
Chart on 50-150 kW - Year-over-year growth 2024-2029 (%)
Data Table on 50-150 kW - Year-over-year growth 2024-2029 (%)

9.6 Above 150 kW - Market size and forecast 2024-2029

Chart on Above 150 kW - Market size and forecast 2024-2029 ($ million)
Data Table on Above 150 kW - Market size and forecast 2024-2029 ($ million)
Chart on Above 150 kW - Year-over-year growth 2024-2029 (%)
Data Table on Above 150 kW - Year-over-year growth 2024-2029 (%)

9.7 Market opportunity by Power Output

Market opportunity by Power Output ($ million)
Data Table on Market opportunity by Power Output ($ million)

10. Market Segmentation by Installation Type

10.1 Market segments

Chart on Market Segmentation by Installation Type - Market share 2024-2029 (%)
Data Table on Market Segmentation by Installation Type - Market share 2024-2029 (%)

10.2 Comparison by Market Segmentation by Installation Type

Chart on Comparison by Market Segmentation by Installation Type
Data Table on Comparison by Market Segmentation by Installation Type

10.3 Residential chargers - Market size and forecast 2024-2029

Chart on Residential chargers - Market size and forecast 2024-2029 ($ million)
Data Table on Residential chargers - Market size and forecast 2024-2029 ($ million)
Chart on Residential chargers - Year-over-year growth 2024-2029 (%)
Data Table on Residential chargers - Year-over-year growth 2024-2029 (%)

10.4 Commercial chargers - Market size and forecast 2024-2029

Chart on Commercial chargers - Market size and forecast 2024-2029 ($ million)
Data Table on Commercial chargers - Market size and forecast 2024-2029 ($ million)
Chart on Commercial chargers - Year-over-year growth 2024-2029 (%)
Data Table on Commercial chargers - Year-over-year growth 2024-2029 (%)

10.5 Workplace chargers - Market size and forecast 2024-2029

Chart on Workplace chargers - Market size and forecast 2024-2029 ($ million)
Data Table on Workplace chargers - Market size and forecast 2024-2029 ($ million)
Chart on Workplace chargers - Year-over-year growth 2024-2029 (%)
Data Table on Workplace chargers - Year-over-year growth 2024-2029 (%)

10.6 Public chargers - Market size and forecast 2024-2029

Chart on Public chargers - Market size and forecast 2024-2029 ($ million)
Data Table on Public chargers - Market size and forecast 2024-2029 ($ million)
Chart on Public chargers - Year-over-year growth 2024-2029 (%)
Data Table on Public chargers - Year-over-year growth 2024-2029 (%)

10.7 Market opportunity by Market Segmentation by Installation Type

Market opportunity by Market Segmentation by Installation Type ($ million)
Data Table on Market opportunity by Market Segmentation by Installation Type ($ million)

11. Customer Landscape

11.1 Customer landscape overview

Analysis of price sensitivity, lifecycle, customer purchase basket, adoption rates, and purchase criteria

12. Geographic Landscape

12.1 Geographic segmentation

Chart on Market share by geography 2024-2029 (%)
Data Table on Market share by geography 2024-2029 (%)

12.2 Geographic comparison

Chart on Geographic comparison
Data Table on Geographic comparison

12.3 APAC - Market size and forecast 2024-2029

Chart on APAC - Market size and forecast 2024-2029 ($ million)
Data Table on APAC - Market size and forecast 2024-2029 ($ million)
Chart on APAC - Year-over-year growth 2024-2029 (%)
Data Table on APAC - Year-over-year growth 2024-2029 (%)
Chart on Regional Comparison - APAC
Data Table on Regional Comparison - APAC

12.3.1 China - Market size and forecast 2024-2029

Chart on China - Market size and forecast 2024-2029 ($ million)
Data Table on China - Market size and forecast 2024-2029 ($ million)
Chart on China - Year-over-year growth 2024-2029 (%)
Data Table on China - Year-over-year growth 2024-2029 (%)

12.3.2 Japan - Market size and forecast 2024-2029

Chart on Japan - Market size and forecast 2024-2029 ($ million)
Data Table on Japan - Market size and forecast 2024-2029 ($ million)
Chart on Japan - Year-over-year growth 2024-2029 (%)
Data Table on Japan - Year-over-year growth 2024-2029 (%)

12.3.3 India - Market size and forecast 2024-2029

Chart on India - Market size and forecast 2024-2029 ($ million)
Data Table on India - Market size and forecast 2024-2029 ($ million)
Chart on India - Year-over-year growth 2024-2029 (%)
Data Table on India - Year-over-year growth 2024-2029 (%)

12.3.4 South Korea - Market size and forecast 2024-2029

Chart on South Korea - Market size and forecast 2024-2029 ($ million)
Data Table on South Korea - Market size and forecast 2024-2029 ($ million)
Chart on South Korea - Year-over-year growth 2024-2029 (%)
Data Table on South Korea - Year-over-year growth 2024-2029 (%)

12.3.5 Australia - Market size and forecast 2024-2029

Chart on Australia - Market size and forecast 2024-2029 ($ million)
Data Table on Australia - Market size and forecast 2024-2029 ($ million)
Chart on Australia - Year-over-year growth 2024-2029 (%)
Data Table on Australia - Year-over-year growth 2024-2029 (%)

12.3.6 Indonesia - Market size and forecast 2024-2029

Chart on Indonesia - Market size and forecast 2024-2029 ($ million)
Data Table on Indonesia - Market size and forecast 2024-2029 ($ million)
Chart on Indonesia - Year-over-year growth 2024-2029 (%)
Data Table on Indonesia - Year-over-year growth 2024-2029 (%)

12.4 Europe - Market size and forecast 2024-2029

Chart on Europe - Market size and forecast 2024-2029 ($ million)
Data Table on Europe - Market size and forecast 2024-2029 ($ million)
Chart on Europe - Year-over-year growth 2024-2029 (%)
Data Table on Europe - Year-over-year growth 2024-2029 (%)
Chart on Regional Comparison - Europe
Data Table on Regional Comparison - Europe

12.4.1 Germany - Market size and forecast 2024-2029

Chart on Germany - Market size and forecast 2024-2029 ($ million)
Data Table on Germany - Market size and forecast 2024-2029 ($ million)
Chart on Germany - Year-over-year growth 2024-2029 (%)
Data Table on Germany - Year-over-year growth 2024-2029 (%)

12.4.2 UK - Market size and forecast 2024-2029

Chart on UK - Market size and forecast 2024-2029 ($ million)
Data Table on UK - Market size and forecast 2024-2029 ($ million)
Chart on UK - Year-over-year growth 2024-2029 (%)
Data Table on UK - Year-over-year growth 2024-2029 (%)

12.4.3 France - Market size and forecast 2024-2029

Chart on France - Market size and forecast 2024-2029 ($ million)
Data Table on France - Market size and forecast 2024-2029 ($ million)
Chart on France - Year-over-year growth 2024-2029 (%)
Data Table on France - Year-over-year growth 2024-2029 (%)

12.4.4 Italy - Market size and forecast 2024-2029

Chart on Italy - Market size and forecast 2024-2029 ($ million)
Data Table on Italy - Market size and forecast 2024-2029 ($ million)
Chart on Italy - Year-over-year growth 2024-2029 (%)
Data Table on Italy - Year-over-year growth 2024-2029 (%)

12.4.5 Spain - Market size and forecast 2024-2029

Chart on Spain - Market size and forecast 2024-2029 ($ million)
Data Table on Spain - Market size and forecast 2024-2029 ($ million)
Chart on Spain - Year-over-year growth 2024-2029 (%)
Data Table on Spain - Year-over-year growth 2024-2029 (%)

12.4.6 The Netherlands - Market size and forecast 2024-2029

Chart on The Netherlands - Market size and forecast 2024-2029 ($ million)
Data Table on The Netherlands - Market size and forecast 2024-2029 ($ million)
Chart on The Netherlands - Year-over-year growth 2024-2029 (%)
Data Table on The Netherlands - Year-over-year growth 2024-2029 (%)

12.5 North America - Market size and forecast 2024-2029

Chart on North America - Market size and forecast 2024-2029 ($ million)
Data Table on North America - Market size and forecast 2024-2029 ($ million)
Chart on North America - Year-over-year growth 2024-2029 (%)
Data Table on North America - Year-over-year growth 2024-2029 (%)
Chart on Regional Comparison - North America
Data Table on Regional Comparison - North America

12.5.1 US - Market size and forecast 2024-2029

Chart on US - Market size and forecast 2024-2029 ($ million)
Data Table on US - Market size and forecast 2024-2029 ($ million)
Chart on US - Year-over-year growth 2024-2029 (%)
Data Table on US - Year-over-year growth 2024-2029 (%)

12.5.2 Canada - Market size and forecast 2024-2029

Chart on Canada - Market size and forecast 2024-2029 ($ million)
Data Table on Canada - Market size and forecast 2024-2029 ($ million)
Chart on Canada - Year-over-year growth 2024-2029 (%)
Data Table on Canada - Year-over-year growth 2024-2029 (%)

12.5.3 Mexico - Market size and forecast 2024-2029

Chart on Mexico - Market size and forecast 2024-2029 ($ million)
Data Table on Mexico - Market size and forecast 2024-2029 ($ million)
Chart on Mexico - Year-over-year growth 2024-2029 (%)
Data Table on Mexico - Year-over-year growth 2024-2029 (%)

12.6 South America - Market size and forecast 2024-2029

Chart on South America - Market size and forecast 2024-2029 ($ million)
Data Table on South America - Market size and forecast 2024-2029 ($ million)
Chart on South America - Year-over-year growth 2024-2029 (%)
Data Table on South America - Year-over-year growth 2024-2029 (%)
Chart on Regional Comparison - South America
Data Table on Regional Comparison - South America

12.6.1 Brazil - Market size and forecast 2024-2029

Chart on Brazil - Market size and forecast 2024-2029 ($ million)
Data Table on Brazil - Market size and forecast 2024-2029 ($ million)
Chart on Brazil - Year-over-year growth 2024-2029 (%)
Data Table on Brazil - Year-over-year growth 2024-2029 (%)

12.6.2 Argentina - Market size and forecast 2024-2029

Chart on Argentina - Market size and forecast 2024-2029 ($ million)
Data Table on Argentina - Market size and forecast 2024-2029 ($ million)
Chart on Argentina - Year-over-year growth 2024-2029 (%)
Data Table on Argentina - Year-over-year growth 2024-2029 (%)

12.6.3 Chile - Market size and forecast 2024-2029

Chart on Chile - Market size and forecast 2024-2029 ($ million)
Data Table on Chile - Market size and forecast 2024-2029 ($ million)
Chart on Chile - Year-over-year growth 2024-2029 (%)
Data Table on Chile - Year-over-year growth 2024-2029 (%)

12.7 Middle East and Africa - Market size and forecast 2024-2029

Chart on Middle East and Africa - Market size and forecast 2024-2029 ($ million)
Data Table on Middle East and Africa - Market size and forecast 2024-2029 ($ million)
Chart on Middle East and Africa - Year-over-year growth 2024-2029 (%)
Data Table on Middle East and Africa - Year-over-year growth 2024-2029 (%)
Chart on Regional Comparison - Middle East and Africa
Data Table on Regional Comparison - Middle East and Africa

12.7.1 Saudi Arabia - Market size and forecast 2024-2029

Chart on Saudi Arabia - Market size and forecast 2024-2029 ($ million)
Data Table on Saudi Arabia - Market size and forecast 2024-2029 ($ million)
Chart on Saudi Arabia - Year-over-year growth 2024-2029 (%)
Data Table on Saudi Arabia - Year-over-year growth 2024-2029 (%)

12.7.2 UAE - Market size and forecast 2024-2029

Chart on UAE - Market size and forecast 2024-2029 ($ million)
Data Table on UAE - Market size and forecast 2024-2029 ($ million)
Chart on UAE - Year-over-year growth 2024-2029 (%)
Data Table on UAE - Year-over-year growth 2024-2029 (%)

12.7.3 South Africa - Market size and forecast 2024-2029

Chart on South Africa - Market size and forecast 2024-2029 ($ million)
Data Table on South Africa - Market size and forecast 2024-2029 ($ million)
Chart on South Africa - Year-over-year growth 2024-2029 (%)
Data Table on South Africa - Year-over-year growth 2024-2029 (%)

12.7.4 Egypt - Market size and forecast 2024-2029

Chart on Egypt - Market size and forecast 2024-2029 ($ million)
Data Table on Egypt - Market size and forecast 2024-2029 ($ million)
Chart on Egypt - Year-over-year growth 2024-2029 (%)
Data Table on Egypt - Year-over-year growth 2024-2029 (%)

12.7.5 Nigeria - Market size and forecast 2024-2029

Chart on Nigeria - Market size and forecast 2024-2029 ($ million)
Data Table on Nigeria - Market size and forecast 2024-2029 ($ million)
Chart on Nigeria - Year-over-year growth 2024-2029 (%)
Data Table on Nigeria - Year-over-year growth 2024-2029 (%)

12.8 Market opportunity by geography

Market opportunity by geography ($ million)
Data Tables on Market opportunity by geography ($ million)

13. Drivers, Challenges, and Opportunity

13.1 Market drivers

Government incentives and subsidies for EV charging infrastructure developments
Increasing EV sales through tax incentives pushing demand for well-built EV charger infrastructure
Fuel emission and efficiency regulations driving adoption of EVs and chargers

13.2 Market challenges

Low performance of lithium-ion batteries restricting adoption of EVs
High cost of ownership for EVs compared with ICE vehicles
Stringent approval rules for establishment of charger units

13.3 Impact of drivers and challenges

Impact of drivers and challenges in 2024 and 2029

13.4 Market opportunities

Increased installation of DC fast charging stations
Powering of EV charging stations through solar energy
Powering EV charging stations through renewable energy

14. Competitive Landscape

14.1 Overview

14.2

Overview on criticality of inputs and factors of differentiation

14.3 Landscape disruption

Overview on factors of disruption

14.4 Industry risks

Impact of key risks on business

15. Competitive Analysis

15.1 Companies profiled

Companies covered

15.2 Company ranking index

15.3 Market positioning of companies

Matrix on companies position and classification

15.4 ABB Ltd.

ABB Ltd. - Overview
ABB Ltd. - Business segments
ABB Ltd. - Key news
ABB Ltd. - Key offerings
ABB Ltd. - Segment focus
SWOT

15.5 Bayerische Motoren Werke AG

Bayerische Motoren Werke AG - Overview
Bayerische Motoren Werke AG - Business segments
Bayerische Motoren Werke AG - Key offerings
Bayerische Motoren Werke AG - Segment focus
SWOT

15.6 BP Plc

BP Plc - Overview
BP Plc - Business segments
BP Plc - Key news
BP Plc - Key offerings
BP Plc - Segment focus
SWOT

15.7 BYD Co. Ltd.

BYD Co. Ltd. - Overview
BYD Co. Ltd. - Business segments
BYD Co. Ltd. - Key news
BYD Co. Ltd. - Key offerings
BYD Co. Ltd. - Segment focus
SWOT

15.8 ChargePoint Holdings Inc.

ChargePoint Holdings Inc. - Overview
ChargePoint Holdings Inc. - Product / Service
ChargePoint Holdings Inc. - Key news
ChargePoint Holdings Inc. - Key offerings
SWOT

15.9 Diebold Nixdorf Incorp.

Diebold Nixdorf Incorp. - Overview
Diebold Nixdorf Incorp. - Business segments
Diebold Nixdorf Incorp. - Key offerings
Diebold Nixdorf Incorp. - Segment focus
SWOT

15.10 Eaton Corp. Plc

Eaton Corp. Plc - Overview
Eaton Corp. Plc - Business segments
Eaton Corp. Plc - Key news
Eaton Corp. Plc - Key offerings
Eaton Corp. Plc - Segment focus
SWOT

15.11 ENGIE SA

ENGIE SA - Overview
ENGIE SA - Business segments
ENGIE SA - Key offerings
ENGIE SA - Segment focus
SWOT

15.12 Gridserve Sustainable Energy Ltd.

Gridserve Sustainable Energy Ltd. - Overview
Gridserve Sustainable Energy Ltd. - Product / Service
Gridserve Sustainable Energy Ltd. - Key offerings
SWOT

15.13 Schneider Electric SE

Schneider Electric SE - Overview
Schneider Electric SE - Business segments
Schneider Electric SE - Key news
Schneider Electric SE - Key offerings
Schneider Electric SE - Segment focus
SWOT

15.14 Shell plc

Shell plc - Overview
Shell plc - Business segments
Shell plc - Key news
Shell plc - Key offerings
Shell plc - Segment focus
SWOT

15.15 Siemens AG

Siemens AG - Overview
Siemens AG - Business segments
Siemens AG - Key news
Siemens AG - Key offerings
Siemens AG - Segment focus
SWOT

15.16 SWTCH Energy Inc.

SWTCH Energy Inc. - Overview
SWTCH Energy Inc. - Product / Service
SWTCH Energy Inc. - Key offerings
SWOT

15.17 Tesla Inc.

Tesla Inc. - Overview
Tesla Inc. - Business segments
Tesla Inc. - Key news
Tesla Inc. - Key offerings
Tesla Inc. - Segment focus
SWOT

15.18 TotalEnergies SE

TotalEnergies SE - Overview
TotalEnergies SE - Business segments
TotalEnergies SE - Key news
TotalEnergies SE - Key offerings
TotalEnergies SE - Segment focus
SWOT

16. Appendix

16.1 Scope of the report

Market definition
Objectives
Notes and caveats

16.2 Inclusions and exclusions checklist

Inclusions checklist
Exclusions checklist

16.3 Currency conversion rates for US$

16.4 Research methodology

16.5 Data procurement

Information sources

16.6 Data validation

16.7 Validation techniques employed for market sizing

16.8 Data synthesis

16.9 360 degree market analysis

16.10 List of abbreviations

Research Methodology

Technavio presents a detailed picture of the market by way of study, synthesis, and summation of data from multiple sources. The analysts have presented the various facets of the market with a particular focus on identifying the key industry influencers. The data thus presented is comprehensive, reliable, and the result of extensive research, both primary and secondary.

INFORMATION SOURCES

Primary sources

  • Manufacturers and suppliers
  • Channel partners
  • Industry experts
  • Strategic decision makers

Secondary sources

  • Industry journals and periodicals
  • Government data
  • Financial reports of key industry players
  • Historical data
  • Press releases

DATA ANALYSIS

Data Synthesis

  • Collation of data
  • Estimation of key figures
  • Analysis of derived insights

Data Validation

  • Triangulation with data models
  • Reference against proprietary databases
  • Corroboration with industry experts

REPORT WRITING

Qualitative

  • Market drivers
  • Market challenges
  • Market trends
  • Five forces analysis

Quantitative

  • Market size and forecast
  • Market segmentation
  • Geographical insights
  • Competitive landscape

Interested in this report?

Get your sample now to see our research methodology and insights!

Download Now

Frequently Asked Questions

EV Charger Service market growth will increase by USD 6305.5 million during 2025-2029 .

The EV Charger Service market is expected to grow at a CAGR of 12.9% during 2025-2029 .

EV Charger Service market is segmented by Type (AC, DC, Wireless) Power output (10-50 kW, Up to 10 kW, 50-150 kW, Above 150 kW) Installation type (Residential chargers, Commercial chargers, Workplace chargers, Public chargers)

ABB Ltd., Bayerische Motoren Werke AG, BP Plc, BYD Co. Ltd., ChargePoint Holdings Inc., Diebold Nixdorf Incorp., Eaton Corp. Plc, Efacec Power Solutions SGPS SA, ENGIE SA, Enphase Energy Inc., Gridserve Sustainable Energy Ltd., Schaffner Group, Schneider Electric SE, Shell plc, Siemens AG, SparkCharge Inc., SWTCH Energy Inc., Tesla Inc., TotalEnergies SE are a few of the key vendors in the EV Charger Service market.

APAC will register the highest growth rate of 44.3% among the other regions. Therefore, the EV Charger Service market in APAC is expected to garner significant business opportunities for the vendors during the forecast period.

China, Japan, India, South Korea, Australia, Indonesia, Germany, UK, France, Italy, Spain, The Netherlands, US, Canada, Mexico, Brazil, Argentina, Chile, Saudi Arabia, UAE, South Africa, Egypt, Nigeria

  • Government incentives and subsidies for EV charging infrastructure developments is the driving factor this market.

The EV Charger Service market vendors should focus on grabbing business opportunities from the Type segment as it accounted for the largest market share in the base year.