Wireless Charging Market Analysis, Size, and Forecast 2025-2029: APAC (China, India, Japan), Europe (France, Germany, Italy, The Netherlands, UK), North America (US and Canada), Middle East and Africa , and South America

Wireless Charging Market Analysis, Size, and Forecast 2025-2029:
APAC (China, India, Japan), Europe (France, Germany, Italy, The Netherlands, UK), North America (US and Canada), Middle East and Africa , and South America

Published: Mar 2025 207 Pages SKU: IRTNTR75676

Market Overview at a Glance

$40.37 B
Market Opportunity
39.6%
CAGR
28.9
YoY growth 2024-2025(%)

Wireless Charging Market Size 2025-2029

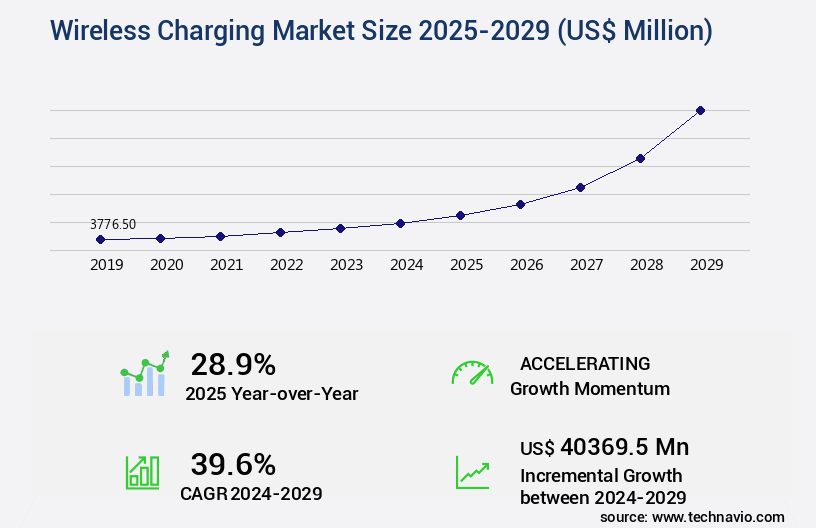
The wireless charging market size is valued to increase USD 40.37 billion, at a CAGR of 39.6% from 2024 to 2029. Rising adoption of consumer electronics will drive the wireless charging market.

Major Market Trends & Insights

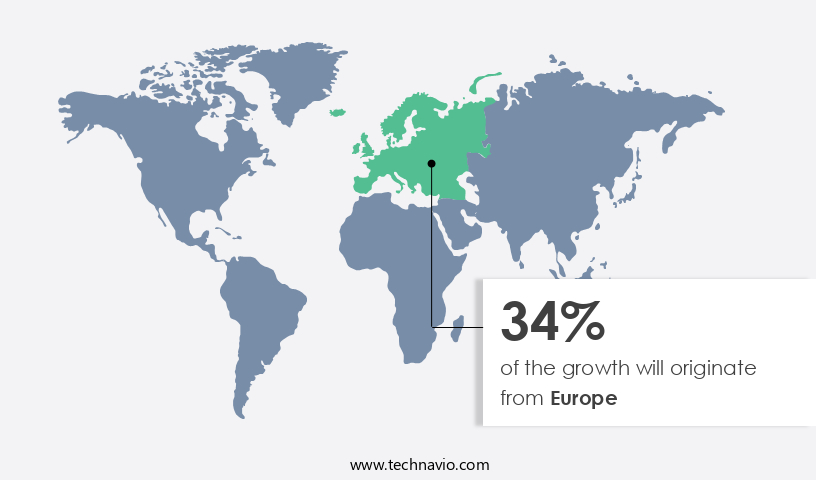
  • Europe dominated the market and accounted for a 34% growth during the forecast period.
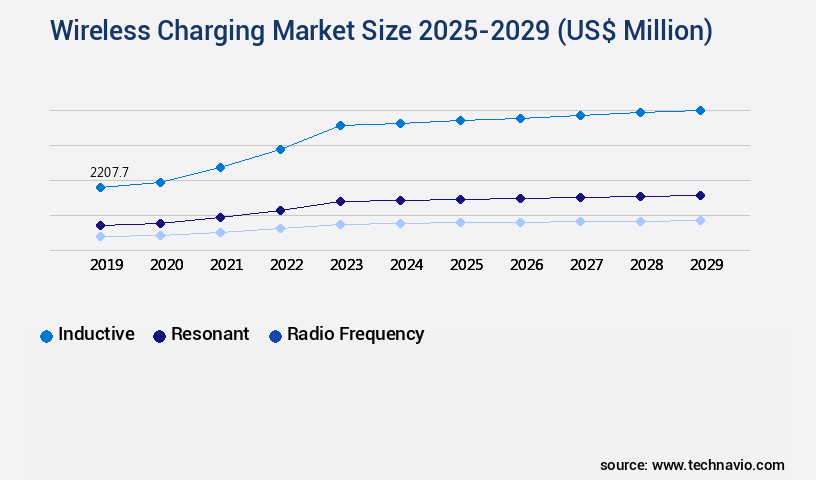
  • By Technology - Inductive segment was valued at USD 2.21 billion in 2023
  • By Component - Receivers segment accounted for the largest market revenue share in 2023

Market Size & Forecast

  • Market Opportunities: USD 1.00 million
  • Market Future Opportunities: USD 40369.50 million
  • CAGR from 2024 to 2029 : 39.6%

Market Summary

  • The market encompasses the production and sale of technologies and devices that enable the transfer of electrical energy without the use of cords or wires. Core technologies, such as magnetic resonance and magnetic induction, continue to evolve, driving growth in applications like smartphones, laptops, and electric vehicles. According to recent studies, the market is expected to reach a significant market share in the consumer electronics sector, with a growing number of devices integrating this technology. However, high installation costs and the introduction of new solutions remain challenges for market expansion.
  • Regulations, such as the Wireless Power Consortium and Power Matters Alliance, aim to standardize wireless charging technologies, ensuring interoperability and safety. The market's continuous evolution is influenced by major drivers like the increasing adoption of consumer electronics and the need for convenient charging solutions.

What will be the Size of the Wireless Charging Market during the forecast period?

Wireless Charging Market Size

Get Key Insights on Market Forecast (PDF) Request Free Sample

How is the Wireless Charging Market Segmented ?

The wireless charging industry research report provides comprehensive data (region-wise segment analysis), with forecasts and estimates in "USD million" for the period 2025-2029, as well as historical data from 2019-2023 for the following segments.

  • Technology
    • Inductive
    • Resonant
    • Radio frequency
    • Others
  • Component
    • Receivers
    • Transmitters
  • Application
    • Automotive
    • Consumer electronics
    • Healthcare
  • Geography
    • North America
      • US
      • Canada
    • Europe
      • France
      • Germany
      • Italy
      • The Netherlands
      • UK
    • APAC
      • China
      • India
      • Japan
    • Rest of World (ROW)

    By Technology Insights

    The inductive segment is estimated to witness significant growth during the forecast period.

    Wireless charging technology, driven primarily by inductive charging, continues to gain traction in various industries, including consumer electronics and commercial electric vehicles. Inductive charging, which operates via electromagnetic induction, has become the preferred choice due to its ease of use and compatibility with a wide range of devices. This technology enables energy transfer between a transmitter coil within the charging pad and a receiver coil embedded in the device, converting the alternating magnetic field generated by the charging pad into electrical energy for battery charging. In the consumer electronics sector, the adoption of wireless charging has witnessed significant growth, with smartphones, smartwatches, electric toothbrushes, and medical devices increasingly incorporating this technology.

    According to recent industry reports, over 50% of new smartphone models released in 2023 featured wireless charging capabilities. Furthermore, the market for wireless charging receivers is projected to expand at a steady pace, with a forecasted increase of 25% in annual sales by 2026. The commercial electric vehicle (EV) industry is also embracing wireless charging technology, with Tesla, a major player, recently announcing its plans to adopt inductive wireless charging for its Tesla Robotaxis. This shift towards wireless charging is expected to bring about a 30% reduction in charging time compared to traditional wired charging methods. In addition to charging efficiency and convenience, safety regulations play a crucial role in the market.

    Regulatory bodies mandate strict safety standards, including foreign object detection, electromagnetic interference (EMI) shielding, and thermal management, to ensure the safe and reliable operation of wireless charging systems. Moreover, advancements in technology continue to push the boundaries of wireless charging capabilities. Near-field communication, power transfer efficiency optimization, frequency matching, and inductive coupling are just a few of the innovations driving the market forward. As the industry evolves, wireless charging is poised to revolutionize the way we power our devices and vehicles, offering unparalleled convenience and efficiency.

    Wireless Charging Market Size

    Request Free Sample

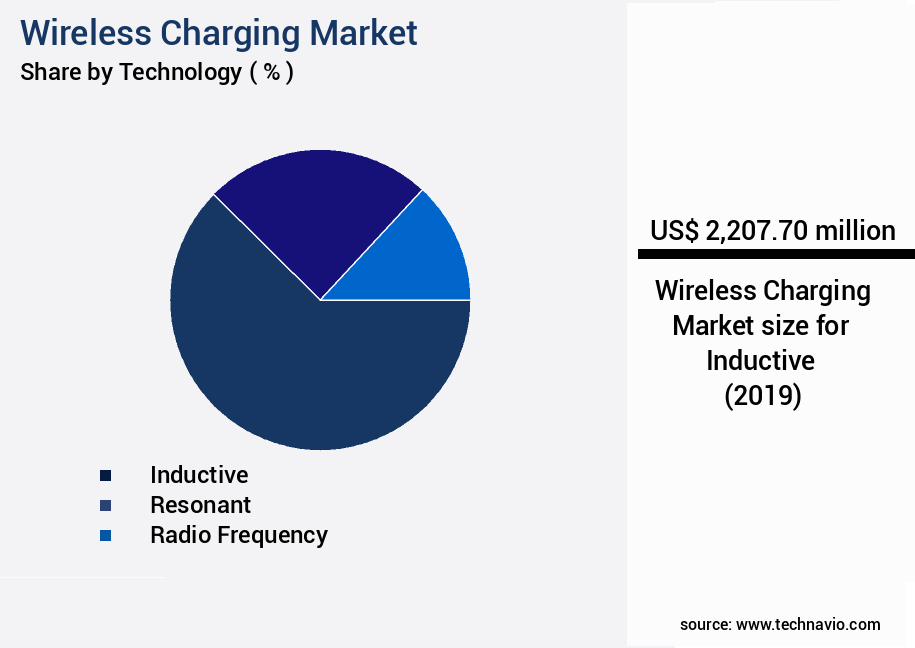
    The Inductive segment was valued at USD 2.21 billion in 2019 and showed a gradual increase during the forecast period.

    Wireless Charging Market Size

    Request Free Sample

    Regional Analysis

    Europe is estimated to contribute 34% to the growth of the global market during the forecast period.Technavio’s analysts have elaborately explained the regional trends and drivers that shape the market during the forecast period.

    Wireless Charging Market Share by Geography

    See How Wireless Charging Market Demand is Rising in Europe Request Free Sample

    The Asia-Pacific (APAC) region is a pivotal contributor to The market, fueled by advancements in consumer electronics, automotive, and healthcare sectors. China, in particular, holds a substantial market share due to its thriving consumer electronics industry. Leading manufacturers like Huawei, Xiaomi, and Oppo are at the forefront of this trend, integrating wireless charging technology into their smartphones, wearables, and other devices. Furthermore, the Chinese government's commitment to electric vehicles (EVs) has catalyzed the growth of wireless EV charging infrastructure.

    In 2023, new electric car registrations in China amounted to approximately 8 million units, signifying a significant market potential for wireless charging technology.

    Market Dynamics

    Our researchers analyzed the data with 2024 as the base year, along with the key drivers, trends, and challenges. A holistic analysis of drivers will help companies refine their marketing strategies to gain a competitive advantage.

    The market is experiencing significant growth as optimizing coil design for resonant charging and improving power transfer efficiency in inductive coupling gain increasing importance. Material selection plays a pivotal role in charging efficiency, with advanced materials enhancing performance and reducing energy loss. Strategies for mitigating electromagnetic interference are essential to ensure seamless wireless charging experiences. Designing efficient wireless charging systems for mobile devices is a key focus, with analysis of charging speed and power delivery being crucial factors. The comparison of Qi and AirFuel Alliance standards reveals Qi's dominance, accounting for over 70% of new product developments.

    Implementing foreign object detection in wireless power transfer and methods for enhancing thermal management in charging pads are essential considerations for safety and regulatory compliance. Overcoming interoperability challenges in wireless charging systems is a significant hurdle, with advanced circuit designs for high-efficiency wireless power transmission playing a vital role. Exploring long-range wireless charging technologies and innovative approaches to wireless power delivery at long range are the next frontiers. Improving safety and regulatory compliance in wireless charging and development of high-power wireless charging solutions are critical for expanding market penetration. Integration of wireless charging into consumer electronics is accelerating, with use of antenna design for improved wireless power transfer and efficient power regulation in wireless charging receivers becoming increasingly important.

    Fast wireless charging technologies for electric vehicles are gaining traction, with system-level optimization for efficient wireless energy transfer being a priority. Despite these advancements, only a minority of players, less than 15%, dominate the high-end the market.

    Wireless Charging Market Size

    What are the key market drivers leading to the rise in the adoption of Wireless Charging Industry?

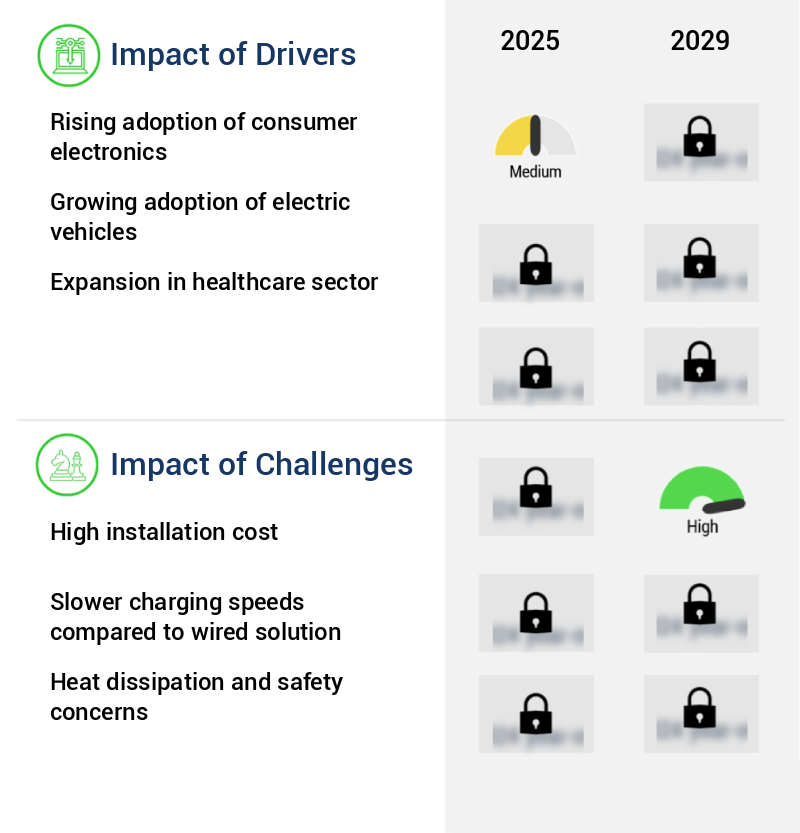
    • The significant increase in the usage of consumer electronics is the primary factor fueling market growth. Consumer electronics have witnessed increasing adoption rates, driving market expansion. 

    • The market experiences significant growth, fueled by the increasing adoption of consumer electronics. Wireless charging has become a standard feature in various devices, including smartphones, smartwatches, earbuds, and tablets. The Qi wireless charging standard, established by the Wireless Power Consortium, plays a pivotal role in this technology's widespread adoption. Major brands, such as Apple, Samsung, and Google, have embraced this standard, ensuring compatibility and convenience for consumers. Flagship devices, like the iPhone 15 series, Samsung Galaxy S24 Ultra, and Google Pixel 8, support Qi-based wireless charging, making it a crucial differentiator in the premium consumer electronics sector.
    • This technology's convenience and elimination of the need for frequent plugging and unplugging have made it an essential component in modern devices.

    What are the market trends shaping the Wireless Charging Industry?

    • Introducing the latest market trend, it is mandatory for businesses to adopt new solutions.

    • The market is experiencing significant advancements, driven by the increasing demand for efficient, cost-effective, and cable-free power solutions. Innovative wireless charging technologies are revolutionizing various industries, including industrial, micro-mobility, robotics, medical, and telecom sectors. For instance, Powermat Technologies recently introduced the PMT350 600W wireless power platform, which utilizes SmartInductive hybrid inductive/resonance technology. This versatile platform caters to diverse applications such as e-bikes, e-scooters, golf carts, rugged machines, and autonomous robots. By eliminating alignment constraints and reducing maintenance costs, this system significantly enhances efficiency.
    • Powermat's licensing model and sub-USD100 reference design offer OEMs lower capital expenditures while providing full production files and integration support. This illustrates the market's continuous evolution and its potential to transform industries with cable-free power solutions.

    What challenges does the Wireless Charging Industry face during its growth?

    • The high installation costs pose a significant challenge to the expansion and growth of the industry. 

    • Wireless charging technology, a promising innovation in power delivery, encounters substantial financial hurdles due to its high installation costs. Compared to traditional wired systems, the commercial implementation of wireless charging infrastructure entails significantly higher expenses. The cost disparity arises from the premium components essential for manufacturing and installing wireless charging systems. For example, the cost of a standard home electric vehicle (EV) charging station falls between USD500 and USD1,500. In contrast, a wireless EV charging system can cost between USD2,000 and USD3,000.
    • This substantial price difference underscores the financial burden associated with wireless technology adoption. Despite these challenges, the market continues to evolve, with applications spanning various sectors, including consumer electronics, transportation, and industrial equipment. As technology advances and economies of scale are realized, the cost disparity between wireless and wired systems may narrow, making wireless charging a more attractive option for businesses and consumers alike.

    Exclusive Technavio Analysis on Customer Landscape

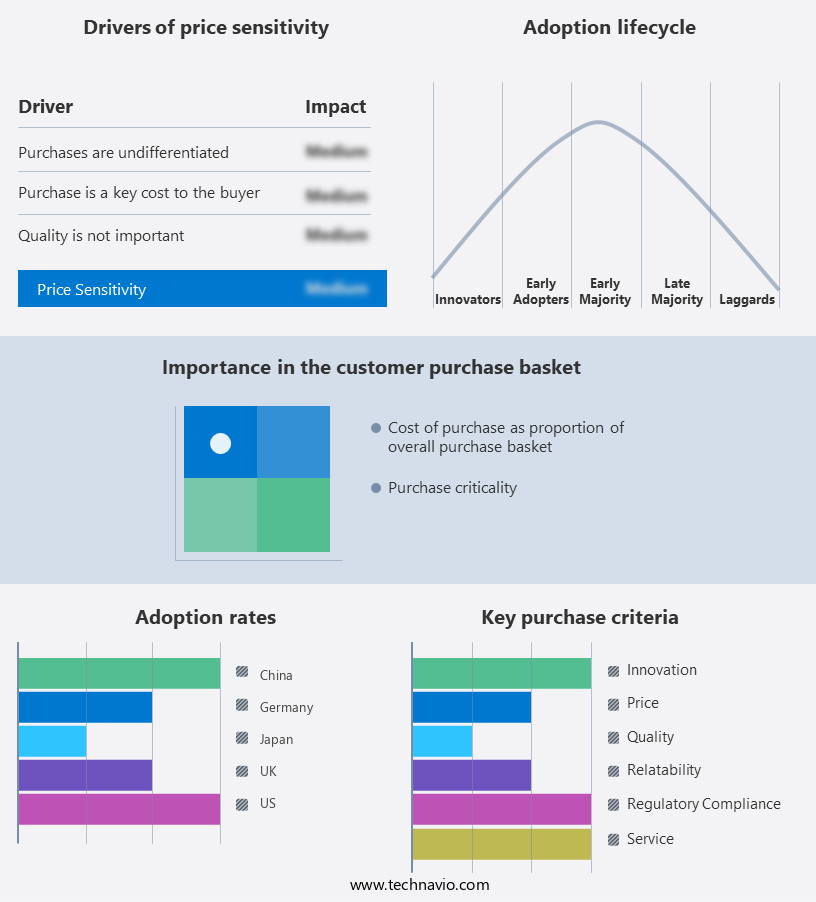
    The wireless charging market forecasting report includes the adoption lifecycle of the market, covering from the innovator’s stage to the laggard’s stage. It focuses on adoption rates in different regions based on penetration. Furthermore, the wireless charging market report also includes key purchase criteria and drivers of price sensitivity to help companies evaluate and develop their market growth analysis strategies.

    Wireless Charging Market Share by Geography

     Customer Landscape of Wireless Charging Industry

    Competitive Landscape

    Companies are implementing various strategies, such as strategic alliances, wireless charging market forecast, partnerships, mergers and acquisitions, geographical expansion, and product/service launches, to enhance their presence in the industry.

    Delta Electronics Inc. - This company specializes in wireless charging solutions designed for industrial automation applications. Their systems enable continuous, maintenance-free operation for robots, forklifts, and Automated Guided Vehicles (AGVs), ensuring optimal productivity and efficiency.

    The industry research and growth report includes detailed analyses of the competitive landscape of the market and information about key companies, including:

    • Delta Electronics Inc.
    • Energizer Holdings Inc.
    • Energous Corp.
    • etatronix GmbH
    • Leggett and Platt Inc.
    • LG Electronics Inc.
    • Murata Manufacturing Co. Ltd.
    • Ossia Inc.
    • Powercast Corp.
    • Powermat Technologies Ltd.
    • Qualcomm Inc.
    • Renesas Electronics Corp.
    • Samsung Electronics Co. Ltd.
    • Sony Group Corp.
    • Texas Instruments Inc.
    • WiTricity Corp.
    • ZENS

    Qualitative and quantitative analysis of companies has been conducted to help clients understand the wider business environment as well as the strengths and weaknesses of key industry players. Data is qualitatively analyzed to categorize companies as pure play, category-focused, industry-focused, and diversified; it is quantitatively analyzed to categorize companies as dominant, leading, strong, tentative, and weak.

    Recent Development and News in Wireless Charging Market

    • In January 2024, Samsung Electronics announced the launch of its new Galaxy S22 series, which supports 15W wireless charging, marking a significant increase in wireless charging capacity for the tech giant's flagship smartphones (Samsung Press Release, 2024).
    • In March 2024, Apple and Energous Corporation, a wireless charging technology company, announced a strategic partnership to bring Energous' WattUp Mid-Field wireless charging technology to Apple devices. This collaboration aimed to enable charging of Apple devices without the need for direct contact or placement on a charging pad (Apple Inc. Press Release, 2024).
    • In May 2024, Oppo, a leading Chinese smartphone manufacturer, unveiled its new Find X5 Pro model, featuring 50W AirVOOC wireless charging technology, making it the fastest wireless charging technology in the market at the time (Oppo Press Release, 2024).
    • In April 2025, the Federal Communications Commission (FCC) approved the deployment of a new wireless charging standard, WPC Qi2, which supports faster charging speeds and better efficiency for wireless charging systems. This approval is expected to accelerate the adoption of wireless charging technology in various industries, including consumer electronics and automotive (FCC Press Release, 2025).

    Dive into Technavio’s robust research methodology, blending expert interviews, extensive data synthesis, and validated models for unparalleled Wireless Charging Market insights. See full methodology.

    Market Scope

    Report Coverage

    Details

    Page number

    207

    Base year

    2024

    Historic period

    2019-2023

    Forecast period

    2025-2029

    Growth momentum & CAGR

    Accelerate at a CAGR of 39.6%

    Market growth 2025-2029

    USD 40369.5 million

    Market structure

    Fragmented

    YoY growth 2024-2025(%)

    28.9

    Key countries

    US, China, Germany, UK, Japan, France, India, Italy, The Netherlands, and Canada

    Competitive landscape

    Leading Companies, Market Positioning of Companies, Competitive Strategies, and Industry Risks

    Request Free Sample

    Research Analyst Overview

    • The market continues to evolve, with key players pushing the boundaries of technology to enhance efficiency and compatibility. One notable development is the AirFuel Alliance, a consortium of companies working to standardize wireless charging technologies, including power regulation and resonant charging. Receiver coil material selection plays a crucial role in optimizing power transfer efficiency. For instance, ferrite materials are commonly used due to their high magnetic permeability, while new materials like gallium nitride offer improved efficiency and output power. Near-field communication and inductive coupling are two primary wireless charging technologies. While inductive coupling has a longer charging distance, near-field communication offers faster charging speeds.
    • Frequency matching and efficiency optimization are essential for enhancing power transfer efficiency, with companies investing in circuit and coil design innovations. Device compatibility is another critical aspect, with companies focusing on ensuring compatibility with various devices and charging standards, such as Qi and WPC. Thermal management and antenna design are also essential for maintaining energy efficiency and minimizing power loss. Safety regulations, including foreign object detection and electromagnetic interference shielding, are increasingly important as wireless charging technology becomes more prevalent. Wireless charging transmitters and receivers continue to evolve, with advancements in power loss reduction and charging speed.
    • In the realm of wireless power transfer, companies are exploring magnetic resonance and electromagnetic induction to improve efficiency and charging distance. Wireless charging pads are becoming more commonplace, with advancements in technology enabling seamless integration into everyday life. Overall, the market is a dynamic and evolving landscape, with companies continually pushing the boundaries of technology to enhance efficiency, compatibility, and safety.

    What are the Key Data Covered in this Wireless Charging Market Research and Growth Report?

    • What is the expected growth of the Wireless Charging Market between 2025 and 2029?

      • USD 40.37 billion, at a CAGR of 39.6%

    • What segmentation does the market report cover?

      • The report is segmented by Technology (Inductive, Resonant, Radio frequency, and Others), Component (Receivers and Transmitters), Geography (APAC, Europe, North America, Middle East and Africa, and South America), and Application (Automotive, Consumer electronics, and Healthcare)

    • Which regions are analyzed in the report?

      • APAC, Europe, North America, Middle East and Africa, and South America

    • What are the key growth drivers and market challenges?

      • Rising adoption of consumer electronics, High installation cost

    • Who are the major players in the Wireless Charging Market?

      • Delta Electronics Inc., Energizer Holdings Inc., Energous Corp., etatronix GmbH, Leggett and Platt Inc., LG Electronics Inc., Murata Manufacturing Co. Ltd., Ossia Inc., Powercast Corp., Powermat Technologies Ltd., Qualcomm Inc., Renesas Electronics Corp., Samsung Electronics Co. Ltd., Sony Group Corp., Texas Instruments Inc., WiTricity Corp., and ZENS

    Market Research Insights

    • The market continues to advance, driven by the demand for convenience and efficiency in powering portable devices. Two significant trends shape this dynamic landscape: the increasing importance of high-power wireless charging and the ongoing efforts towards standardization. According to internal market data, high-power wireless charging accounted for approximately 30% of total wireless charging shipments in 2022, with a charge rate of up to 15W. In contrast, mid-range wireless charging, delivering power between 5W and 15W, comprised the remaining 70%. Magnetic field strength and heat dissipation are crucial factors in wireless charging efficiency. High-power wireless charging requires stronger magnetic fields and efficient heat dissipation systems to maintain optimal performance.
    • Operating at resonant frequencies and optimizing coil alignment further enhances the efficiency of wireless energy transfer. Standardization efforts aim to address interoperability issues and improve system integration. Wireless charging modules, power receivers, and transmitters are essential components in this ecosystem, requiring power delivery, power conversion, and charging protocols to ensure seamless compatibility. As the market evolves, the focus on over-the-air charging, electromagnetic compatibility, and long-range wireless charging will continue to shape the future of wireless power technology.

    We can help! Our analysts can customize this wireless charging market research report to meet your requirements.

    Get in touch

    1 Executive Summary

    • 1.1 Market overview
      • Executive Summary - Chart on Market Overview
      • Executive Summary - Data Table on Market Overview
      • Executive Summary - Chart on Global Market Characteristics
      • Executive Summary - Chart on Market by Geography
      • Executive Summary - Chart on Market Segmentation by Technology
      • Executive Summary - Chart on Market Segmentation by Component
      • Executive Summary - Chart on Incremental Growth
      • Executive Summary - Data Table on Incremental Growth
      • Executive Summary - Chart on Company Market Positioning

    2 Technavio Analysis

    • 2.1 Analysis of price sensitivity, lifecycle, customer purchase basket, adoption rates, and purchase criteria
      • Analysis of price sensitivity, lifecycle, customer purchase basket, adoption rates, and purchase criteria
    • 2.2 Criticality of inputs and Factors of differentiation
      • Overview on criticality of inputs and factors of differentiation
    • 2.3 Factors of disruption
      • Overview on factors of disruption
    • 2.4 Impact of drivers and challenges
      • Impact of drivers and challenges in 2024 and 2029

    3 Market Landscape

    • 3.1 Market ecosystem
      • Parent Market
      • Data Table on - Parent Market
    • 3.2 Market characteristics
      • Market characteristics analysis
    • 3.3 Value chain analysis
      • Value chain analysis

    4 Market Sizing

    • 4.1 Market definition
      • Offerings of companies included in the market definition
    • 4.2 Market segment analysis
      • Market segments
    • 4.3 Market size 2024
      • 4.4 Market outlook: Forecast for 2024-2029
        • Chart on Global - Market size and forecast 2024-2029 ($ million)
        • Data Table on Global - Market size and forecast 2024-2029 ($ million)
        • Chart on Global Market: Year-over-year growth 2024-2029 (%)
        • Data Table on Global Market: Year-over-year growth 2024-2029 (%)

      5 Historic Market Size

      • 5.1 Global Wireless Charging Market 2019 - 2023
        • Historic Market Size - Data Table on Global Wireless Charging Market 2019 - 2023 ($ million)
      • 5.2 Technology segment analysis 2019 - 2023
        • Historic Market Size - Technology Segment 2019 - 2023 ($ million)
      • 5.3 Component segment analysis 2019 - 2023
        • Historic Market Size - Component Segment 2019 - 2023 ($ million)
      • 5.4 Geography segment analysis 2019 - 2023
        • Historic Market Size - Geography Segment 2019 - 2023 ($ million)
      • 5.5 Country segment analysis 2019 - 2023
        • Historic Market Size - Country Segment 2019 - 2023 ($ million)

      6 Qualitative Analysis

      • 6.1 Impact of AI on Global Wireless Charging Market

        7 Five Forces Analysis

        • 7.1 Five forces summary
          • Five forces analysis - Comparison between 2024 and 2029
        • 7.2 Bargaining power of buyers
          • Bargaining power of buyers - Impact of key factors 2024 and 2029
        • 7.3 Bargaining power of suppliers
          • Bargaining power of suppliers - Impact of key factors in 2024 and 2029
        • 7.4 Threat of new entrants
          • Threat of new entrants - Impact of key factors in 2024 and 2029
        • 7.5 Threat of substitutes
          • Threat of substitutes - Impact of key factors in 2024 and 2029
        • 7.6 Threat of rivalry
          • Threat of rivalry - Impact of key factors in 2024 and 2029
        • 7.7 Market condition
          • Chart on Market condition - Five forces 2024 and 2029

        8 Market Segmentation by Technology

        • 8.1 Market segments
          • Chart on Technology - Market share (2024-2029) (%)
          • Data Table on Technology - Market share (2024-2029) (%)
        • 8.2 Comparison by Technology
          • Chart on Comparison by Technology
          • Data Table on Comparison by Technology
        • 8.3 Inductive - Market size and forecast (2024-2029)
          • Chart on Inductive - Market size and forecast (2024-2029) ($ million)
          • Data Table on Inductive - Market size and forecast (2024-2029) ($ million)
          • Chart on Inductive - Year-over-year growth (2024-2029) (%)
          • Data Table on Inductive - Year-over-year growth (2024-2029) (%)
        • 8.4 Resonant - Market size and forecast (2024-2029)
          • Chart on Resonant - Market size and forecast (2024-2029) ($ million)
          • Data Table on Resonant - Market size and forecast (2024-2029) ($ million)
          • Chart on Resonant - Year-over-year growth (2024-2029) (%)
          • Data Table on Resonant - Year-over-year growth (2024-2029) (%)
        • 8.5 Radio frequency - Market size and forecast (2024-2029)
          • Chart on Radio frequency - Market size and forecast (2024-2029) ($ million)
          • Data Table on Radio frequency - Market size and forecast (2024-2029) ($ million)
          • Chart on Radio frequency - Year-over-year growth (2024-2029) (%)
          • Data Table on Radio frequency - Year-over-year growth (2024-2029) (%)
        • 8.6 Others - Market size and forecast (2024-2029)
          • Chart on Others - Market size and forecast (2024-2029) ($ million)
          • Data Table on Others - Market size and forecast (2024-2029) ($ million)
          • Chart on Others - Year-over-year growth (2024-2029) (%)
          • Data Table on Others - Year-over-year growth (2024-2029) (%)
        • 8.7 Market opportunity by Technology
          • Market opportunity by Technology ($ million)
          • Data Table on Market opportunity by Technology ($ million)

        9 Market Segmentation by Component

        • 9.1 Market segments
          • Chart on Component - Market share (2024-2029) (%)
          • Data Table on Component - Market share (2024-2029) (%)
        • 9.2 Comparison by Component
          • Chart on Comparison by Component
          • Data Table on Comparison by Component
        • 9.3 Receivers - Market size and forecast (2024-2029)
          • Chart on Receivers - Market size and forecast (2024-2029) ($ million)
          • Data Table on Receivers - Market size and forecast (2024-2029) ($ million)
          • Chart on Receivers - Year-over-year growth (2024-2029) (%)
          • Data Table on Receivers - Year-over-year growth (2024-2029) (%)
        • 9.4 Transmitters - Market size and forecast (2024-2029)
          • Chart on Transmitters - Market size and forecast (2024-2029) ($ million)
          • Data Table on Transmitters - Market size and forecast (2024-2029) ($ million)
          • Chart on Transmitters - Year-over-year growth (2024-2029) (%)
          • Data Table on Transmitters - Year-over-year growth (2024-2029) (%)
        • 9.5 Market opportunity by Component
          • Market opportunity by Component ($ million)
          • Data Table on Market opportunity by Component ($ million)

        10 Market Segmentation by Application

        • 10.1 Market segments
          • Chart on Application - Market share (2024-2029) (%)
          • Data Table on Application - Market share (2024-2029) (%)
        • 10.2 Comparison by Application
          • Chart on Comparison by Application
          • Data Table on Comparison by Application
        • 10.3 Automotive - Market size and forecast (2024-2029)
          • Chart on Automotive - Market size and forecast (2024-2029) ($ million)
          • Data Table on Automotive - Market size and forecast (2024-2029) ($ million)
          • Chart on Automotive - Year-over-year growth (2024-2029) (%)
          • Data Table on Automotive - Year-over-year growth (2024-2029) (%)
        • 10.4 Consumer electronics - Market size and forecast (2024-2029)
          • Chart on Consumer electronics - Market size and forecast (2024-2029) ($ million)
          • Data Table on Consumer electronics - Market size and forecast (2024-2029) ($ million)
          • Chart on Consumer electronics - Year-over-year growth (2024-2029) (%)
          • Data Table on Consumer electronics - Year-over-year growth (2024-2029) (%)
        • 10.5 Healthcare - Market size and forecast (2024-2029)
          • Chart on Healthcare - Market size and forecast (2024-2029) ($ million)
          • Data Table on Healthcare - Market size and forecast (2024-2029) ($ million)
          • Chart on Healthcare - Year-over-year growth (2024-2029) (%)
          • Data Table on Healthcare - Year-over-year growth (2024-2029) (%)
        • 10.6 Market opportunity by Application
          • Market opportunity by Application ($ million)
          • Data Table on Market opportunity by Application ($ million)

        11 Customer Landscape

        • 11.1 Customer landscape overview
          • Analysis of price sensitivity, lifecycle, customer purchase basket, adoption rates, and purchase criteria

        12 Geographic Landscape

        • 12.1 Geographic segmentation
          • Chart on Market share by geography 2024-2029 (%)
          • Data Table on Market share by geography 2024-2029 (%)
        • 12.2 Geographic comparison
          • Chart on Geographic comparison
          • Data Table on Geographic comparison
        • 12.3 APAC - Market size and forecast 2024-2029
          • Chart on APAC - Market size and forecast 2024-2029 ($ million)
          • Data Table on APAC - Market size and forecast 2024-2029 ($ million)
          • Chart on APAC - Year-over-year growth 2024-2029 (%)
          • Data Table on APAC - Year-over-year growth 2024-2029 (%)
        • 12.4 Europe - Market size and forecast 2024-2029
          • Chart on Europe - Market size and forecast 2024-2029 ($ million)
          • Data Table on Europe - Market size and forecast 2024-2029 ($ million)
          • Chart on Europe - Year-over-year growth 2024-2029 (%)
          • Data Table on Europe - Year-over-year growth 2024-2029 (%)
        • 12.5 North America - Market size and forecast 2024-2029
          • Chart on North America - Market size and forecast 2024-2029 ($ million)
          • Data Table on North America - Market size and forecast 2024-2029 ($ million)
          • Chart on North America - Year-over-year growth 2024-2029 (%)
          • Data Table on North America - Year-over-year growth 2024-2029 (%)
        • 12.6 Middle East and Africa - Market size and forecast 2024-2029
          • Chart on Middle East and Africa - Market size and forecast 2024-2029 ($ million)
          • Data Table on Middle East and Africa - Market size and forecast 2024-2029 ($ million)
          • Chart on Middle East and Africa - Year-over-year growth 2024-2029 (%)
          • Data Table on Middle East and Africa - Year-over-year growth 2024-2029 (%)
        • 12.7 South America - Market size and forecast 2024-2029
          • Chart on South America - Market size and forecast 2024-2029 ($ million)
          • Data Table on South America - Market size and forecast 2024-2029 ($ million)
          • Chart on South America - Year-over-year growth 2024-2029 (%)
          • Data Table on South America - Year-over-year growth 2024-2029 (%)
        • 12.8 US - Market size and forecast 2024-2029
          • Chart on US - Market size and forecast 2024-2029 ($ million)
          • Data Table on US - Market size and forecast 2024-2029 ($ million)
          • Chart on US - Year-over-year growth 2024-2029 (%)
          • Data Table on US - Year-over-year growth 2024-2029 (%)
        • 12.9 China - Market size and forecast 2024-2029
          • Chart on China - Market size and forecast 2024-2029 ($ million)
          • Data Table on China - Market size and forecast 2024-2029 ($ million)
          • Chart on China - Year-over-year growth 2024-2029 (%)
          • Data Table on China - Year-over-year growth 2024-2029 (%)
        • 12.10 Germany - Market size and forecast 2024-2029
          • Chart on Germany - Market size and forecast 2024-2029 ($ million)
          • Data Table on Germany - Market size and forecast 2024-2029 ($ million)
          • Chart on Germany - Year-over-year growth 2024-2029 (%)
          • Data Table on Germany - Year-over-year growth 2024-2029 (%)
        • 12.11 UK - Market size and forecast 2024-2029
          • Chart on UK - Market size and forecast 2024-2029 ($ million)
          • Data Table on UK - Market size and forecast 2024-2029 ($ million)
          • Chart on UK - Year-over-year growth 2024-2029 (%)
          • Data Table on UK - Year-over-year growth 2024-2029 (%)
        • 12.12 Japan - Market size and forecast 2024-2029
          • Chart on Japan - Market size and forecast 2024-2029 ($ million)
          • Data Table on Japan - Market size and forecast 2024-2029 ($ million)
          • Chart on Japan - Year-over-year growth 2024-2029 (%)
          • Data Table on Japan - Year-over-year growth 2024-2029 (%)
        • 12.13 India - Market size and forecast 2024-2029
          • Chart on India - Market size and forecast 2024-2029 ($ million)
          • Data Table on India - Market size and forecast 2024-2029 ($ million)
          • Chart on India - Year-over-year growth 2024-2029 (%)
          • Data Table on India - Year-over-year growth 2024-2029 (%)
        • 12.14 Canada - Market size and forecast 2024-2029
          • Chart on Canada - Market size and forecast 2024-2029 ($ million)
          • Data Table on Canada - Market size and forecast 2024-2029 ($ million)
          • Chart on Canada - Year-over-year growth 2024-2029 (%)
          • Data Table on Canada - Year-over-year growth 2024-2029 (%)
        • 12.15 France - Market size and forecast 2024-2029
          • Chart on France - Market size and forecast 2024-2029 ($ million)
          • Data Table on France - Market size and forecast 2024-2029 ($ million)
          • Chart on France - Year-over-year growth 2024-2029 (%)
          • Data Table on France - Year-over-year growth 2024-2029 (%)
        • 12.16 Italy - Market size and forecast 2024-2029
          • Chart on Italy - Market size and forecast 2024-2029 ($ million)
          • Data Table on Italy - Market size and forecast 2024-2029 ($ million)
          • Chart on Italy - Year-over-year growth 2024-2029 (%)
          • Data Table on Italy - Year-over-year growth 2024-2029 (%)
        • 12.17 The Netherlands - Market size and forecast 2024-2029
          • Chart on The Netherlands - Market size and forecast 2024-2029 ($ million)
          • Data Table on The Netherlands - Market size and forecast 2024-2029 ($ million)
          • Chart on The Netherlands - Year-over-year growth 2024-2029 (%)
          • Data Table on The Netherlands - Year-over-year growth 2024-2029 (%)
        • 12.18 Market opportunity by geography
          • Market opportunity by geography ($ million)
          • Data Tables on Market opportunity by geography ($ million)
        • 12.19 Rest of World (ROW) - Market size and forecast (2024-2029)
          • Chart on Rest of World (ROW) - Market size and forecast (2024-2029) ($ million)
          • Data Table on Rest of World (ROW) - Market size and forecast (2024-2029) ($ million)
          • Chart on Rest of World (ROW) - Year-over-year growth (2024-2029) (%)
          • Data Table on Rest of World (ROW) - Year-over-year growth (2024-2029) (%)

        13 Drivers, Challenges, and Opportunity/Restraints

        • 13.1 Market drivers
          • 13.2 Market challenges
            • 13.3 Impact of drivers and challenges
              • Impact of drivers and challenges in 2024 and 2029
            • 13.4 Market opportunities/restraints

              14 Competitive Landscape

              • 14.1 Overview
                • 14.2 Competitive Landscape
                  • Overview on criticality of inputs and factors of differentiation
                • 14.3 Landscape disruption
                  • Overview on factors of disruption
                • 14.4 Industry risks
                  • Impact of key risks on business

                15 Competitive Analysis

                • 15.1 Companies profiled
                  • Companies covered
                • 15.2 Company ranking index
                  • Company ranking index
                • 15.3 Market positioning of companies
                  • Matrix on companies position and classification
                • 15.4 Delta Electronics Inc.
                  • Delta Electronics Inc. - Overview
                  • Delta Electronics Inc. - Business segments
                  • Delta Electronics Inc. - Key news
                  • Delta Electronics Inc. - Key offerings
                  • Delta Electronics Inc. - Segment focus
                  • SWOT
                • 15.5 Energizer Holdings Inc.
                  • Energizer Holdings Inc. - Overview
                  • Energizer Holdings Inc. - Business segments
                  • Energizer Holdings Inc. - Key offerings
                  • Energizer Holdings Inc. - Segment focus
                  • SWOT
                • 15.6 Energous Corp.
                  • Energous Corp. - Overview
                  • Energous Corp. - Product / Service
                  • Energous Corp. - Key offerings
                  • SWOT
                • 15.7 etatronix GmbH
                  • etatronix GmbH - Overview
                  • etatronix GmbH - Product / Service
                  • etatronix GmbH - Key offerings
                  • SWOT
                • 15.8 Leggett and Platt Inc.
                  • Leggett and Platt Inc. - Overview
                  • Leggett and Platt Inc. - Business segments
                  • Leggett and Platt Inc. - Key offerings
                  • Leggett and Platt Inc. - Segment focus
                  • SWOT
                • 15.9 LG Electronics Inc.
                  • LG Electronics Inc. - Overview
                  • LG Electronics Inc. - Product / Service
                  • LG Electronics Inc. - Key offerings
                  • SWOT
                • 15.10 Murata Manufacturing Co. Ltd.
                  • Murata Manufacturing Co. Ltd. - Overview
                  • Murata Manufacturing Co. Ltd. - Business segments
                  • Murata Manufacturing Co. Ltd. - Key news
                  • Murata Manufacturing Co. Ltd. - Key offerings
                  • Murata Manufacturing Co. Ltd. - Segment focus
                  • SWOT
                • 15.11 Ossia Inc.
                  • Ossia Inc. - Overview
                  • Ossia Inc. - Product / Service
                  • Ossia Inc. - Key offerings
                  • SWOT
                • 15.12 Powermat Technologies Ltd.
                  • Powermat Technologies Ltd. - Overview
                  • Powermat Technologies Ltd. - Product / Service
                  • Powermat Technologies Ltd. - Key offerings
                  • SWOT
                • 15.13 Qualcomm Inc.
                  • Qualcomm Inc. - Overview
                  • Qualcomm Inc. - Business segments
                  • Qualcomm Inc. - Key news
                  • Qualcomm Inc. - Key offerings
                  • Qualcomm Inc. - Segment focus
                  • SWOT
                • 15.14 Renesas Electronics Corp.
                  • Renesas Electronics Corp. - Overview
                  • Renesas Electronics Corp. - Business segments
                  • Renesas Electronics Corp. - Key news
                  • Renesas Electronics Corp. - Key offerings
                  • Renesas Electronics Corp. - Segment focus
                  • SWOT
                • 15.15 Samsung Electronics Co. Ltd.
                  • Samsung Electronics Co. Ltd. - Overview
                  • Samsung Electronics Co. Ltd. - Business segments
                  • Samsung Electronics Co. Ltd. - Key news
                  • Samsung Electronics Co. Ltd. - Key offerings
                  • Samsung Electronics Co. Ltd. - Segment focus
                  • SWOT
                • 15.16 Sony Group Corp.
                  • Sony Group Corp. - Overview
                  • Sony Group Corp. - Business segments
                  • Sony Group Corp. - Key offerings
                  • Sony Group Corp. - Segment focus
                  • SWOT
                • 15.17 Texas Instruments Inc.
                  • Texas Instruments Inc. - Overview
                  • Texas Instruments Inc. - Business segments
                  • Texas Instruments Inc. - Key offerings
                  • Texas Instruments Inc. - Segment focus
                  • SWOT
                • 15.18 WiTricity Corp.
                  • WiTricity Corp. - Overview
                  • WiTricity Corp. - Product / Service
                  • WiTricity Corp. - Key offerings
                  • SWOT

                16 Appendix

                • 16.1 Scope of the report
                  • 16.2 Inclusions and exclusions checklist
                    • Inclusions checklist
                    • Exclusions checklist
                  • 16.3 Currency conversion rates for US$
                    • Currency conversion rates for US$
                  • 16.4 Research methodology
                    • Research methodology
                  • 16.5 Data procurement
                    • Information sources
                  • 16.6 Data validation
                    • Data validation
                  • 16.7 Validation techniques employed for market sizing
                    • Validation techniques employed for market sizing
                  • 16.8 Data synthesis
                    • Data synthesis
                  • 16.9 360 degree market analysis
                    • 360 degree market analysis
                  • 16.10 List of abbreviations
                    • List of abbreviations

                  Research Methodology

                  Technavio presents a detailed picture of the market by way of study, synthesis, and summation of data from multiple sources. The analysts have presented the various facets of the market with a particular focus on identifying the key industry influencers. The data thus presented is comprehensive, reliable, and the result of extensive research, both primary and secondary.

                  INFORMATION SOURCES

                  Primary sources

                  • Manufacturers and suppliers
                  • Channel partners
                  • Industry experts
                  • Strategic decision makers

                  Secondary sources

                  • Industry journals and periodicals
                  • Government data
                  • Financial reports of key industry players
                  • Historical data
                  • Press releases

                  DATA ANALYSIS

                  Data Synthesis

                  • Collation of data
                  • Estimation of key figures
                  • Analysis of derived insights

                  Data Validation

                  • Triangulation with data models
                  • Reference against proprietary databases
                  • Corroboration with industry experts

                  REPORT WRITING

                  Qualitative

                  • Market drivers
                  • Market challenges
                  • Market trends
                  • Five forces analysis

                  Quantitative

                  • Market size and forecast
                  • Market segmentation
                  • Geographical insights
                  • Competitive landscape

                  Interested in this report?

                  Get your sample now to see our research methodology and insights!

                  Download Now

                  Frequently Asked Questions

                  Wireless Charging market growth will increase by $ 40369.5 mn during 2025-2029 .

                  The Wireless Charging market is expected to grow at a CAGR of 39.6% during 2025-2029 .

                  Wireless Charging market is segmented by Technology( Inductive, Resonant, Radio frequency, Others) Component( Receivers, Transmitters)

                  Delta Electronics Inc., Energizer Holdings Inc., Energous Corp., etatronix GmbH, Leggett and Platt Inc., LG Electronics Inc., Murata Manufacturing Co. Ltd., Ossia Inc., Powercast Corp., Powermat Technologies Ltd., Qualcomm Inc., Renesas Electronics Corp., Samsung Electronics Co. Ltd., Sony Group Corp., Texas Instruments Inc., WiTricity Corp., ZENS are a few of the key vendors in the Wireless Charging market.

                  Europe will register the highest growth rate of 34% among the other regions. Therefore, the Wireless Charging market in Europe is expected to garner significant business opportunities for the vendors during the forecast period.

                  US, China, Germany, UK, Japan, France, India, Italy, The Netherlands, Canada

                  • Rising adoption of consumer electronicsThe increasing adoption of consumer electronics is a major driver of the global wireless charging market. Wireless charging has become a standard feature in modern smartphones is the driving factor this market.
                  • smartwatches is the driving factor this market.
                  • earbuds is the driving factor this market.
                  • and tablets is the driving factor this market.
                  • offering convenience and eliminating the need for frequent plugging and unplugging. The Qi wireless charging standard is the driving factor this market.
                  • developed by the Wireless Power Consortium is the driving factor this market.
                  • has played a crucial role in the widespread adoption of this technology is the driving factor this market.
                  • ensuring compatibility across major brands such as Apple is the driving factor this market.
                  • Samsung is the driving factor this market.
                  • and Google. With flagship devices like the iPhone 15 series is the driving factor this market.
                  • Samsung Galaxy S24 Ultra is the driving factor this market.
                  • and Google Pixel 8 supporting Qi-based wireless charging is the driving factor this market.
                  • the technology has become a key differentiator in premium consumer electronics.Apart from smartphones is the driving factor this market.
                  • wearable devices such as smartwatches and wireless earbuds are also driving demand for wireless charging solutions. Companies like Apple (AirPods and Apple Watch) is the driving factor this market.
                  • Samsung (Galaxy Buds and Galaxy Watch) is the driving factor this market.
                  • and Xiaomi are incorporating wireless charging in their latest wearable models is the driving factor this market.
                  • enhancing user convenience. Additionally is the driving factor this market.
                  • the introduction of reverse wireless charging in smartphones allows users to charge smaller devices is the driving factor this market.
                  • such as earbuds and smartwatches is the driving factor this market.
                  • directly from their phones.Another contributing factor is the emergence of multi-device charging solutions is the driving factor this market.
                  • such as MagSafe of Apple is the driving factor this market.
                  • Wireless Charger Trio of Samsung is the driving factor this market.
                  • and wireless charging pads of Belkin. These innovations allow users to charge multiple devices simultaneously is the driving factor this market.
                  • promoting a seamless is the driving factor this market.
                  • cable-free experience. Furthermore is the driving factor this market.
                  • the increasing number of public wireless charging stations in airports is the driving factor this market.
                  • cafes is the driving factor this market.
                  • hotels is the driving factor this market.
                  • and vehicles is encouraging more consumers to embrace wireless charging technology.As consumers continue to demand faster is the driving factor this market.
                  • more efficient is the driving factor this market.
                  • and convenient charging solutions is the driving factor this market.
                  • manufacturers are investing in advanced wireless charging technologies such as resonant and radio frequency charging is the driving factor this market.
                  • which promise greater flexibility and long-range power transfer. This ongoing trend is expected to further accelerate the growth of the global wireless charging market. is the driving factor this market.

                  The Wireless Charging market vendors should focus on grabbing business opportunities from the Inductive segment as it accounted for the largest market share in the base year.