EV charging Adapter Market Size 2024-2028
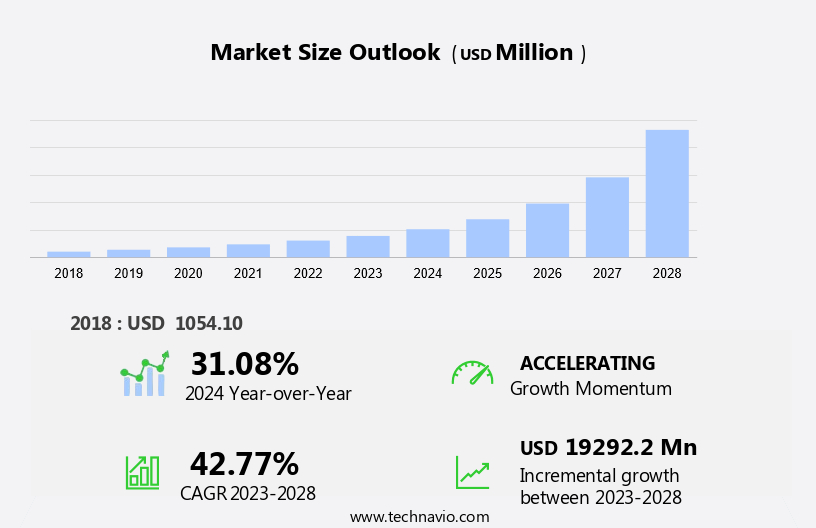
The EV charging adapter market size is forecast to increase by USD 19.29 billion at a CAGR of 42.77% between 2023 and 2028.
- The electric vehicle (EV) market In the Rapidly Automobile Sector is experiencing significant growth, driven by increasing sales of EVs due to tax incentives and government initiatives. This trend is leading to a heightened demand for EV charging infrastructure. The focus on reducing charging time is another key growth factor, with both AC level 2 and DC fast chargers gaining popularity. These adapters ensure seamless charging at charging ports, providing convenience to EV users during the transition from traditional internal combustion engine vehicles to electric vehicles. However, the increasing cost pressure is adversely affecting sales of AC level 2 and DC fast chargers, as consumers opt for cheaper Level 1 chargers. The forecast period is expected to witness continued growth In the market, as the charging infrastructure expands to meet the demands of the burgeoning EV market. Charging connector types, such as Type 1, Type 2, and Tesla, are also gaining importance In the market, as they cater to the varying charging needs of different EV models. In response to growing concerns over road safety and traffic congestion, governments worldwide are prioritizing the integration of advanced safety features in vehicles.
What will be the Size of the EV charging Adapter Market During the Forecast Period?
- The electric vehicle (EV) market in the rapidly automobile sector is experiencing significant growth, leading to an increased demand for EV charging adapters. The market is anticipated to expand steadily during the forecast period. The growth can be attributed to the increasing popularity of electric vehicles and the expansion of charging infrastructure networks. Individuals owning EVs require charging adapters for compatibility with various charging connector types, including CHAdeMO and CCS. Charging adapters offer user-friendly designs and safety features, making them essential for charging EVs in public areas, workplaces, residential complexes, highways, and individual charging stations. The improvement in charging infrastructure and diverse charging standards has led to the development of advanced charging adapters.
- The compatibility of EV charging adapters with various connector types and the convenience they offer make them an essential component of the EV ecosystem. The market is expected to witness continued growth due to the increasing number of EVs on the road and the expansion of charging infrastructure networks.
How is this EV charging Adapter Industry segmented and which is the largest segment?
The EV charging adapter industry research report provides comprehensive data (region-wise segment analysis), with forecasts and estimates in "USD million" for the period 2024-2028, as well as historical data from 2018-2022 for the following segments.
- Type
- AC
- DC
- Application
- Public
- Private
- Geography
- APAC
- China
- Japan
- Europe
- Germany
- Norway
- North America
- US
- South America
- Middle East and Africa
- APAC
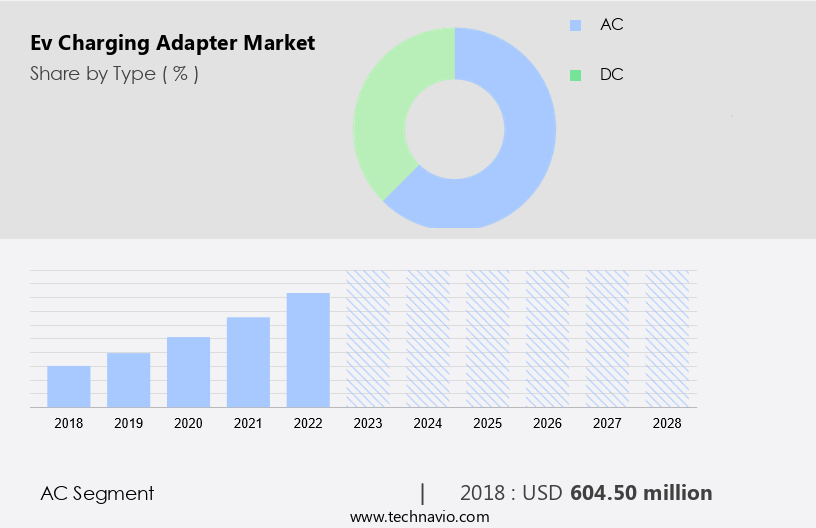
By Type Insights
- The AC segment is estimated to witness significant growth during the forecast period.
The market is witnessing significant growth due to the increasing popularity of battery electric vehicles (BEVs) and plug-in hybrid vehicles (PHEVs). These vehicles require AC charging adapters to convert alternating current (AC) into direct current (DC) for charging their battery packs. The onboard charger, an essential component of the charging system, is responsible for this conversion. The convenience of charging at home or public parking lots has made AC charging a preferred choice for many consumers. However, the diversity in charging standards poses a challenge to the market. Environmental concerns and government norms are driving the transition towards electric vehicles, leading to a growth in demand for charging adapters.
Raw material prices also impact the market dynamics. AC charging is commonly used in parking lots due to the extended duration of vehicle parking. AC chargers can require up to 22 kWh, making them suitable for longer charging periods.
Get a glance at the EV charging Adapter Industry report of share of various segments Request Free Sample
The AC segment was valued at USD 604.50 billion in 2018 and showed a gradual increase during the forecast period.
Regional Analysis
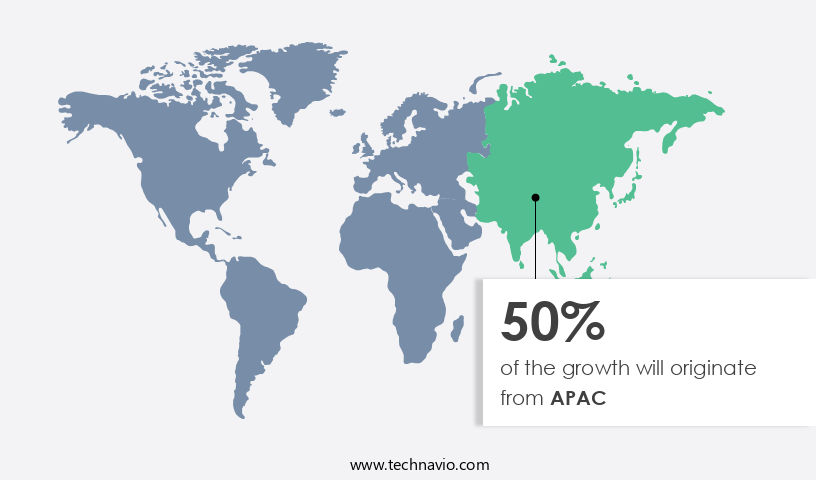
- APAC is estimated to contribute 50% to the growth of the global market during the forecast period.
Technavio's analysts have elaborately explained the regional trends and drivers that shape the market during the forecast period.
For more insights on the market share of various regions, Request Free Sample
The market In the Asia Pacific (APAC) region is experiencing significant growth due to the rising popularity of battery-electric vehicles (BEVs) and plug-in hybrid vehicles (PHEVs) in countries such as China, Japan, Singapore, India, Thailand, and South Korea. This growth can be attributed to various factors, including increasing environmental concerns, government norms, and the convenience of charging at home. Environmental concerns and government initiatives are major drivers of the market's growth. For instance, South Korea and China are taking steps to reduce greenhouse gas emissions by promoting the use of EVs and offering incentives. In 2023, South Korea revised its EV subsidy policy to favor domestic producers based on performance, infrastructure, battery density, and price.
Moreover, the diverse charging standards In the region, including CHAdeMO, CCS, and GB/T, are being addressed through collaborative efforts among stakeholders, ensuring seamless charging experiences for consumers. Additionally, raw material prices and advancements in battery technology are expected to further boost market growth. The transition to EVs and PHEVs is gaining momentum In the APAC region, and the market is poised to benefit from this trend. As the demand for EVs increases, the need for convenient and efficient charging solutions will become increasingly important.
Market Dynamics
Our researchers analyzed the data with 2023 as the base year, along with the key drivers, trends, and challenges. A holistic analysis of drivers will help companies refine their marketing strategies to gain a competitive advantage.
What are the key market drivers leading to the rise In the adoption of EV charging Adapter Industry?
Increasing EV sales through tax incentives pushing demand for well-built EV charger infrastructure is the key driver of the market.
- The Electronic Vehicle (EV) Charging Adapter Market is experiencing significant growth due to various incentives and subsidies offered by governments and regulatory bodies worldwide. In the US, the federal government provides tax credits ranging from USD2,500 to USD7,500 for new battery-electric and plug-in hybrid EVs, depending on the battery capacity.
- These incentives have made EVs more affordable and attractive to consumers, leading to increased demand for EV charging Adapters in public areas, workplaces, residential complexes, and highways. Innovation, efficiency, versatility, and safety features are key factors driving the market's growth. EV charging Adapters offer user-friendly designs, making them an essential accessory for EV owners. These adapters ensure the safe and efficient charging of EVs in various locations, providing convenience and peace of mind to users.
What are the market trends shaping the EV charging Adapter Industry?
Focus on reducing charging time is the upcoming market trend.
- The evolving charging infrastructure market In the US is witnessing significant innovation, with a focus on enhancing efficiency, versatility, and safety features in public areas, workplaces, residential complexes, and highways. For instance, Envision Solar's portable solar-powered EV charging solution, the EV ARC, is a 9/16-foot structure that combines a parking pad and solar panels, charging a 21.6-kilowatt-hour battery.
- In China, the State Grid unveiled an ultra-fast charging station at the Xiaoying Public Transit bus terminal in Beijing, which boasts Microvast's ultra-fast charging battery and can charge buses to 100% in just 10 minutes, with 25 360-kW chargers and five 90-kW chargers. These advancements underscore the industry's commitment to reducing charging time and cost, ensuring a convenient and sustainable EV charging experience.
What challenges does the EV charging Adapter Industry face during its growth?
Increasing cost pressure adversely affecting sales of AC level 2 and DC fast chargers is a key challenge affecting the industry growth.
- Safety systems, including antilock braking systems (ABS), airbags, and tire pressure monitoring systems (TPMS), have become standard offerings in both premium and entry-level segments. The adoption of these features is increasingly influencing consumer preferences and driving demand. Moreover, the development of the advanced driver assistance system (ADAS) is gaining momentum, particularly In the US and China. This technology, while still in its infancy, is poised to revolutionize vehicle safety and efficiency. As OEMs continue to innovate and improve safety features, they are likely to reap significant benefits, particularly In the entry-level and mid-variant car markets.
- Public areas, workplaces, residential complexes, and highways are all potential venues for the expansion of electric vehicle (EV) charging infrastructure. The versatility of EV charging adapters, coupled with their user-friendly designs, makes them an attractive option for both residential and commercial applications. With a focus on efficiency and sustainability, the market for EV charging adapters is expected to grow significantly In the coming years.
Exclusive Customer Landscape
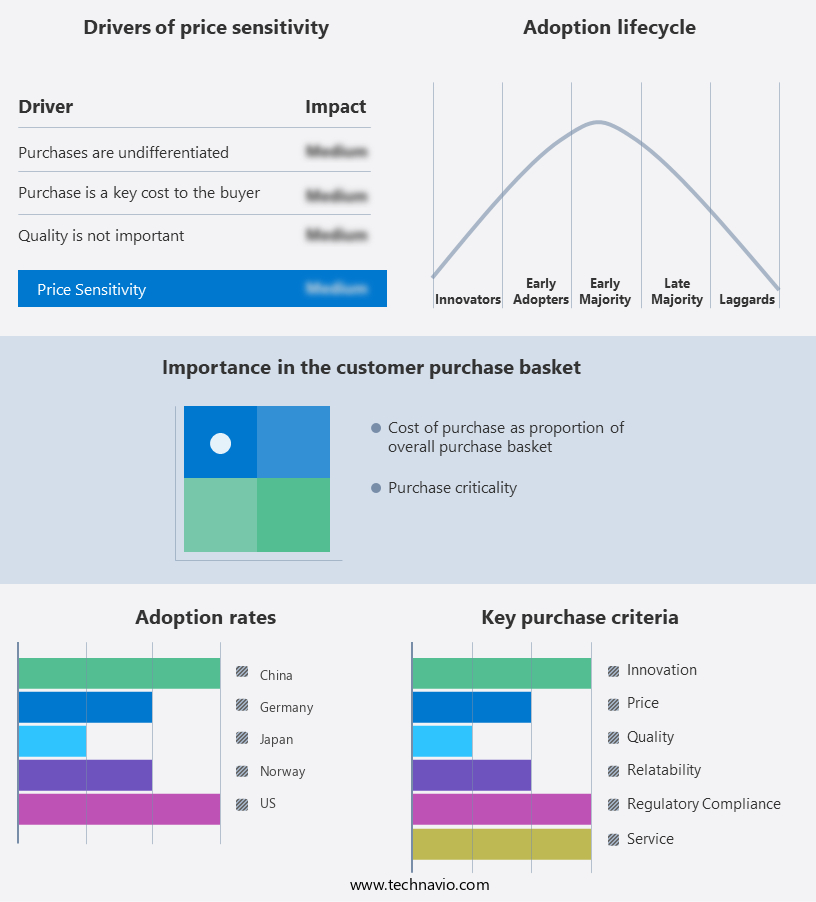
The EV charging adapter market forecasting report includes the adoption lifecycle of the market, market growth and forecasting, covering from the innovator's stage to the laggard's stage. It focuses on adoption rates in different regions based on penetration. Furthermore, the EV charging adapter market report also includes key purchase criteria and drivers of price sensitivity to help companies evaluate and develop their market growth analysis strategies.
Customer Landscape
Key Companies & Market Insights
Companies are implementing various strategies, such as strategic alliances, EV charging adapter market forecast, partnerships, mergers and acquisitions, geographical expansion, and product/service launches, to enhance their presence In the industry.
The industry research and growth report includes detailed analyses of the competitive landscape of the market and information about key companies, including:
- ABB Ltd.
- Aptiv Plc
- ChargePoint Holdings Inc.
- CHONGQING SENKU MACHINERY IMP AND EXP Co. Ltd.
- Delta Electronics Inc.
- Eaton Corp. Plc
- EDF Energy Holdings Ltd
- Enel Spa
- EV Safe Charge Inc.
- FLO Services USA Inc.
- Kempower Oy
- Lectron EV
- Leviton Manufacturing Co. Inc.
- Phihong USA Corp.
- Robert Bosch GmbH
- Schneider Electric SE
- Shanghai Mida EV Power Co. Ltd.
- Shanghai Zencar Industry Co Ltd
- Siemens AG
- Webasto SE
Qualitative and quantitative analysis of companies has been conducted to help clients understand the wider business environment as well as the strengths and weaknesses of key industry players. Data is qualitatively analyzed to categorize companies as pure play, category-focused, industry-focused, and diversified; it is quantitatively analyzed to categorize companies as dominant, leading, strong, tentative, and weak.
Research Analyst Overview
The electric vehicle (EV) market In the rapidly automobile sector is experiencing significant growth, driving the demand for EV charging adapters. The forecast period is expected to witness increased adoption of EV charging adapters due to the growing popularity of electric vehicles and the expansion of charging infrastructure networks. EV charging adapters enable compatibility with various charging connector types, including Chademo and CCS, ensuring versatility and convenience for EV owners. The improvement in charging infrastructure and the availability of individual charging stations in public areas, workplaces, residential complexes, highways, and other locations have increased the demand for EV charging adapters.
Innovation, efficiency, safety features, and user-friendly designs are key factors driving the market growth. Diverse charging standards and the transition towards zero emission vehicles, including battery-electric vehicles and plug-in hybrid vehicles like the Chevrolet Volt and Nissan Leaf, are boosting the brand value of EV charging adapter manufacturers. The availability of rebates, tax credits, and incentives, such as those offered by ChargePoint, further encourages the adoption of EV charging adapters. The installation of home EV chargers, including Level 2 home chargers with WiFi capabilities and various plug types like Nema 14-50 plug and Nema 6-50 plug, is also increasing the demand for EV charging adapters. Environmental concerns and government norms are also contributing to the market growth. However, raw material prices and diverse charging standards may pose challenges to the market.
|
Market Scope |
|
|
Report Coverage |
Details |
|
Page number |
171 |
|
Base year |
2023 |
|
Historic period |
2018-2022 |
|
Forecast period |
2024-2028 |
|
Growth momentum & CAGR |
Accelerate at a CAGR of 42.77% |
|
Market growth 2024-2028 |
USD 19.29 billion |
|
Market structure |
Fragmented |
|
YoY growth 2023-2024(%) |
31.08 |
|
Key countries |
China, US, Norway, Japan, and Germany |
|
Competitive landscape |
Leading Companies, Market Positioning of Companies, Competitive Strategies, and Industry Risks |
What are the Key Data Covered in this EV charging Adapter Market Research and Growth Report?
- CAGR of the EV charging Adapter industry during the forecast period
- Detailed information on factors that will drive the growth and forecasting between 2024 and 2028
- Precise estimation of the size of the market and its contribution of the industry in focus to the parent market
- Accurate predictions about upcoming growth and trends and changes in consumer behaviour
- Growth of the market across APAC, Europe, North America, South America, and Middle East and Africa
- Thorough analysis of the market's competitive landscape and detailed information about companies
- Comprehensive analysis of factors that will challenge the EV charging adapter market growth of industry companies
We can help! Our analysts can customize this EV charging adapter market research report to meet your requirements.
 RIA -
RIA - 
