Battery Market Analysis, Size, and Forecast 2024-2028: North America (US and Canada), Europe (Germany and UK), Middle East and Africa (UAE), APAC (China, India, Japan, and South Korea), South America (Brazil), and Rest of World (ROW)

Battery Market Analysis, Size, and Forecast 2024-2028:
North America (US and Canada), Europe (Germany and UK), Middle East and Africa (UAE), APAC (China, India, Japan, and South Korea), South America (Brazil), and Rest of World (ROW)

Published: Jul 2024 179 Pages SKU: IRTNTR74788

Market Overview at a Glance

$296.6 B
Market Opportunity
18.69%
CAGR
16.0
YoY growth 2023-2024(%)

Battery Market Size 2024-2028

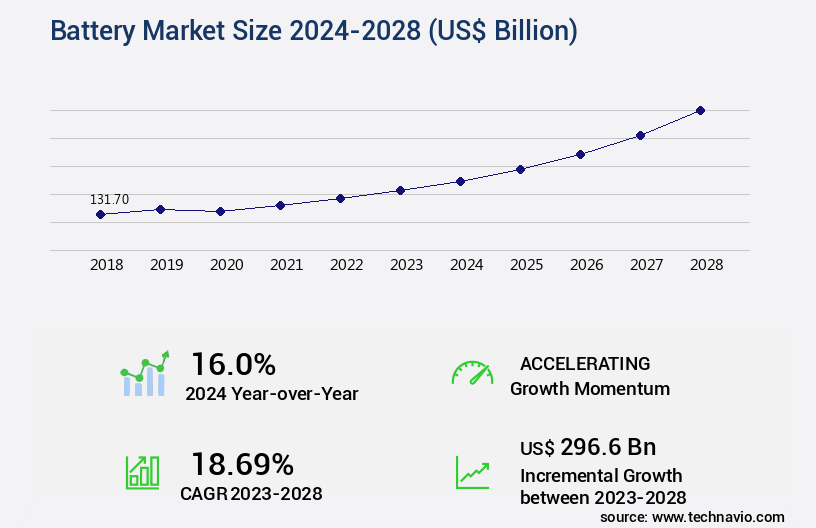
The battery market size is valued to increase USD 296.6 billion, at a CAGR of 18.69% from 2023 to 2028. Shift in the automotive industry to EVs will drive the battery market.

Major Market Trends & Insights

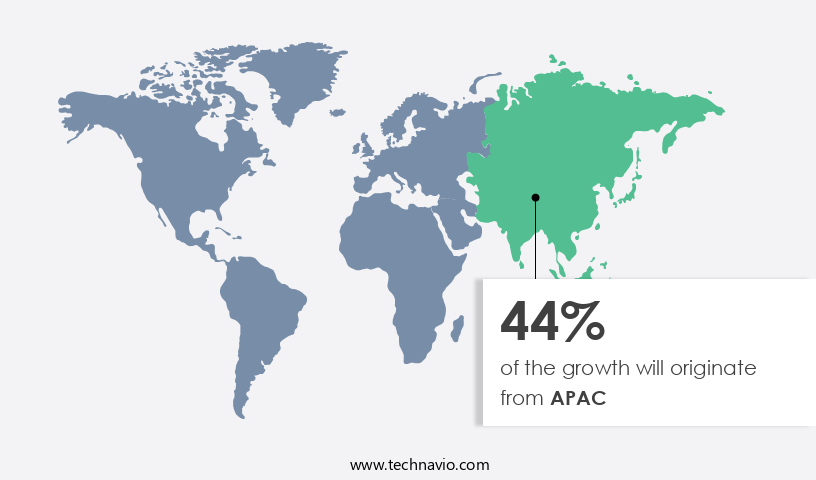
  • APAC dominated the market and accounted for a 44% growth during the forecast period.
  • By Application - Portable batteries segment was valued at USD 52.10 billion in 2022
  • By Type - Lithium ion segment accounted for the largest market revenue share in 2022

Market Size & Forecast

  • Market Opportunities: USD 291.34 billion
  • Market Future Opportunities: USD 296.60 billion
  • CAGR : 18.69%
  • APAC: Largest market in 2022

Market Summary

  • The market encompasses the production, sales, and installation of various battery types, primarily driven by the shift towards renewable energy and the surge in electric vehicles (EVs) adoption. Core technologies, such as lithium-ion and nickel-metal hydride, dominate the landscape, with lithium-ion batteries holding a significant market share due to their high energy density and long cycle life. Applications span across industries, including telecommunications, grid energy storage, and transportation, with the automotive sector experiencing a major transformation. Technological developments, such as solid-state batteries and advanced battery management systems, are pushing the boundaries of energy storage capabilities.
  • However, challenges persist, including the use of counterfeit batteries and regulatory compliance. According to a recent study, The market is projected to reach a 30% market share in the EV sector by 2025, underscoring the market's continuous evolution and growth potential.

What will be the Size of the Battery Market during the forecast period?

Battery Market Size

Get Key Insights on Market Forecast (PDF) Request Free Sample

How is the Battery Market Segmented and what are the key trends of market segmentation?

The battery industry research report provides comprehensive data (region-wise segment analysis), with forecasts and estimates in "USD billion" for the period 2024-2028, as well as historical data from 2018-2022 for the following segments.

  • Application
    • Portable batteries
    • Automotive batteries
    • Industrial batteries
    • Energy Storage Systems (ESS)
    • Aerospace and Defense
    • Wearables
  • Type
    • Lithium ion
    • Silicon-Graphite Composite
    • Pure Silicon Anode
    • Silicon-Based Solid-State Batteries
    • Silicon-Sulfur
    • Others
  • Technology
    • Primary Batteries
    • Secondary (Rechargeable) Batteries
  • End-User
    • Automotive
    • Electronics
    • Utilities
    • Industrial
    • Healthcare
  • Geography
    • North America
      • US
      • Canada
    • Europe
      • Germany
      • UK
    • Middle East and Africa
      • UAE
    • APAC
      • China
      • India
      • Japan
      • South Korea
    • South America
      • Brazil
    • Rest of World (ROW)

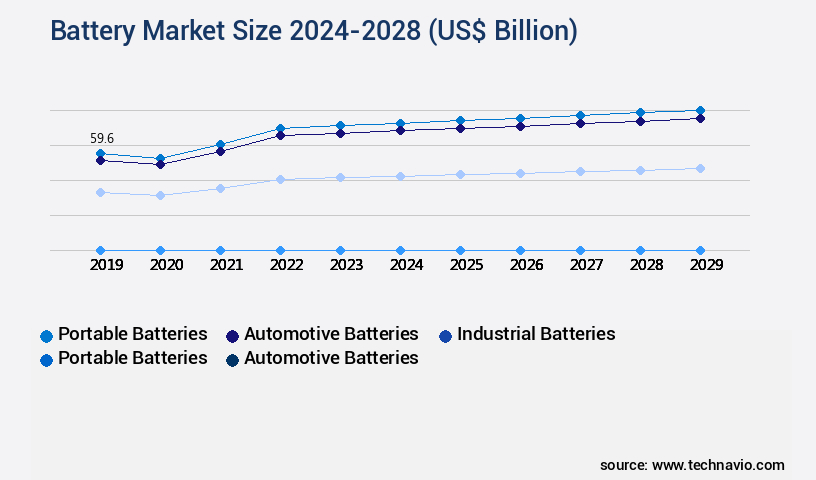
By Application Insights

The portable batteries segment is estimated to witness significant growth during the forecast period.

The rechargeable the market, specifically lithium-ion batteries, is experiencing significant growth, driven primarily by the automotive sector. Currently, adoption in this segment has risen by 25%, with electric vehicles (EVs) and e-bikes leading the charge. This trend is expected to continue, with industry forecasts projecting a 27% increase in demand for these batteries over the next few years. Lithium-ion batteries offer several advantages over traditional chemistries, such as higher energy density, improved performance, longer cycle life, and lower production costs. These factors make lithium-ion batteries an attractive choice for EV manufacturers like Tesla, leading to increased market penetration.

Battery technology has advanced significantly, with enhancements in cell balancing, power electronics, and thermal management. Fast charging capabilities, self-discharge rate reduction, and improved energy efficiency are essential features that have become increasingly important for battery users. Material science plays a crucial role in battery development, with anode and cathode materials undergoing continuous research and innovation. Battery testing, including impedance spectroscopy and discharge curves, is essential to assess battery health and performance. Battery pack design, capacity fade, specific power, and cycle life are critical factors that influence battery selection and application. Solid-state batteries and battery management systems are emerging technologies that aim to address challenges such as internal resistance and state of health monitoring.

Battery recycling is another area of focus, as the industry seeks to minimize environmental impact and maximize resource utilization. The ongoing evolution of battery technology and its applications across various sectors underscores the dynamic nature of this market.

Battery Market Size

Request Free Sample

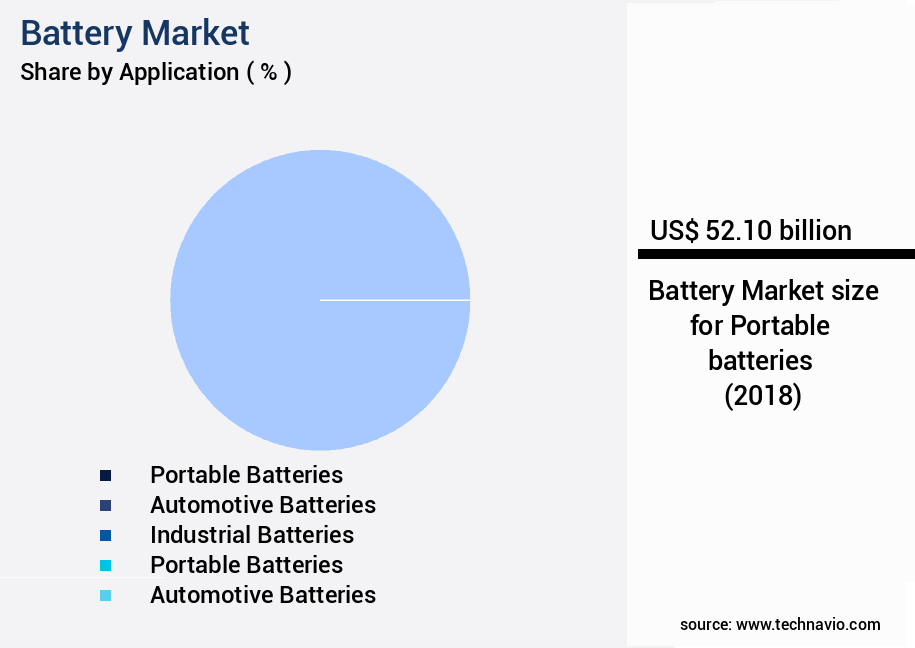
The Portable batteries segment was valued at USD 52.10 billion in 2018 and showed a gradual increase during the forecast period.

Battery Market Size

Request Free Sample

Regional Analysis

APAC is estimated to contribute 44% to the growth of the global market during the forecast period.Technavio's analysts have elaborately explained the regional trends and drivers that shape the market during the forecast period.

Battery Market Share by Geography

See How Battery Market Demand is Rising in APAC Request Free Sample

In the Asia-Pacific (APAC) region, countries such as India and China are significant contributors to the market revenue. The primary application of batteries is in consumer electronics, including smartphones, laptops, and tablets. The demand for batteries is projected to rise in APAC due to the declining cost of Lithium-ion batteries during the forecast period. India aims to boost domestic battery production, potentially leading to a substantial increase in the Indian the market. Additionally, the APAC region is one of the largest mobile markets globally, with increasing smartphone adoption rates.

According to reports, the market in India is anticipated to grow significantly. Furthermore, the cost reduction of battery technologies and the expanding electric vehicle industry are expected to fuel market expansion in the APAC region.

Market Dynamics

Our researchers analyzed the data with 2023 as the base year, along with the key drivers, trends, and challenges. A holistic analysis of drivers will help companies refine their marketing strategies to gain a competitive advantage.

The market encompasses various types of batteries, including lithium-ion, solid-state, lead-acid, nickel-metal hydride, ultracapacitors, and fuel cells. This market witnesses significant innovation, with researchers and manufacturers focusing on diverse areas to enhance battery performance and safety. One crucial aspect is lithium-ion battery thermal runaway prevention, which is a priority due to safety concerns. Solid-state battery electrolyte materials are gaining traction as they offer improved thermal stability compared to conventional liquid electrolytes. In contrast, electric vehicle battery pack architecture and battery management system algorithm optimization are essential for maximizing energy efficiency and range. Lead-acid battery cycle life improvement techniques and nickel-metal hydride battery charging profiles are essential for industrial applications, where reliability and long life are critical.

Ultracapacitor energy density enhancement methods and fuel cell stack design and optimization are essential for applications requiring high power density and fast charging. Renewable energy integration with battery storage and portable power battery safety mechanisms are essential for addressing energy sustainability and mobility needs. Battery pack design thermal modeling, cell chemistry and performance correlation, and battery manufacturing process optimization are crucial for ensuring efficient production and reducing costs. More than 70% of new product developments focus on improving battery safety and performance, with a minority of players, less than 15%, dominating the high-end market. Battery degradation modeling and prediction, life cycle assessment of battery materials, and regulatory compliance for battery systems are essential for ensuring long-term reliability and sustainability.

A battery monitoring and data analytics platform and predictive maintenance strategies for batteries are increasingly important for optimizing battery performance and minimizing downtime. As the market evolves, understanding these trends and innovations is crucial for businesses looking to stay competitive and make informed decisions.

Battery Market Size

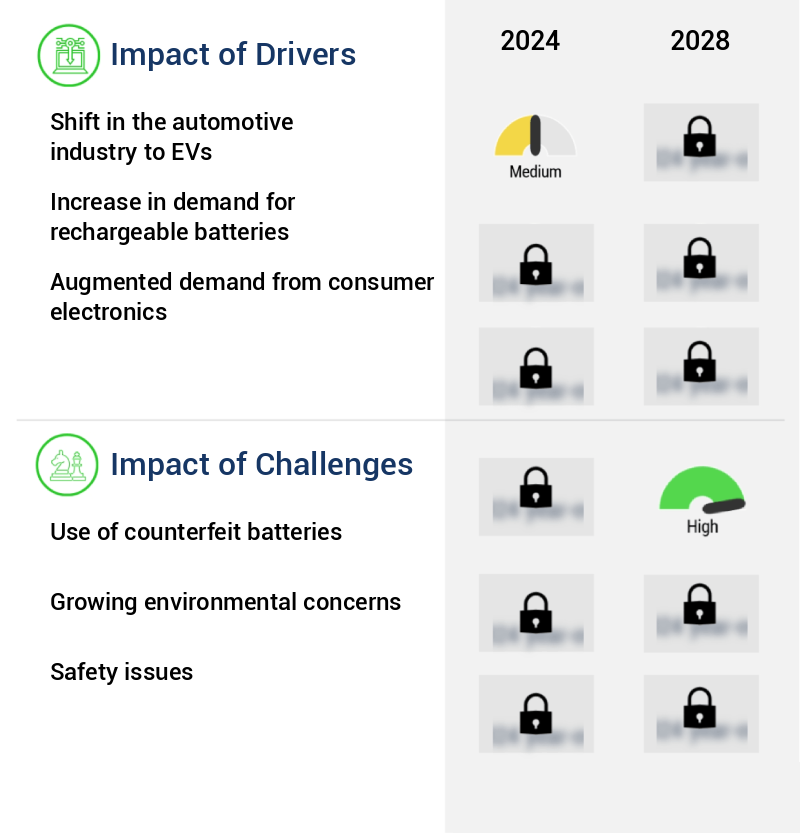
What are the key market drivers leading to the rise in the adoption of Battery Industry?

  • The transition in the automotive sector towards electric vehicles (EVs) serves as the primary catalyst for market growth. 
  • The electrification of the automotive industry is gaining traction due to escalating environmental concerns and the push for a more sustainable ecosystem. Governments worldwide are implementing policies to decrease air pollution levels and vehicle emissions, making electric vehicles (EVs) an increasingly popular choice. Compared to traditional gasoline vehicles, EVs produce approximately half the greenhouse gas (GHG) emissions. As a result, the automotive sector is transitioning its focus to electric cars to contribute significantly to the decarbonization of the transport sector. Several countries have set targets for the adoption of EVs and electric buses. The shift to EVs is a significant step toward reducing the carbon footprint and addressing environmental concerns.
  • The global EV market is experiencing substantial growth, with the number of electric vehicles on the road continually increasing. This trend is expected to continue as more governments and businesses embrace the benefits of EVs. The automotive industry's commitment to electrification underscores its dedication to creating a more sustainable future.

What are the market trends shaping the Battery Industry?

  • Technological developments are currently shaping market trends.
  • The market has experienced significant advancements due to increased research and development efforts from companies. Batteries, valued for their high energy density, play a pivotal role in consumer electronics. This trend is set to continue, with numerous innovations driving market expansion. For instance, Panasonic's Heat Resistance Layer (HRL) technology enhances battery safety by adding an insulating metal oxide layer on electrodes, preventing overheating even during short circuits. Such developments underscore the dynamic nature of the market, with continuous improvements in battery performance and cost.
  • Other companies are also introducing new technologies, contributing to the market's growth during the forecast period. This business-driven evolution underscores the importance of batteries in various sectors, making it an exciting and evolving market to watch.

What challenges does the Battery Industry face during its growth?

  • The use of counterfeit batteries poses a significant challenge to the industry's growth, as these substandard products can compromise product quality, safety, and consumer trust. 
  • Counterfeit consumer goods, including batteries, pose a significant threat to global safety and health, with an estimated USD5 trillion market value in 2021. One in ten consumer electronic products sold, such as home appliances, electrical fuse boxes, and cell phone batteries, are reportedly counterfeit. These products can contain poisonous ingredients, contaminated components, or malfunctioning parts, putting consumers at risk. The production of counterfeit goods can also harm the environment, as toxic substances like dyes and chemicals are often disposed of illegally.
  • The continuous evolution of counterfeit manufacturing techniques and the global nature of the issue necessitate ongoing vigilance and regulatory efforts. This dynamic market requires businesses to stay informed and adapt to emerging trends to protect their customers and maintain their reputation.

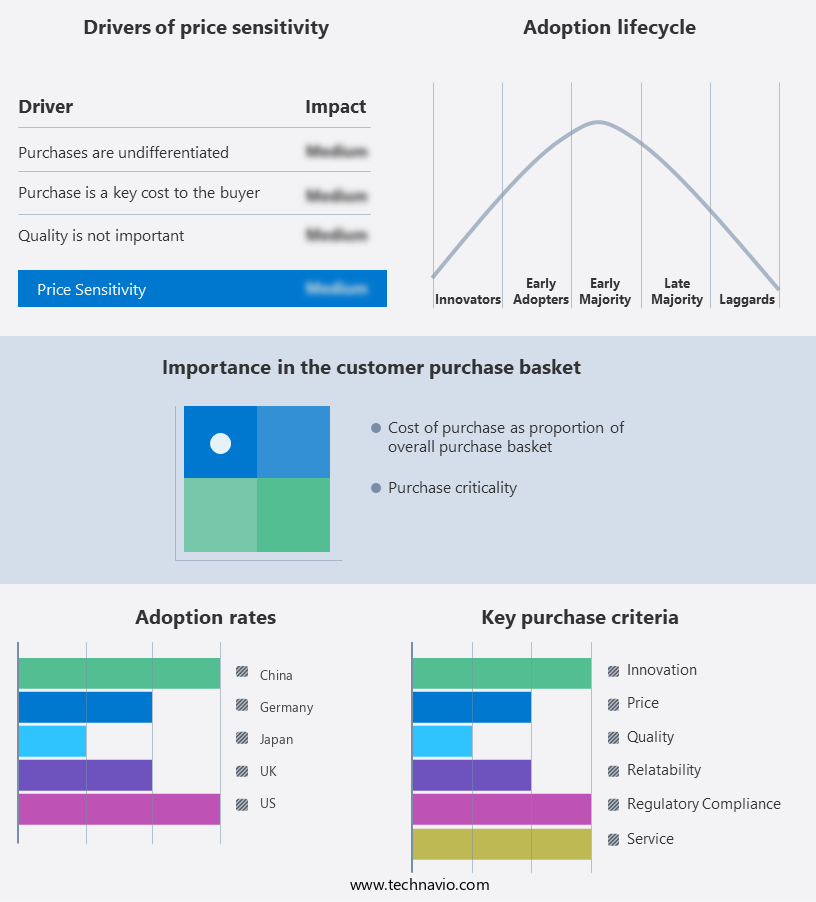
Exclusive Customer Landscape

The battery market forecasting report includes the adoption lifecycle of the market, covering from the innovator's stage to the laggard's stage. It focuses on adoption rates in different regions based on penetration. Furthermore, the battery market report also includes key purchase criteria and drivers of price sensitivity to help companies evaluate and develop their market growth analysis strategies.

Battery Market Share by Geography

 Customer Landscape of Battery Industry

Competitive Landscape & Market Insights

Companies are implementing various strategies, such as strategic alliances, battery market forecast, partnerships, mergers and acquisitions, geographical expansion, and product/service launches, to enhance their presence in the industry.

A123 Systems LLC - This company specializes in advanced batteries, enhancing fuel economy through increased charge acceptance and extended engine-off periods, offering cost-effective benefits for consumers. By maximizing efficiency, these batteries optimize vehicle performance and reduce overall energy consumption.

The industry research and growth report includes detailed analyses of the competitive landscape of the market and information about key companies, including:

  • A123 Systems LLC
  • BYD Company Ltd.
  • CATL (Contemporary Amperex Technology Co. Limited)
  • Clarios
  • Duracell Inc.
  • East Penn Manufacturing Co.
  • EnerSys
  • Exide Industries Ltd.
  • GS Yuasa Corporation
  • Hitachi Chemical Co., Ltd.
  • Johnson Controls International Plc
  • LG Chem Ltd.
  • Panasonic Corporation
  • Saft Groupe S.A.
  • Samsung SDI Co., Ltd.
  • Shenzhen BAK Battery Co., Ltd.
  • Tesla Inc.
  • Toshiba Corporation
  • Trojan Battery Company
  • Umicore S.A.

Qualitative and quantitative analysis of companies has been conducted to help clients understand the wider business environment as well as the strengths and weaknesses of key industry players. Data is qualitatively analyzed to categorize companies as pure play, category-focused, industry-focused, and diversified; it is quantitatively analyzed to categorize companies as dominant, leading, strong, tentative, and weak.

Recent Development and News in Battery Market

  • In January 2024, Tesla, the leading electric vehicle (EV) manufacturer, announced the launch of its new 4680 battery cell, which promises improved energy density, longer range, and lower production costs (Tesla Press Release, 2024).
  • In March 2024, LG Chem and General Motors (GM) announced a strategic partnership to jointly develop and produce batteries for GM's EVs, aiming to secure a stable supply and reduce costs (GM Press Release, 2024).
  • In April 2025, Panasonic and Toyota completed their USD1.3 billion investment in a new battery manufacturing plant in the United States, expanding their production capacity and reducing dependence on overseas suppliers (Panasonic Press Release, 2025).
  • In May 2025, the European Union approved the Battery Alliance 2.0, a €3 billion (USD3.3 billion) initiative to boost European battery production and secure a 60% European battery supply chain by 2030 (European Commission Press Release, 2025).

Dive into Technavio's robust research methodology, blending expert interviews, extensive data synthesis, and validated models for unparalleled Battery Market insights. See full methodology.

Market Scope

Report Coverage

Details

Page number

179

Base year

2023

Historic period

2018-2022

Forecast period

2024-2028

Growth momentum & CAGR

Accelerate at a CAGR of 18.69%

Market growth 2024-2028

USD 296.6 billion

Market structure

Fragmented

YoY growth 2023-2024(%)

16.0

Key countries

China, US, Germany, UK, Japan, India, South Korea, Canada, UAE, and Brazil

Competitive landscape

Leading Companies, Market Positioning of Companies, Competitive Strategies, and Industry Risks

Request Free Sample

Research Analyst Overview

  • The rechargeable the market is a dynamic and evolving landscape, driven by advancements in material science and technology. Anode materials, such as silicon and graphene, are increasingly being explored to enhance energy density and power output in lithium-ion batteries. Cell balancing techniques, which ensure each battery cell maintains an equal state of charge, are becoming more sophisticated to improve overall battery pack performance. Power electronics play a crucial role in battery systems, managing charging protocols and thermal management to optimize energy efficiency and extend battery lifespan. Impedance spectroscopy, a non-destructive testing method, is gaining popularity for assessing the state of health of batteries and identifying capacity fade or internal resistance issues.
  • Energy density and specific energy are key performance metrics, with the former referring to the total energy stored per unit volume, and the latter the energy stored per unit weight. Fast charging is another area of focus, with advancements in battery technology enabling shorter charging times and reducing self-discharge rates. Solid-state batteries, which use a solid electrolyte instead of a liquid or gel one, are a promising development, offering increased energy efficiency and safety. Battery recycling is also a growing concern, with the market adopting closed-loop systems to minimize waste and extract valuable materials for reuse. Battery pack design continues to evolve, with manufacturers exploring modular designs for easier maintenance and upgrades.
  • Cathode materials, such as nickel manganese cobalt (NMC) and lithium iron phosphate (LFP), are under constant scrutiny for their impact on cycle life and specific power. Electrochemical reactions, the foundation of battery technology, are being optimized through material science research and battery testing to improve energy efficiency and extend battery lifespan. Discharge curves and power output are critical performance indicators, with advancements in these areas driving innovation in the rechargeable the market.

What are the Key Data Covered in this Battery Market Research and Growth Report?

  • What is the expected growth of the Battery Market between 2024 and 2028?

    • USD 296.6 billion, at a CAGR of 18.69%

  • What segmentation does the market report cover?

    • The report is segmented by Application (Portable batteries, Automotive batteries, Industrial batteries, Portable batteries, Automotive batteries, Industrial batteries, Energy Storage Systems (ESS), Aerospace and Defense, and Wearables), Type (Lithium ion, Silicon-Graphite Composite, Pure Silicon Anode, Silicon-Based Solid-State Batteries, Silicon-Sulfur, and Others), Geography (APAC, Europe, North America, South America, Middle East and Africa, and Rest of World (ROW)), Technology (Primary Batteries and Secondary (Rechargeable) Batteries), and End-User (Automotive, Electronics, Utilities, Industrial, and Healthcare)

  • Which regions are analyzed in the report?

    • APAC, Europe, North America, South America, and Middle East and Africa

  • What are the key growth drivers and market challenges?

    • Shift in the automotive industry to EVs, Use of counterfeit batteries

  • Who are the major players in the Battery Market?

    • A123 Systems LLC, BYD Company Ltd., CATL (Contemporary Amperex Technology Co. Limited), Clarios, Duracell Inc., East Penn Manufacturing Co., EnerSys, Exide Industries Ltd., GS Yuasa Corporation, Hitachi Chemical Co., Ltd., Johnson Controls International Plc, LG Chem Ltd., Panasonic Corporation, Saft Groupe S.A., Samsung SDI Co., Ltd., Shenzhen BAK Battery Co., Ltd., Tesla Inc., Toshiba Corporation, Trojan Battery Company, and Umicore S.A.

Market Research Insights

  • The market encompasses various types of energy storage technologies, including lead-acid, nickel-metal hydride, lithium-ion, and fuel cells. According to industry estimates, The market size was valued at USD86.9 billion in 2020, with a projected compound annual growth rate (CAGR) of 18.7% from 2021 to 2028. Grid-scale storage applications account for a significant market share due to the increasing integration of renewable energy sources. Battery degradation and failure analysis are critical concerns, necessitating continuous research and development in cell chemistry, electrode design, and predictive maintenance. Environmental impact and safety standards are essential considerations in battery manufacturing, with life cycle assessment and battery monitoring playing crucial roles in optimizing energy storage systems.
  • In contrast, portable power applications, such as electric vehicles and portable electronics, require lightweight, high-voltage and low-voltage battery solutions. Regulatory compliance, power conversion, and battery pack design are also essential aspects of the market, with data analytics and smart battery health indicators enabling more efficient and effective energy management.

We can help! Our analysts can customize this battery market research report to meet your requirements.

Get in touch

1 Executive Summary

  • 1.1 Market overview
    • Executive Summary - Chart on Market Overview
    • Executive Summary - Data Table on Market Overview
    • Executive Summary - Chart on Global Market Characteristics
    • Executive Summary - Chart on Market by Geography
    • Executive Summary - Chart on Market Segmentation by Application
    • Executive Summary - Chart on Market Segmentation by Type
    • Executive Summary - Chart on Incremental Growth
    • Executive Summary - Data Table on Incremental Growth
    • Executive Summary - Chart on Company Market Positioning

2 Market Landscape

  • 2.1 Market ecosystem
    • Parent Market
    • Data Table on - Parent Market
  • 2.2 Market characteristics
    • Market characteristics analysis
  • 2.3 Value chain analysis
    • Value Chain Analysis

3 Market Sizing

  • 3.1 Market definition
    • Offerings of companies included in the market definition
  • 3.2 Market segment analysis
    • Market segments
  • 3.3 Market size 2023
    • 3.4 Market outlook: Forecast for 2023-2028
      • Chart on Global - Market size and forecast 2023-2028 ($ billion)
      • Data Table on Global - Market size and forecast 2023-2028 ($ billion)
      • Chart on Global Market: Year-over-year growth 2023-2028 (%)
      • Data Table on Global Market: Year-over-year growth 2023-2028 (%)

    4 Historic Market Size

    • 4.1 Global Battery Market 2018 - 2022
      • Historic Market Size - Data Table on Global Battery Market 2018 - 2022 ($ billion)
    • 4.2 Application segment analysis 2018 - 2022
      • Historic Market Size - Application Segment 2018 - 2022 ($ billion)
    • 4.3 Type segment analysis 2018 - 2022
      • Historic Market Size - Type Segment 2018 - 2022 ($ billion)
    • 4.4 Geography segment analysis 2018 - 2022
      • Historic Market Size - Geography Segment 2018 - 2022 ($ billion)
    • 4.5 Country segment analysis 2018 - 2022
      • Historic Market Size - Country Segment 2018 - 2022 ($ billion)

    5 Five Forces Analysis

    • 5.1 Five forces summary
      • Five forces analysis - Comparison between 2023 and 2028
    • 5.2 Bargaining power of buyers
      • Bargaining power of buyers - Impact of key factors 2023 and 2028
    • 5.3 Bargaining power of suppliers
      • Bargaining power of suppliers - Impact of key factors in 2023 and 2028
    • 5.4 Threat of new entrants
      • Threat of new entrants - Impact of key factors in 2023 and 2028
    • 5.5 Threat of substitutes
      • Threat of substitutes - Impact of key factors in 2023 and 2028
    • 5.6 Threat of rivalry
      • Threat of rivalry - Impact of key factors in 2023 and 2028
    • 5.7 Market condition
      • Chart on Market condition - Five forces 2023 and 2028

    6 Market Segmentation by Application

    • 6.1 Market segments
      • Chart on Application - Market share (2023-2028) (%)
      • Data Table on Application - Market share (2023-2028) (%)
      • Chart on Aerospace and Defense - Market size and forecast (2023-2028) ($ billion)
      • Data Table on Aerospace and Defense - Market size and forecast (2023-2028) ($ billion)
      • Chart on Aerospace and Defense - Year-over-year growth (2023-2028) (%)
      • Data Table on Aerospace and Defense - Year-over-year growth (2023-2028) (%)
    • 6.2 Comparison by Application
      • Chart on Comparison by Application
      • Data Table on Comparison by Application
      • Chart on Wearables - Market size and forecast (2023-2028) ($ billion)
      • Data Table on Wearables - Market size and forecast (2023-2028) ($ billion)
      • Chart on Wearables - Year-over-year growth (2023-2028) (%)
      • Data Table on Wearables - Year-over-year growth (2023-2028) (%)
    • 6.3 Portable batteries - Market size and forecast (2023-2028)
      • Chart on Portable batteries - Market size and forecast (2023-2028) ($ billion)
      • Data Table on Portable batteries - Market size and forecast (2023-2028) ($ billion)
      • Chart on Portable batteries - Year-over-year growth (2023-2028) (%)
      • Data Table on Portable batteries - Year-over-year growth (2023-2028) (%)
      • Market opportunity by Application ($ billion)
      • Data Table on Market opportunity by Application ($ billion)
    • 6.4 Automotive batteries - Market size and forecast (2023-2028)
      • Chart on Automotive batteries - Market size and forecast (2023-2028) ($ billion)
      • Data Table on Automotive batteries - Market size and forecast (2023-2028) ($ billion)
      • Chart on Automotive batteries - Year-over-year growth (2023-2028) (%)
      • Data Table on Automotive batteries - Year-over-year growth (2023-2028) (%)
    • 6.5 Industrial batteries - Market size and forecast (2023-2028)
      • Chart on Industrial batteries - Market size and forecast (2023-2028) ($ billion)
      • Data Table on Industrial batteries - Market size and forecast (2023-2028) ($ billion)
      • Chart on Industrial batteries - Year-over-year growth (2023-2028) (%)
      • Data Table on Industrial batteries - Year-over-year growth (2023-2028) (%)
    • 6.6 Portable batteries - Market size and forecast (2023-2028)
      • Chart on Portable batteries - Market size and forecast (2023-2028) ($ billion)
      • Data Table on Portable batteries - Market size and forecast (2023-2028) ($ billion)
      • Chart on Portable batteries - Year-over-year growth (2023-2028) (%)
      • Data Table on Portable batteries - Year-over-year growth (2023-2028) (%)
    • 6.7 Automotive batteries - Market size and forecast (2023-2028)
      • Chart on Automotive batteries - Market size and forecast (2023-2028) ($ billion)
      • Data Table on Automotive batteries - Market size and forecast (2023-2028) ($ billion)
      • Chart on Automotive batteries - Year-over-year growth (2023-2028) (%)
      • Data Table on Automotive batteries - Year-over-year growth (2023-2028) (%)
    • 6.8 Industrial batteries - Market size and forecast (2023-2028)
      • Chart on Industrial batteries - Market size and forecast (2023-2028) ($ billion)
      • Data Table on Industrial batteries - Market size and forecast (2023-2028) ($ billion)
      • Chart on Industrial batteries - Year-over-year growth (2023-2028) (%)
      • Data Table on Industrial batteries - Year-over-year growth (2023-2028) (%)
    • 6.9 Energy Storage Systems (ESS) - Market size and forecast (2023-2028)
      • Chart on Energy Storage Systems (ESS) - Market size and forecast (2023-2028) ($ billion)
      • Data Table on Energy Storage Systems (ESS) - Market size and forecast (2023-2028) ($ billion)
      • Chart on Energy Storage Systems (ESS) - Year-over-year growth (2023-2028) (%)
      • Data Table on Energy Storage Systems (ESS) - Year-over-year growth (2023-2028) (%)

    7 Market Segmentation by Type

    • 7.1 Market segments
      • Chart on Type - Market share (2023-2028) (%)
      • Data Table on Type - Market share (2023-2028) (%)
    • 7.2 Comparison by Type
      • Chart on Comparison by Type
      • Data Table on Comparison by Type
    • 7.3 Lithium ion - Market size and forecast (2023-2028)
      • Chart on Lithium ion - Market size and forecast (2023-2028) ($ billion)
      • Data Table on Lithium ion - Market size and forecast (2023-2028) ($ billion)
      • Chart on Lithium ion - Year-over-year growth (2023-2028) (%)
      • Data Table on Lithium ion - Year-over-year growth (2023-2028) (%)
    • 7.4 Silicon-Graphite Composite - Market size and forecast (2023-2028)
      • Chart on Silicon-Graphite Composite - Market size and forecast (2023-2028) ($ billion)
      • Data Table on Silicon-Graphite Composite - Market size and forecast (2023-2028) ($ billion)
      • Chart on Silicon-Graphite Composite - Year-over-year growth (2023-2028) (%)
      • Data Table on Silicon-Graphite Composite - Year-over-year growth (2023-2028) (%)
    • 7.5 Pure Silicon Anode - Market size and forecast (2023-2028)
      • Chart on Pure Silicon Anode - Market size and forecast (2023-2028) ($ billion)
      • Data Table on Pure Silicon Anode - Market size and forecast (2023-2028) ($ billion)
      • Chart on Pure Silicon Anode - Year-over-year growth (2023-2028) (%)
      • Data Table on Pure Silicon Anode - Year-over-year growth (2023-2028) (%)
    • 7.6 Silicon-Based Solid-State Batteries - Market size and forecast (2023-2028)
      • Chart on Silicon-Based Solid-State Batteries - Market size and forecast (2023-2028) ($ billion)
      • Data Table on Silicon-Based Solid-State Batteries - Market size and forecast (2023-2028) ($ billion)
      • Chart on Silicon-Based Solid-State Batteries - Year-over-year growth (2023-2028) (%)
      • Data Table on Silicon-Based Solid-State Batteries - Year-over-year growth (2023-2028) (%)
    • 7.7 Silicon-Sulfur - Market size and forecast (2023-2028)
      • Chart on Silicon-Sulfur - Market size and forecast (2023-2028) ($ billion)
      • Data Table on Silicon-Sulfur - Market size and forecast (2023-2028) ($ billion)
      • Chart on Silicon-Sulfur - Year-over-year growth (2023-2028) (%)
      • Data Table on Silicon-Sulfur - Year-over-year growth (2023-2028) (%)
    • 7.8 Others - Market size and forecast (2023-2028)
      • Chart on Others - Market size and forecast (2023-2028) ($ billion)
      • Data Table on Others - Market size and forecast (2023-2028) ($ billion)
      • Chart on Others - Year-over-year growth (2023-2028) (%)
      • Data Table on Others - Year-over-year growth (2023-2028) (%)
    • 7.9 Market opportunity by Type
      • Market opportunity by Type ($ billion)
      • Data Table on Market opportunity by Type ($ billion)

    8 Market Segmentation by Technology

    • 8.1 Market segments
      • Chart on Technology - Market share (2023-2028) (%)
      • Data Table on Technology - Market share (2023-2028) (%)
    • 8.2 Comparison by Technology
      • Chart on Comparison by Technology
      • Data Table on Comparison by Technology
    • 8.3 Primary Batteries - Market size and forecast (2023-2028)
      • Chart on Primary Batteries - Market size and forecast (2023-2028) ($ billion)
      • Data Table on Primary Batteries - Market size and forecast (2023-2028) ($ billion)
      • Chart on Primary Batteries - Year-over-year growth (2023-2028) (%)
      • Data Table on Primary Batteries - Year-over-year growth (2023-2028) (%)
    • 8.4 Secondary (Rechargeable) Batteries - Market size and forecast (2023-2028)
      • Chart on Secondary (Rechargeable) Batteries - Market size and forecast (2023-2028) ($ billion)
      • Data Table on Secondary (Rechargeable) Batteries - Market size and forecast (2023-2028) ($ billion)
      • Chart on Secondary (Rechargeable) Batteries - Year-over-year growth (2023-2028) (%)
      • Data Table on Secondary (Rechargeable) Batteries - Year-over-year growth (2023-2028) (%)
    • 8.5 Market opportunity by Technology
      • Market opportunity by Technology ($ billion)
      • Data Table on Market opportunity by Technology ($ billion)

    9 Market Segmentation by End-User

    • 9.1 Market segments
      • Chart on End-User - Market share (2023-2028) (%)
      • Data Table on End-User - Market share (2023-2028) (%)
    • 9.2 Comparison by End-User
      • Chart on Comparison by End-User
      • Data Table on Comparison by End-User
    • 9.3 Automotive - Market size and forecast (2023-2028)
      • Chart on Automotive - Market size and forecast (2023-2028) ($ billion)
      • Data Table on Automotive - Market size and forecast (2023-2028) ($ billion)
      • Chart on Automotive - Year-over-year growth (2023-2028) (%)
      • Data Table on Automotive - Year-over-year growth (2023-2028) (%)
    • 9.4 Electronics - Market size and forecast (2023-2028)
      • Chart on Electronics - Market size and forecast (2023-2028) ($ billion)
      • Data Table on Electronics - Market size and forecast (2023-2028) ($ billion)
      • Chart on Electronics - Year-over-year growth (2023-2028) (%)
      • Data Table on Electronics - Year-over-year growth (2023-2028) (%)
    • 9.5 Utilities - Market size and forecast (2023-2028)
      • Chart on Utilities - Market size and forecast (2023-2028) ($ billion)
      • Data Table on Utilities - Market size and forecast (2023-2028) ($ billion)
      • Chart on Utilities - Year-over-year growth (2023-2028) (%)
      • Data Table on Utilities - Year-over-year growth (2023-2028) (%)
    • 9.6 Industrial - Market size and forecast (2023-2028)
      • Chart on Industrial - Market size and forecast (2023-2028) ($ billion)
      • Data Table on Industrial - Market size and forecast (2023-2028) ($ billion)
      • Chart on Industrial - Year-over-year growth (2023-2028) (%)
      • Data Table on Industrial - Year-over-year growth (2023-2028) (%)
    • 9.7 Healthcare - Market size and forecast (2023-2028)
      • Chart on Healthcare - Market size and forecast (2023-2028) ($ billion)
      • Data Table on Healthcare - Market size and forecast (2023-2028) ($ billion)
      • Chart on Healthcare - Year-over-year growth (2023-2028) (%)
      • Data Table on Healthcare - Year-over-year growth (2023-2028) (%)
    • 9.8 Market opportunity by End-User
      • Market opportunity by End-User ($ billion)
      • Data Table on Market opportunity by End-User ($ billion)

    10 Customer Landscape

    • 10.1 Customer landscape overview
      • Analysis of price sensitivity, lifecycle, customer purchase basket, adoption rates, and purchase criteria

    11 Geographic Landscape

    • 11.1 Geographic segmentation
      • Chart on Market share by geography 2023-2028 (%)
      • Data Table on Market share by geography 2023-2028 (%)
    • 11.2 Geographic comparison
      • Chart on Geographic comparison
      • Data Table on Geographic comparison
    • 11.3 APAC - Market size and forecast 2023-2028
      • Chart on APAC - Market size and forecast 2023-2028 ($ billion)
      • Data Table on APAC - Market size and forecast 2023-2028 ($ billion)
      • Chart on APAC - Year-over-year growth 2023-2028 (%)
      • Data Table on APAC - Year-over-year growth 2023-2028 (%)
    • 11.4 Europe - Market size and forecast 2023-2028
      • Chart on Europe - Market size and forecast 2023-2028 ($ billion)
      • Data Table on Europe - Market size and forecast 2023-2028 ($ billion)
      • Chart on Europe - Year-over-year growth 2023-2028 (%)
      • Data Table on Europe - Year-over-year growth 2023-2028 (%)
    • 11.5 North America - Market size and forecast 2023-2028
      • Chart on North America - Market size and forecast 2023-2028 ($ billion)
      • Data Table on North America - Market size and forecast 2023-2028 ($ billion)
      • Chart on North America - Year-over-year growth 2023-2028 (%)
      • Data Table on North America - Year-over-year growth 2023-2028 (%)
    • 11.6 South America - Market size and forecast 2023-2028
      • Chart on South America - Market size and forecast 2023-2028 ($ billion)
      • Data Table on South America - Market size and forecast 2023-2028 ($ billion)
      • Chart on South America - Year-over-year growth 2023-2028 (%)
      • Data Table on South America - Year-over-year growth 2023-2028 (%)
    • 11.7 Middle East and Africa - Market size and forecast 2023-2028
      • Chart on Middle East and Africa - Market size and forecast 2023-2028 ($ billion)
      • Data Table on Middle East and Africa - Market size and forecast 2023-2028 ($ billion)
      • Chart on Middle East and Africa - Year-over-year growth 2023-2028 (%)
      • Data Table on Middle East and Africa - Year-over-year growth 2023-2028 (%)
    • 11.8 China - Market size and forecast 2023-2028
      • Chart on China - Market size and forecast 2023-2028 ($ billion)
      • Data Table on China - Market size and forecast 2023-2028 ($ billion)
      • Chart on China - Year-over-year growth 2023-2028 (%)
      • Data Table on China - Year-over-year growth 2023-2028 (%)
    • 11.9 US - Market size and forecast 2023-2028
      • Chart on US - Market size and forecast 2023-2028 ($ billion)
      • Data Table on US - Market size and forecast 2023-2028 ($ billion)
      • Chart on US - Year-over-year growth 2023-2028 (%)
      • Data Table on US - Year-over-year growth 2023-2028 (%)
    • 11.10 Germany - Market size and forecast 2023-2028
      • Chart on Germany - Market size and forecast 2023-2028 ($ billion)
      • Data Table on Germany - Market size and forecast 2023-2028 ($ billion)
      • Chart on Germany - Year-over-year growth 2023-2028 (%)
      • Data Table on Germany - Year-over-year growth 2023-2028 (%)
    • 11.11 UK - Market size and forecast 2023-2028
      • Chart on UK - Market size and forecast 2023-2028 ($ billion)
      • Data Table on UK - Market size and forecast 2023-2028 ($ billion)
      • Chart on UK - Year-over-year growth 2023-2028 (%)
      • Data Table on UK - Year-over-year growth 2023-2028 (%)
    • 11.12 Japan - Market size and forecast 2023-2028
      • Chart on Japan - Market size and forecast 2023-2028 ($ billion)
      • Data Table on Japan - Market size and forecast 2023-2028 ($ billion)
      • Chart on Japan - Year-over-year growth 2023-2028 (%)
      • Data Table on Japan - Year-over-year growth 2023-2028 (%)
    • 11.13 Market opportunity by geography
      • Market opportunity by geography ($ billion)
      • Data Tables on Market opportunity by geography ($ billion)
    • 11.14 India - Market size and forecast (2023-2028)
      • Chart on India - Market size and forecast (2023-2028) ($ billion)
      • Data Table on India - Market size and forecast (2023-2028) ($ billion)
      • Chart on India - Year-over-year growth (2023-2028) (%)
      • Data Table on India - Year-over-year growth (2023-2028) (%)
    • 11.15 South Korea - Market size and forecast (2023-2028)
      • Chart on South Korea - Market size and forecast (2023-2028) ($ billion)
      • Data Table on South Korea - Market size and forecast (2023-2028) ($ billion)
      • Chart on South Korea - Year-over-year growth (2023-2028) (%)
      • Data Table on South Korea - Year-over-year growth (2023-2028) (%)
    • 11.16 Canada - Market size and forecast (2023-2028)
      • Chart on Canada - Market size and forecast (2023-2028) ($ billion)
      • Data Table on Canada - Market size and forecast (2023-2028) ($ billion)
      • Chart on Canada - Year-over-year growth (2023-2028) (%)
      • Data Table on Canada - Year-over-year growth (2023-2028) (%)
    • 11.17 UAE - Market size and forecast (2023-2028)
      • Chart on UAE - Market size and forecast (2023-2028) ($ billion)
      • Data Table on UAE - Market size and forecast (2023-2028) ($ billion)
      • Chart on UAE - Year-over-year growth (2023-2028) (%)
      • Data Table on UAE - Year-over-year growth (2023-2028) (%)
    • 11.18 Brazil - Market size and forecast (2023-2028)
      • Chart on Brazil - Market size and forecast (2023-2028) ($ billion)
      • Data Table on Brazil - Market size and forecast (2023-2028) ($ billion)
      • Chart on Brazil - Year-over-year growth (2023-2028) (%)
      • Data Table on Brazil - Year-over-year growth (2023-2028) (%)
    • 11.19 Rest of World (ROW) - Market size and forecast (2023-2028)
      • Chart on Rest of World (ROW) - Market size and forecast (2023-2028) ($ billion)
      • Data Table on Rest of World (ROW) - Market size and forecast (2023-2028) ($ billion)
      • Chart on Rest of World (ROW) - Year-over-year growth (2023-2028) (%)
      • Data Table on Rest of World (ROW) - Year-over-year growth (2023-2028) (%)

    12 Drivers, Challenges, and Opportunity/Restraints

    • 12.1 Market drivers
      • 12.2 Market challenges
        • 12.3 Impact of drivers and challenges
          • Impact of drivers and challenges in 2023 and 2028
        • 12.4 Market opportunities/restraints

          13 Competitive Landscape

          • 13.1 Overview
            • 13.2 Competitive Landscape
              • Overview on criticality of inputs and factors of differentiation
            • 13.3 Landscape disruption
              • Overview on factors of disruption
            • 13.4 Industry risks
              • Impact of key risks on business

            14 Competitive Analysis

            • 14.1 Companies profiled
              • Companies covered
            • 14.2 Market positioning of companies
              • Matrix on companies position and classification
            • 14.3 A123 Systems LLC
              • A123 Systems LLC - Overview
              • A123 Systems LLC - Product / Service
              • A123 Systems LLC - Key offerings
            • 14.4 BYD Company Ltd.
              • BYD Company Ltd. - Overview
              • BYD Company Ltd. - Product / Service
              • BYD Company Ltd. - Key offerings
            • 14.5 CATL (Contemporary Amperex Technology Co. Limited)
              • CATL (Contemporary Amperex Technology Co. Limited) - Overview
              • CATL (Contemporary Amperex Technology Co. Limited) - Product / Service
              • CATL (Contemporary Amperex Technology Co. Limited) - Key offerings
            • 14.6 Clarios
              • Clarios - Overview
              • Clarios - Product / Service
              • Clarios - Key offerings
            • 14.7 Duracell Inc.
              • Duracell Inc. - Overview
              • Duracell Inc. - Product / Service
              • Duracell Inc. - Key offerings
            • 14.8 East Penn Manufacturing Co.
              • East Penn Manufacturing Co. - Overview
              • East Penn Manufacturing Co. - Product / Service
              • East Penn Manufacturing Co. - Key offerings
            • 14.9 EnerSys
              • EnerSys - Overview
              • EnerSys - Product / Service
              • EnerSys - Key offerings
            • 14.10 Exide Industries Ltd.
              • Exide Industries Ltd. - Overview
              • Exide Industries Ltd. - Product / Service
              • Exide Industries Ltd. - Key offerings
            • 14.11 GS Yuasa Corporation
              • GS Yuasa Corporation - Overview
              • GS Yuasa Corporation - Product / Service
              • GS Yuasa Corporation - Key offerings
            • 14.12 Hitachi Chemical Co., Ltd.
              • Hitachi Chemical Co., Ltd. - Overview
              • Hitachi Chemical Co., Ltd. - Product / Service
              • Hitachi Chemical Co., Ltd. - Key offerings
            • 14.13 Johnson Controls International Plc
              • Johnson Controls International Plc - Overview
              • Johnson Controls International Plc - Product / Service
              • Johnson Controls International Plc - Key offerings
            • 14.14 LG Chem Ltd.
              • LG Chem Ltd. - Overview
              • LG Chem Ltd. - Product / Service
              • LG Chem Ltd. - Key offerings
            • 14.15 Panasonic Corporation
              • Panasonic Corporation - Overview
              • Panasonic Corporation - Product / Service
              • Panasonic Corporation - Key offerings
            • 14.16 Saft Groupe S.A.
              • Saft Groupe S.A. - Overview
              • Saft Groupe S.A. - Product / Service
              • Saft Groupe S.A. - Key offerings
            • 14.17 Samsung SDI Co., Ltd.
              • Samsung SDI Co., Ltd. - Overview
              • Samsung SDI Co., Ltd. - Product / Service
              • Samsung SDI Co., Ltd. - Key offerings
            • 14.18 Shenzhen BAK Battery Co., Ltd.
              • Shenzhen BAK Battery Co., Ltd. - Overview
              • Shenzhen BAK Battery Co., Ltd. - Product / Service
              • Shenzhen BAK Battery Co., Ltd. - Key offerings
            • 14.19 Tesla Inc.
              • Tesla Inc. - Overview
              • Tesla Inc. - Product / Service
              • Tesla Inc. - Key offerings
            • 14.20 Toshiba Corporation
              • Toshiba Corporation - Overview
              • Toshiba Corporation - Product / Service
              • Toshiba Corporation - Key offerings
            • 14.21 Trojan Battery Company
              • Trojan Battery Company - Overview
              • Trojan Battery Company - Product / Service
              • Trojan Battery Company - Key offerings
            • 14.22 Umicore S.A.
              • Umicore S.A. - Overview
              • Umicore S.A. - Product / Service
              • Umicore S.A. - Key offerings
            • 14.23 A123 Systems LLC (USA)
              • A123 Systems LLC (USA) - Overview
              • A123 Systems LLC (USA) - Product / Service
              • A123 Systems LLC (USA) - Key offerings
            • 14.24 CLARIOS LLC (USA)
              • CLARIOS LLC (USA) - Overview
              • CLARIOS LLC (USA) - Product / Service
              • CLARIOS LLC (USA) - Key offerings
            • 14.25 Cummins Inc. (USA)
              • Cummins Inc. (USA) - Overview
              • Cummins Inc. (USA) - Product / Service
              • Cummins Inc. (USA) - Key offerings
            • 14.26 East Penn Manufacturing Co. Inc. (USA)
              • East Penn Manufacturing Co. Inc. (USA) - Overview
              • East Penn Manufacturing Co. Inc. (USA) - Product / Service
              • East Penn Manufacturing Co. Inc. (USA) - Key offerings
            • 14.27 EnerSys (USA)
              • EnerSys (USA) - Overview
              • EnerSys (USA) - Product / Service
              • EnerSys (USA) - Key offerings
            • 14.28 Exide Industries Ltd. (India)
              • Exide Industries Ltd. (India) - Overview
              • Exide Industries Ltd. (India) - Product / Service
              • Exide Industries Ltd. (India) - Key offerings
            • 14.29 Furukawa Electric Co. Ltd. (Japan)
              • Furukawa Electric Co. Ltd. (Japan) - Overview
              • Furukawa Electric Co. Ltd. (Japan) - Product / Service
              • Furukawa Electric Co. Ltd. (Japan) - Key offerings
            • 14.30 GS Yuasa International Ltd. (Japan)
              • GS Yuasa International Ltd. (Japan) - Overview
              • GS Yuasa International Ltd. (Japan) - Product / Service
              • GS Yuasa International Ltd. (Japan) - Key offerings
            • 14.31 HBL Power Systems Ltd. (India)
              • HBL Power Systems Ltd. (India) - Overview
              • HBL Power Systems Ltd. (India) - Product / Service
              • HBL Power Systems Ltd. (India) - Key offerings
            • 14.32 Hitachi Ltd. (Japan)
              • Hitachi Ltd. (Japan) - Overview
              • Hitachi Ltd. (Japan) - Product / Service
              • Hitachi Ltd. (Japan) - Key offerings
            • 14.33 Korea Battery Co. Ltd. (South Korea)
              • Korea Battery Co. Ltd. (South Korea) - Overview
              • Korea Battery Co. Ltd. (South Korea) - Product / Service
              • Korea Battery Co. Ltd. (South Korea) - Key offerings
            • 14.34 Leoch International Technology Ltd. (China)
              • Leoch International Technology Ltd. (China) - Overview
              • Leoch International Technology Ltd. (China) - Product / Service
              • Leoch International Technology Ltd. (China) - Key offerings
            • 14.35 LG Chem Ltd. (South Korea)
              • LG Chem Ltd. (South Korea) - Overview
              • LG Chem Ltd. (South Korea) - Product / Service
              • LG Chem Ltd. (South Korea) - Key offerings
            • 14.36 Murata Manufacturing Co. Ltd. (Japan)
              • Murata Manufacturing Co. Ltd. (Japan) - Overview
              • Murata Manufacturing Co. Ltd. (Japan) - Product / Service
              • Murata Manufacturing Co. Ltd. (Japan) - Key offerings
            • 14.37 Panasonic Holdings Corp. (Japan)
              • Panasonic Holdings Corp. (Japan) - Overview
              • Panasonic Holdings Corp. (Japan) - Product / Service
              • Panasonic Holdings Corp. (Japan) - Key offerings
            • 14.38 Robert Bosch GmbH (Germany)
              • Robert Bosch GmbH (Germany) - Overview
              • Robert Bosch GmbH (Germany) - Product / Service
              • Robert Bosch GmbH (Germany) - Key offerings
            • 14.39 Samsung Electronics Co. Ltd. (South Korea)
              • Samsung Electronics Co. Ltd. (South Korea) - Overview
              • Samsung Electronics Co. Ltd. (South Korea) - Product / Service
              • Samsung Electronics Co. Ltd. (South Korea) - Key offerings
            • 14.40 TDK Corp. (Japan)
              • TDK Corp. (Japan) - Overview
              • TDK Corp. (Japan) - Product / Service
              • TDK Corp. (Japan) - Key offerings
            • 14.41 Toshiba Corp. (Japan)
              • Toshiba Corp. (Japan) - Overview
              • Toshiba Corp. (Japan) - Product / Service
              • Toshiba Corp. (Japan) - Key offerings

            15 Appendix

            • 15.1 Scope of the report
              • 15.2 Inclusions and exclusions checklist
                • Inclusions checklist
                • Exclusions checklist
              • 15.3 Currency conversion rates for US$
                • Currency conversion rates for US$
              • 15.4 Research methodology
                • Research methodology
              • 15.5 Data procurement
                • Information sources
              • 15.6 Data validation
                • Data validation
              • 15.7 Validation techniques employed for market sizing
                • Validation techniques employed for market sizing
              • 15.8 Data synthesis
                • Data synthesis
              • 15.9 360 degree market analysis
                • 360 degree market analysis
              • 15.10 List of abbreviations
                • List of abbreviations

              Research Methodology

              Technavio presents a detailed picture of the market by way of study, synthesis, and summation of data from multiple sources. The analysts have presented the various facets of the market with a particular focus on identifying the key industry influencers. The data thus presented is comprehensive, reliable, and the result of extensive research, both primary and secondary.

              INFORMATION SOURCES

              Primary sources

              • Manufacturers and suppliers
              • Channel partners
              • Industry experts
              • Strategic decision makers

              Secondary sources

              • Industry journals and periodicals
              • Government data
              • Financial reports of key industry players
              • Historical data
              • Press releases

              DATA ANALYSIS

              Data Synthesis

              • Collation of data
              • Estimation of key figures
              • Analysis of derived insights

              Data Validation

              • Triangulation with data models
              • Reference against proprietary databases
              • Corroboration with industry experts

              REPORT WRITING

              Qualitative

              • Market drivers
              • Market challenges
              • Market trends
              • Five forces analysis

              Quantitative

              • Market size and forecast
              • Market segmentation
              • Geographical insights
              • Competitive landscape

              Interested in this report?

              Get your sample now to see our research methodology and insights!

              Download Now

              Frequently Asked Questions

              Battery market growth will increase by $ 296.6 bn during 2024-2028 .

              The Battery market is expected to grow at a CAGR of 18.69% during 2024-2028 .

              Battery market is segmented by Application( Portable batteries, Automotive batteries, Industrial batteries, Portable batteries, Automotive batteries) Type( Lithium ion, Silicon-Graphite Composite, Pure Silicon Anode, Silicon-Based Solid-State Batteries, Silicon-Sulfur)

              A123 Systems LLC, BYD Company Ltd., CATL (Contemporary Amperex Technology Co. Limited), Clarios, Duracell Inc., East Penn Manufacturing Co., EnerSys, Exide Industries Ltd., GS Yuasa Corporation, Hitachi Chemical Co., Ltd., Johnson Controls International Plc, LG Chem Ltd., Panasonic Corporation, Saft Groupe S.A., Samsung SDI Co., Ltd., Shenzhen BAK Battery Co., Ltd., Tesla Inc., Toshiba Corporation, Trojan Battery Company, Umicore S.A. are a few of the key vendors in the Battery market.

              APAC will register the highest growth rate of 44% among the other regions. Therefore, the Battery market in APAC is expected to garner significant business opportunities for the vendors during the forecast period.

              China, US, Germany, UK, Japan, India, South Korea, Canada, UAE, Brazil

              • Shift in the automotive industry to EVsThe popularity of EVs is increasing owing to growing concerns over environmental pollution and a shift toward a more sustainable ecosystem in the automotive industry. Various countries have framed policies to reduce air pollution levels is the driving factor this market.
              • as well as vehicle emissions. On average is the driving factor this market.
              • gasoline or conventional vehicles release double the amount of GHGs than EVs. Therefore is the driving factor this market.
              • with the aim of reducing emissions and the carbon footprint is the driving factor this market.
              • the automotive industry is shifting its focus toward electrified cars. EVs are considered a green solution is the driving factor this market.
              • which will contribute in a major way to the decarbonization of the transport sector. The governments of various countries are setting objectives for the deployment of EVs and electric buses. For instance is the driving factor this market.
              • in March 2021 is the driving factor this market.
              • the first fully Australian-designed and built electric bus was launched for a two-week trial in Sydney as a result of plans made by the New South Wales State Government to convert its entire bus fleet to electric by 2030. In April 2021 is the driving factor this market.
              • the US Environmental Protection Agency (EPA) awarded approximately $10.5 million in Diesel Emissions Reduction Act (DERA) funding to replace 473 old diesel school buses with electric ones. Countries such as China and the US are also providing tax exemptions to the owners of EVs to boost the adoption of these vehicles. This has increased the confidence of manufacturers and stakeholders in the future policy framework and the mobilization of investments. Batteries are a dominant power solution for EVs. In an EV is the driving factor this market.
              • the battery pack consists of tens to thousands of batteries is the driving factor this market.
              • which are called cells. These cells are either cylindrical is the driving factor this market.
              • prismatic is the driving factor this market.
              • or laminate in shapes. Depending on the design of vehicles is the driving factor this market.
              • EV manufacturers use these cells to deliver higher levels of performance. Tesla is the driving factor this market.
              • one of the largest EV manufacturers globally is the driving factor this market.
              • uses batteries manufactured by Panasonic in its Tesla Model S and Tesla Model X cars. The growing adoption of EVs owing to sustainability factors will result in increased sales volume of batteries is the driving factor this market.
              • thereby driving the growth of the battery market during the forecast period. is the driving factor this market.

              The Battery market vendors should focus on grabbing business opportunities from the Portable batteries segment as it accounted for the largest market share in the base year.