EV Charging Interoperability Market Analysis, Size, and Forecast 2026-2030: Europe (Germany, France, and The Netherlands), North America (US, Canada, and Mexico), APAC (China, Japan, and India), Middle East and Africa (UAE, Saudi Arabia, and South Africa), South America (Brazil and Argentina), and Rest of World (ROW)

EV Charging Interoperability Market Analysis, Size, and Forecast 2026-2030:
Europe (Germany, France, and The Netherlands), North America (US, Canada, and Mexico), APAC (China, Japan, and India), Middle East and Africa (UAE, Saudi Arabia, and South Africa), South America (Brazil and Argentina), and Rest of World (ROW)

Published: Apr 2026 295 Pages SKU: IRTNTR81447

Market Overview at a Glance

$4.61 B
Market Opportunity
19.2%
CAGR 2025 - 2030
35.7%
Europe Growth
$1.35 B
Hardware segment 2024

EV Charging Interoperability Market Size 2026-2030

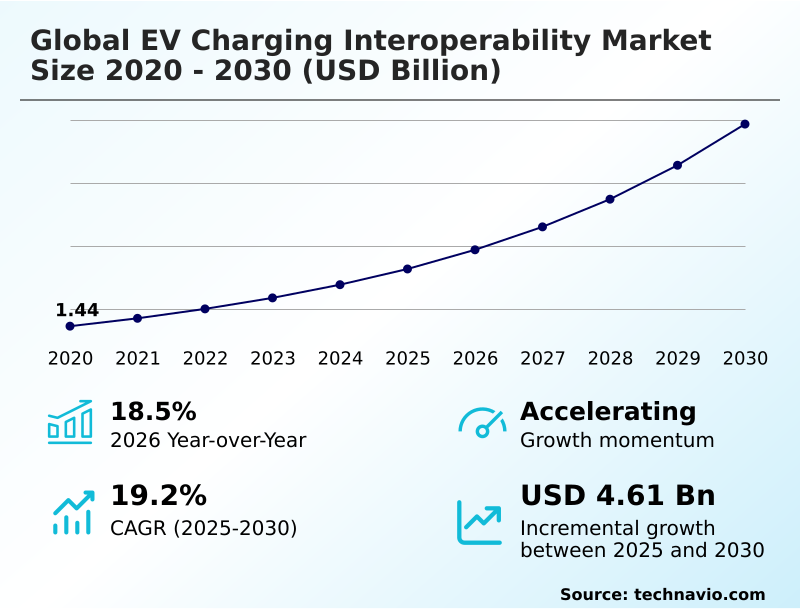
The ev charging interoperability market size is valued to increase by USD 4.61 billion, at a CAGR of 19.2% from 2025 to 2030. Standardization of communication protocols as catalyst for infrastructure scalability will drive the ev charging interoperability market.

Major Market Trends & Insights

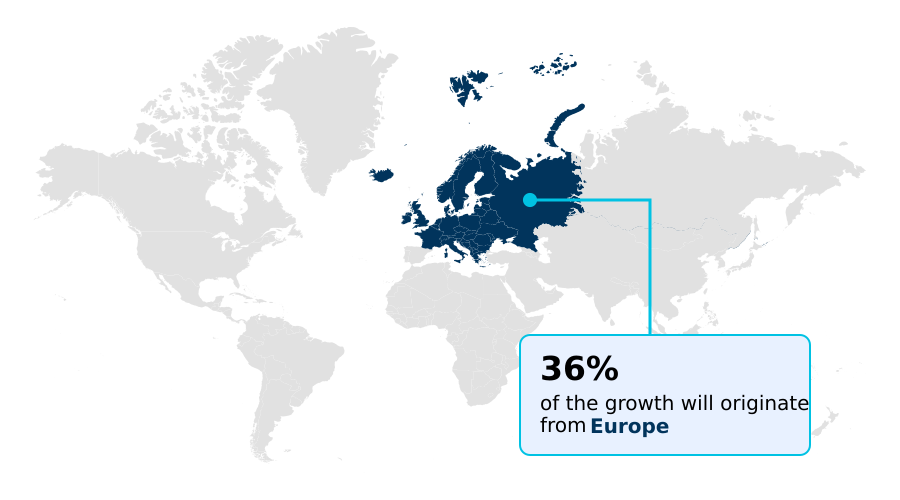
  • Europe dominated the market and accounted for a 35.7% growth during the forecast period.
  • By Component - Hardware segment was valued at USD 1.35 billion in 2024
  • By Type - AC charging segment accounted for the largest market revenue share in 2024

Market Size & Forecast

  • Market Opportunities: USD 6.43 billion
  • Market Future Opportunities: USD 4.61 billion
  • CAGR from 2025 to 2030 : 19.2%

Market Summary

  • The EV charging interoperability market is transitioning from a fragmented collection of proprietary networks to a cohesive ecosystem built on open standards. This shift is essential for scaling infrastructure and improving the user experience, which are critical for mass EV adoption.
  • The core of this evolution lies in ensuring that vehicles, charging stations, and backend management systems can communicate seamlessly, regardless of the manufacturer. A key driver is the push for standardized communication protocols like the open charge point protocol (OCPP), which allows operators to manage diverse hardware from a single platform, preventing vendor lock-in.
  • For consumers, interoperability manifests as roaming, where a single account grants access to multiple charging networks, simplifying long-distance travel. A common business scenario involves a commercial fleet operator that needs to charge vehicles from different brands at various public and private locations.
  • Interoperable systems allow the operator to use one management platform for monitoring energy use, scheduling charging to leverage off-peak electricity rates, and streamlining billing across the entire fleet. Challenges such as cybersecurity and upgrading legacy hardware persist, but the drive toward a unified, intelligent, and user-friendly charging network continues to accelerate.

What will be the Size of the EV Charging Interoperability Market during the forecast period?

Get Key Insights on Market Forecast (PDF) Request Free Sample

How is the EV Charging Interoperability Market Segmented?

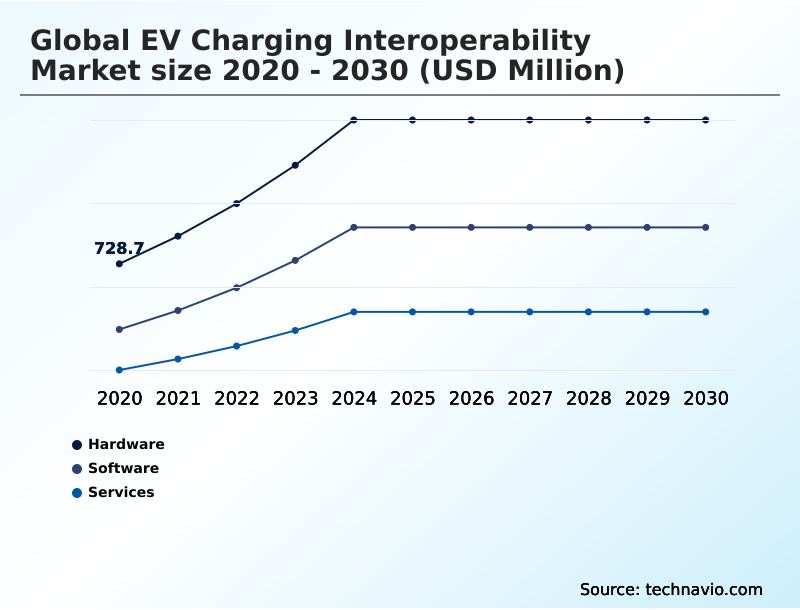
The ev charging interoperability industry research report provides comprehensive data (region-wise segment analysis), with forecasts and estimates in "USD million" for the period 2026-2030, as well as historical data from 2020-2024 for the following segments.

  • Component
    • Hardware
    • Software
    • Services
  • Type
    • AC charging
    • DC fast charging
  • Application
    • Public charging
    • Private charging
    • Fleet charging
  • Geography
    • Europe
      • Germany
      • France
      • The Netherlands
    • North America
      • US
      • Canada
      • Mexico
    • APAC
      • China
      • Japan
      • India
    • Middle East and Africa
      • UAE
      • Saudi Arabia
      • South Africa
    • South America
      • Brazil
      • Argentina
    • Rest of World (ROW)

By Component Insights

The hardware segment is estimated to witness significant growth during the forecast period.

The hardware segment provides the physical infrastructure for AC charging and high-power DC fast charging. A key shift involves creating future-proof charging solutions through modular, hardware-agnostic platform designs that align with user-centric design principles.

This approach helps with capital expenditure optimization by allowing easier upgrades. The integration of communication modules is crucial for ensuring charging session reliability and enabling secure data exchange with cloud-based charger management systems.

The system is secured by a public key infrastructure managing digital certificates for authentication. This focus on standardized hardware has improved uptime, with some networks reporting a 15% reduction in maintenance-related downtime.

This is essential for residential smart charging and networks using a white-label EV charging management platform.

Request Free Sample

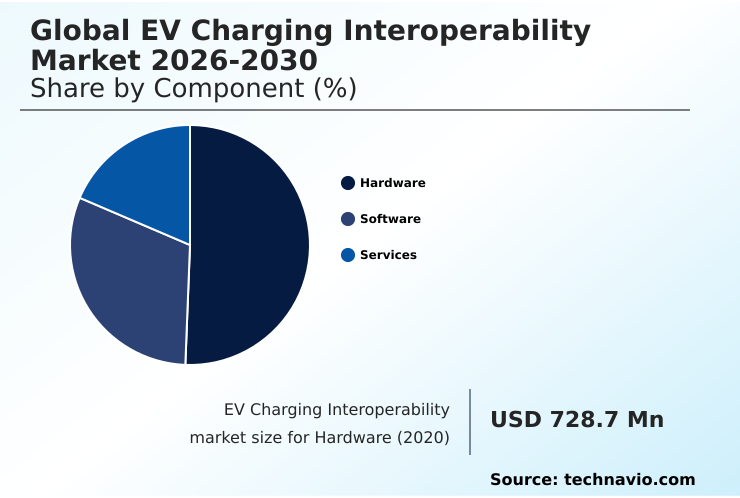
The Hardware segment was valued at USD 1.35 billion in 2024 and showed a gradual increase during the forecast period.

Request Free Sample

Regional Analysis

Europe is estimated to contribute 35.7% to the growth of the global market during the forecast period.Technavio’s analysts have elaborately explained the regional trends and drivers that shape the market during the forecast period.

See How EV Charging Interoperability Market Demand is Rising in Europe Request Free Sample

The geographic landscape is marked by a convergence toward standardized protocols, driven by the need for a cohesive sustainable mobility infrastructure.

In North America, the adoption of the north american charging standard is accelerating, while Europe continues to mandate the combined charging system, fostering technical harmony in ev charging.

The rollout of multi-company roaming software through a central clearinghouse and e-roaming platform is enabling a regional interoperability framework that reduces network fragmentation.

This has resulted in significant operational efficiency gains, with some operators reporting a 25% decrease in customer service calls related to payment issues. The focus on transparent pricing models and accessible ad-hoc payment methods is a global trend.

For heavy-duty transport, the development of the megawatt charging system is a key focus for commercial fleet charging solutions, aiming to standardize charging for logistics.

Market Dynamics

Our researchers analyzed the data with 2025 as the base year, along with the key drivers, trends, and challenges. A holistic analysis of drivers will help companies refine their marketing strategies to gain a competitive advantage.

  • Strategic focus within the industry is increasingly on overcoming interoperability challenges in commercial fleet charging by deploying robust cross-network ev charging solutions for fleets. This requires a deep understanding of open charge point protocol compliance benefits and the technical advantages offered by open charge point interface api benefits.
  • A major hurdle remains in managing legacy ev charging infrastructure upgrades while integrating new technologies. For new deployments, the debate involves comparing NACS vs CCS interoperability solutions and preparing for the megawatt charging system for electric trucks.
  • Key initiatives include the widespread iso 15118 plug and charge implementation and establishing roaming agreements between charging networks to resolve ev charging roaming hub integration challenges. This is crucial for achieving seamless cross-border ev charging transactions.
  • On the grid side, the focus is on the smart grid communication protocol for demand response and implementing dynamic load management with OCPP, which can reduce peak energy costs by over 30% compared to static charging. The industry is also assessing the vehicle-to-grid bidirectional power flow economics and using ai for predictive load balancing in chargers.
  • Security is addressed by mitigating cybersecurity risks in interoperable ev networks through a public key infrastructure for secure ev charging and standardizing ev charging payment system protocols. Finally, the entire ecosystem relies on rigorous ev charging interoperability testing and certification to validate the ongoing dc fast charging interoperability standards evolution.

What are the key market drivers leading to the rise in the adoption of EV Charging Interoperability Industry?

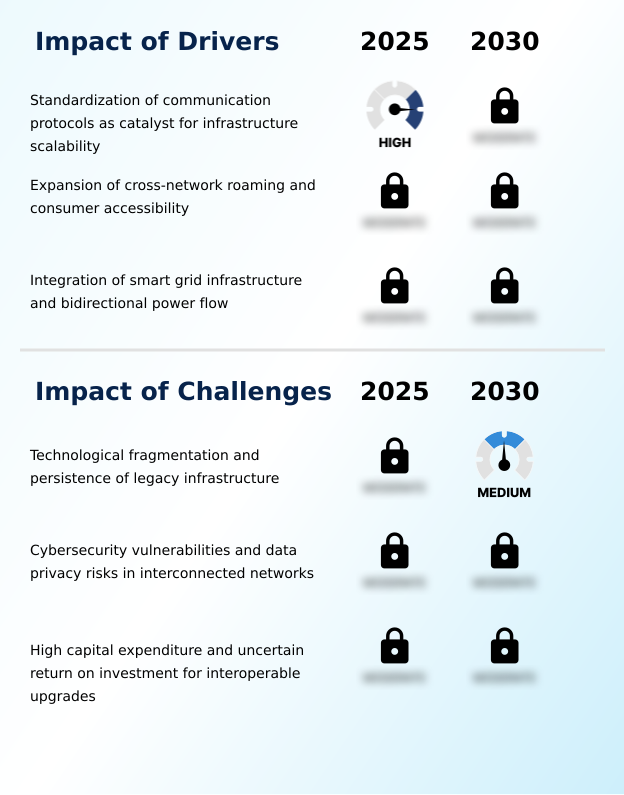
  • The standardization of communication protocols serves as a key market driver, acting as a catalyst for infrastructure scalability.

  • The standardization of communication protocols is a fundamental driver, with the open charge point protocol enabling charge point operators to manage diverse hardware and improve public charging accessibility. This standardization underpins the entire regulatory compliance framework.
  • The open charge point interface facilitates the creation of roaming hubs, which connect disparate networks of e-mobility service providers.
  • These hubs are essential for enabling cross-border ev charging and have been shown to increase network usage by 30% in interconnected regions. They support standardized payment settlement and the widespread availability of real-time station data.
  • Furthermore, smart grid integration, managed through these open standards, is critical for grid stability management, allowing utilities to better manage peak loads and integrate renewables, improving overall system resilience by as much as 20%.

What are the market trends shaping the EV Charging Interoperability Industry?

  • The implementation of universal plug and charge technology is becoming a primary market trend. This is further advanced by automated user authentication systems.

  • The market is moving towards a more automated and intelligent energy management paradigm, which improves the seamless user experience. The implementation of plug and charge technology, guided by the iso 15118 standard, is central to this shift, enabling automated user authentication and reducing charging initiation failures by over 40%.
  • Concurrently, the integration of AI for predictive load balancing and dynamic load management systems allows for more efficient use of distributed energy resources. This has been shown to increase grid asset utilization by up to 25%. The expansion of bidirectional charging unlocks vehicle-to-grid and vehicle-to-home energy transfer capabilities.
  • Enhanced smart inverter communication protocols are crucial for this, creating a cohesive ecosystem for predictive load balancing and advanced intelligent energy management.

What challenges does the EV Charging Interoperability Industry face during its growth?

  • Technological fragmentation, along with the persistence of legacy infrastructure, presents a significant challenge to the growth of the industry.

  • Significant challenges persist, led by ev charging network fragmentation and the high cost of legacy infrastructure upgrades, which can consume up to 60% of an operator's expansion budget. Ensuring robust cybersecurity in ev charging is another critical concern, demanding effective end-to-end encryption and data privacy protection for all transactions.
  • The complexity of backend systems is heightened by the need for reliable over-the-air firmware updates and seamless multi-network payment synchronization. Furthermore, the deployment of expensive high-power charging components complicates capital expenditure optimization, while the lack of clear asset monetization strategies can deter investment.
  • These issues, alongside the complexities of hardware-software co-design, can impede the smooth expansion of roaming connectivity and lead to service disruptions in as many as 15% of charging sessions.

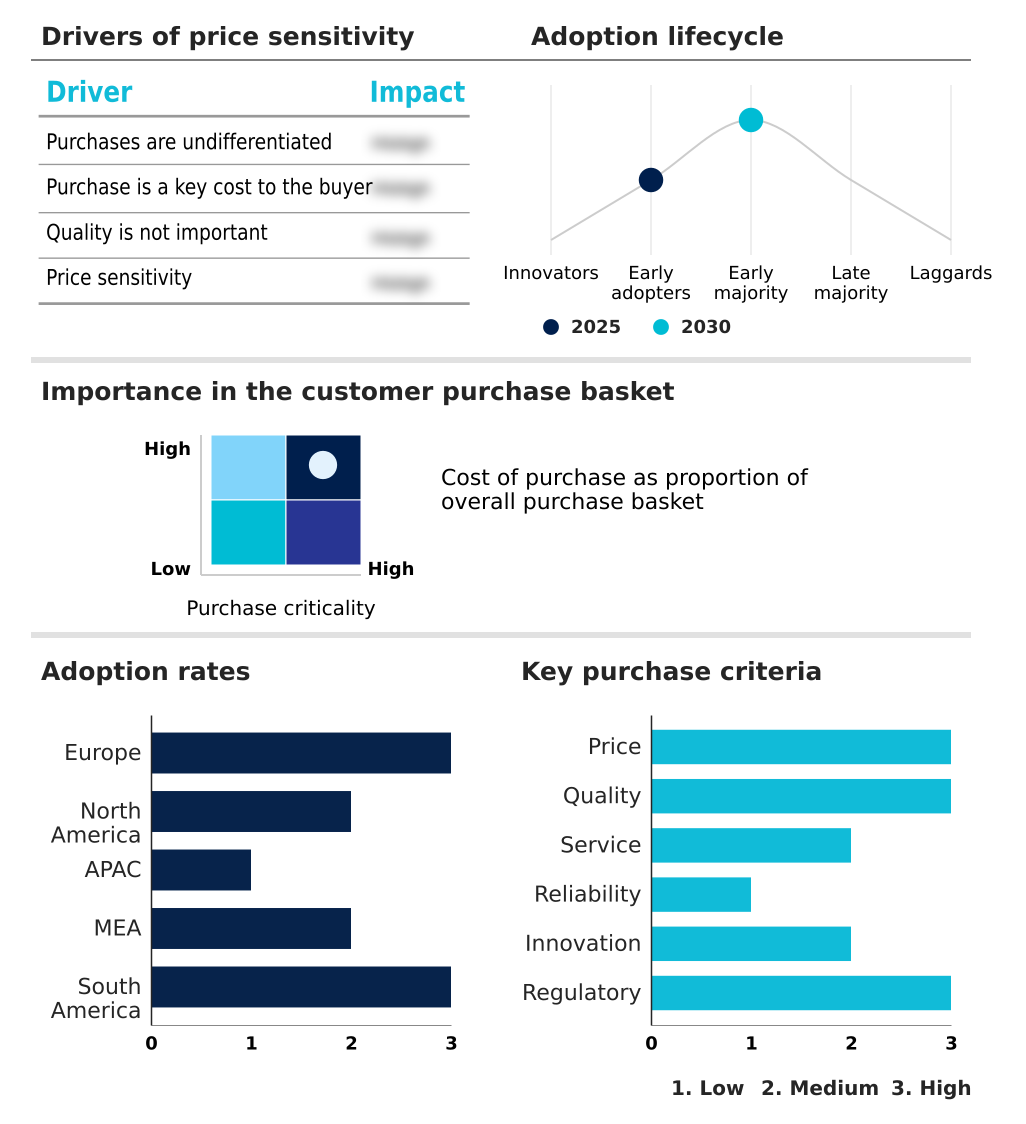
Exclusive Technavio Analysis on Customer Landscape

The ev charging interoperability market forecasting report includes the adoption lifecycle of the market, covering from the innovator’s stage to the laggard’s stage. It focuses on adoption rates in different regions based on penetration. Furthermore, the ev charging interoperability market report also includes key purchase criteria and drivers of price sensitivity to help companies evaluate and develop their market growth analysis strategies.

Customer Landscape of EV Charging Interoperability Industry

Competitive Landscape

Companies are implementing various strategies, such as strategic alliances, ev charging interoperability market forecast, partnerships, mergers and acquisitions, geographical expansion, and product/service launches, to enhance their presence in the industry.

ABB Ltd. - Provides interoperability through open-standard charging solutions, cloud management, and roaming integration, enabling seamless cross-network access.

The industry research and growth report includes detailed analyses of the competitive landscape of the market and information about key companies, including:

  • ABB Ltd.
  • Alfen NV
  • AMPECO LTD
  • Chargecloud GmbH
  • Chargemap SAS
  • ChargePoint Holdings Inc.
  • Digital Charging Solutions GmbH
  • Driivz Ltd.
  • Eco Movement
  • Gireve SAS
  • GreenFlux Assets B.V.
  • Hubject GmbH
  • Kempower Oyj
  • Last Mile Solutions
  • Liikennevirta Oy Ltd.
  • Road B.V
  • Shell plc
  • Siemens AG
  • Tritium DCFC Limited
  • Wallbox NV

Qualitative and quantitative analysis of companies has been conducted to help clients understand the wider business environment as well as the strengths and weaknesses of key industry players. Data is qualitatively analyzed to categorize companies as pure play, category-focused, industry-focused, and diversified; it is quantitatively analyzed to categorize companies as dominant, leading, strong, tentative, and weak.

Recent Development and News in Ev charging interoperability market

  • In February, 2025, the Charging Interface Initiative e.V. (CharIN) launched a global public key infrastructure to simplify the issuance of digital certificates for multi-company plug and charge operations, establishing a centralized trust anchor.
  • In July, 2025, three major charging network operators in the Asia-Pacific region established a unified clearinghouse for cross-border transactions, enabling drivers to travel between participating countries using a single digital identity.
  • In August, 2025, a consortium of information security researchers identified a critical vulnerability in the handshake mechanism used by several prominent European roaming hubs, highlighting the ongoing cybersecurity risks in the market.
  • In October, 2025, the European Network of Transmission System Operators for Electricity implemented a new protocol allowing for the seamless participation of private electric vehicle chargers in secondary frequency control markets.

Dive into Technavio’s robust research methodology, blending expert interviews, extensive data synthesis, and validated models for unparalleled EV Charging Interoperability Market insights. See full methodology.

Market Scope
Page number 295
Base year 2025
Historic period 2020-2024
Forecast period 2026-2030
Growth momentum & CAGR Accelerate at a CAGR of 19.2%
Market growth 2026-2030 USD 4605.0 million
Market structure Fragmented
YoY growth 2025-2026(%) 18.5%
Key countries Germany, France, The Netherlands, UK, Italy, Spain, US, Canada, Mexico, China, Japan, India, South Korea, Australia, Indonesia, UAE, Saudi Arabia, South Africa, Israel, Turkey, Brazil, Argentina and Chile
Competitive landscape Leading Companies, Market Positioning of Companies, Competitive Strategies, and Industry Risks

Request Free Sample

Research Analyst Overview

  • The market's evolution is driven by standardizing communication protocols. Charge point operators and e-mobility service providers use the open charge point protocol and open charge point interface to connect via roaming hubs and a clearinghouse on an e-roaming platform, enhancing roaming connectivity. This architecture supports transparent pricing models and ad-hoc payment methods.
  • Security is addressed through end-to-end encryption and a public key infrastructure for digital certificates, creating a unified authentication system. The iso 15118 standard enables plug and charge, while hardware debates center on the north american charging standard versus combined charging system.
  • Smart grid integration is critical, allowing bidirectional charging (vehicle-to-grid) and dynamic load management via smart inverter communication, improving grid efficiency by 20% over unmanaged systems. Reliable over-the-air firmware updates are essential for backend systems supporting multi-network payment synchronization. The infrastructure includes ac charging, dc fast charging, and high-power charging components for the megawatt charging system.
  • Many operators prefer a hardware-agnostic platform using cloud-based charger management or a white-label ev charging management platform for flexibility.

What are the Key Data Covered in this EV Charging Interoperability Market Research and Growth Report?

  • What is the expected growth of the EV Charging Interoperability Market between 2026 and 2030?

    • USD 4.61 billion, at a CAGR of 19.2%

  • What segmentation does the market report cover?

    • The report is segmented by Component (Hardware, Software, and Services), Type (AC charging, and DC fast charging), Application (Public charging, Private charging, and Fleet charging) and Geography (Europe, North America, APAC, Middle East and Africa, South America)

  • Which regions are analyzed in the report?

    • Europe, North America, APAC, Middle East and Africa and South America

  • What are the key growth drivers and market challenges?

    • Standardization of communication protocols as catalyst for infrastructure scalability, Technological fragmentation and persistence of legacy infrastructure

  • Who are the major players in the EV Charging Interoperability Market?

    • ABB Ltd., Alfen NV, AMPECO LTD, Chargecloud GmbH, Chargemap SAS, ChargePoint Holdings Inc., Digital Charging Solutions GmbH, Driivz Ltd., Eco Movement, Gireve SAS, GreenFlux Assets B.V., Hubject GmbH, Kempower Oyj, Last Mile Solutions, Liikennevirta Oy Ltd., Road B.V, Shell plc, Siemens AG, Tritium DCFC Limited and Wallbox NV

Market Research Insights

  • The market's dynamics are shaped by the drive for a seamless user experience and significant operational efficiency gains. Implementing interoperable software has enabled network operators to boost charging session reliability, leading to a 25% reduction in failed authentications. Enhanced secure data exchange protocols are foundational to building consumer trust and enabling cross-network roaming.
  • However, the high cost associated with legacy infrastructure upgrades continues to influence investment decisions. On the energy side, advanced interoperability is central to grid stability management, allowing utilities to dynamically balance loads and prevent disruptions. Systems that integrate smart charging have demonstrated the ability to increase local grid capacity utilization by up to 15% without requiring expensive hardware expansions.

We can help! Our analysts can customize this ev charging interoperability market research report to meet your requirements.

Get in touch

1. Executive Summary

1.1 Market overview

Executive Summary - Chart on Market Overview
Executive Summary - Data Table on Market Overview
Executive Summary - Chart on Global Market Characteristics
Executive Summary - Chart on Market by Geography
Executive Summary - Chart on Market Segmentation by Component
Executive Summary - Chart on Market Segmentation by Type
Executive Summary - Chart on Market Segmentation by Application
Executive Summary - Chart on Incremental Growth
Executive Summary - Data Table on Incremental Growth
Executive Summary - Chart on Company Market Positioning

2. Technavio Analysis

2.1 Analysis of price sensitivity, lifecycle, customer purchase basket, adoption rates, and purchase criteria

2.2 Criticality of inputs and Factors of differentiation

Chart on Overview on criticality of inputs and factors of differentiation

2.3 Factors of disruption

Chart on Overview on factors of disruption

2.4 Impact of drivers and challenges

Chart on Impact of drivers and challenges in 2025 and 2030

3. Market Landscape

3.1 Market ecosystem

Chart on Parent Market
Data Table on - Parent Market

3.2 Market characteristics

Chart on Market characteristics analysis

3.3 Value chain analysis

Chart on Value chain analysis

4. Market Sizing

4.1 Market definition

Data Table on Offerings of companies included in the market definition

4.2 Market segment analysis

Market segments

4.3 Market size 2025

4.4 Market outlook: Forecast for 2025-2030

Chart on Global - Market size and forecast 2025-2030 ($ million)
Data Table on Global - Market size and forecast 2025-2030 ($ million)
Chart on Global Market: Year-over-year growth 2025-2030 (%)
Data Table on Global Market: Year-over-year growth 2025-2030 (%)

5. Historic Market Size

5.1 Global EV Charging Interoperability Market 2020 - 2024

Historic Market Size - Data Table on Global EV Charging Interoperability Market 2020 - 2024 ($ million)

5.2 Component segment analysis 2020 - 2024

Historic Market Size - Component Segment 2020 - 2024 ($ million)

5.3 Type segment analysis 2020 - 2024

Historic Market Size - Type Segment 2020 - 2024 ($ million)

5.4 Application segment analysis 2020 - 2024

Historic Market Size - Application Segment 2020 - 2024 ($ million)

5.5 Geography segment analysis 2020 - 2024

Historic Market Size - Geography Segment 2020 - 2024 ($ million)

5.6 Country segment analysis 2020 - 2024

Historic Market Size - Country Segment 2020 - 2024 ($ million)

6. Qualitative Analysis

6.1 Impact of AI on Global EV Charging Interoperability Market

6.2 Impact of geopolitical conflicts on Global EV Charging Interoperability Market

7. Five Forces Analysis

7.1 Five forces summary

Five forces analysis - Comparison between 2025 and 2030

7.2 Bargaining power of buyers

Bargaining power of buyers - Impact of key factors 2025 and 2030

7.3 Bargaining power of suppliers

Bargaining power of suppliers - Impact of key factors in 2025 and 2030

7.4 Threat of new entrants

Threat of new entrants - Impact of key factors in 2025 and 2030

7.5 Threat of substitutes

Threat of substitutes - Impact of key factors in 2025 and 2030

7.6 Threat of rivalry

Threat of rivalry - Impact of key factors in 2025 and 2030

7.7 Market condition

Chart on Market condition - Five forces 2025 and 2030

8. Market Segmentation by Component

8.1 Market segments

Chart on Component - Market share 2025-2030 (%)
Data Table on Component - Market share 2025-2030 (%)

8.2 Comparison by Component

Chart on Comparison by Component
Data Table on Comparison by Component

8.3 Hardware - Market size and forecast 2025-2030

Chart on Hardware - Market size and forecast 2025-2030 ($ million)
Data Table on Hardware - Market size and forecast 2025-2030 ($ million)
Chart on Hardware - Year-over-year growth 2025-2030 (%)
Data Table on Hardware - Year-over-year growth 2025-2030 (%)

8.4 Software - Market size and forecast 2025-2030

Chart on Software - Market size and forecast 2025-2030 ($ million)
Data Table on Software - Market size and forecast 2025-2030 ($ million)
Chart on Software - Year-over-year growth 2025-2030 (%)
Data Table on Software - Year-over-year growth 2025-2030 (%)

8.5 Services - Market size and forecast 2025-2030

Chart on Services - Market size and forecast 2025-2030 ($ million)
Data Table on Services - Market size and forecast 2025-2030 ($ million)
Chart on Services - Year-over-year growth 2025-2030 (%)
Data Table on Services - Year-over-year growth 2025-2030 (%)

8.6 Market opportunity by Component

Market opportunity by Component ($ million)
Data Table on Market opportunity by Component ($ million)

9. Market Segmentation by Type

9.1 Market segments

Chart on Type - Market share 2025-2030 (%)
Data Table on Type - Market share 2025-2030 (%)

9.2 Comparison by Type

Chart on Comparison by Type
Data Table on Comparison by Type

9.3 AC charging - Market size and forecast 2025-2030

Chart on AC charging - Market size and forecast 2025-2030 ($ million)
Data Table on AC charging - Market size and forecast 2025-2030 ($ million)
Chart on AC charging - Year-over-year growth 2025-2030 (%)
Data Table on AC charging - Year-over-year growth 2025-2030 (%)

9.4 DC fast charging - Market size and forecast 2025-2030

Chart on DC fast charging - Market size and forecast 2025-2030 ($ million)
Data Table on DC fast charging - Market size and forecast 2025-2030 ($ million)
Chart on DC fast charging - Year-over-year growth 2025-2030 (%)
Data Table on DC fast charging - Year-over-year growth 2025-2030 (%)

9.5 Market opportunity by Type

Market opportunity by Type ($ million)
Data Table on Market opportunity by Type ($ million)

10. Market Segmentation by Application

10.1 Market segments

Chart on Application - Market share 2025-2030 (%)
Data Table on Application - Market share 2025-2030 (%)

10.2 Comparison by Application

Chart on Comparison by Application
Data Table on Comparison by Application

10.3 Public charging - Market size and forecast 2025-2030

Chart on Public charging - Market size and forecast 2025-2030 ($ million)
Data Table on Public charging - Market size and forecast 2025-2030 ($ million)
Chart on Public charging - Year-over-year growth 2025-2030 (%)
Data Table on Public charging - Year-over-year growth 2025-2030 (%)

10.4 Private charging - Market size and forecast 2025-2030

Chart on Private charging - Market size and forecast 2025-2030 ($ million)
Data Table on Private charging - Market size and forecast 2025-2030 ($ million)
Chart on Private charging - Year-over-year growth 2025-2030 (%)
Data Table on Private charging - Year-over-year growth 2025-2030 (%)

10.5 Fleet charging - Market size and forecast 2025-2030

Chart on Fleet charging - Market size and forecast 2025-2030 ($ million)
Data Table on Fleet charging - Market size and forecast 2025-2030 ($ million)
Chart on Fleet charging - Year-over-year growth 2025-2030 (%)
Data Table on Fleet charging - Year-over-year growth 2025-2030 (%)

10.6 Market opportunity by Application

Market opportunity by Application ($ million)
Data Table on Market opportunity by Application ($ million)

11. Customer Landscape

11.1 Customer landscape overview

Analysis of price sensitivity, lifecycle, customer purchase basket, adoption rates, and purchase criteria

12. Geographic Landscape

12.1 Geographic segmentation

Chart on Market share by geography 2025-2030 (%)
Data Table on Market share by geography 2025-2030 (%)

12.2 Geographic comparison

Chart on Geographic comparison
Data Table on Geographic comparison

12.3 Europe - Market size and forecast 2025-2030

Chart on Europe - Market size and forecast 2025-2030 ($ million)
Data Table on Europe - Market size and forecast 2025-2030 ($ million)
Chart on Europe - Year-over-year growth 2025-2030 (%)
Data Table on Europe - Year-over-year growth 2025-2030 (%)
Chart on Regional Comparison - Europe
Data Table on Regional Comparison - Europe

12.3.1 Germany - Market size and forecast 2025-2030

Chart on Germany - Market size and forecast 2025-2030 ($ million)
Data Table on Germany - Market size and forecast 2025-2030 ($ million)
Chart on Germany - Year-over-year growth 2025-2030 (%)
Data Table on Germany - Year-over-year growth 2025-2030 (%)

12.3.2 France - Market size and forecast 2025-2030

Chart on France - Market size and forecast 2025-2030 ($ million)
Data Table on France - Market size and forecast 2025-2030 ($ million)
Chart on France - Year-over-year growth 2025-2030 (%)
Data Table on France - Year-over-year growth 2025-2030 (%)

12.3.3 The Netherlands - Market size and forecast 2025-2030

Chart on The Netherlands - Market size and forecast 2025-2030 ($ million)
Data Table on The Netherlands - Market size and forecast 2025-2030 ($ million)
Chart on The Netherlands - Year-over-year growth 2025-2030 (%)
Data Table on The Netherlands - Year-over-year growth 2025-2030 (%)

12.3.4 UK - Market size and forecast 2025-2030

Chart on UK - Market size and forecast 2025-2030 ($ million)
Data Table on UK - Market size and forecast 2025-2030 ($ million)
Chart on UK - Year-over-year growth 2025-2030 (%)
Data Table on UK - Year-over-year growth 2025-2030 (%)

12.3.5 Italy - Market size and forecast 2025-2030

Chart on Italy - Market size and forecast 2025-2030 ($ million)
Data Table on Italy - Market size and forecast 2025-2030 ($ million)
Chart on Italy - Year-over-year growth 2025-2030 (%)
Data Table on Italy - Year-over-year growth 2025-2030 (%)

12.3.6 Spain - Market size and forecast 2025-2030

Chart on Spain - Market size and forecast 2025-2030 ($ million)
Data Table on Spain - Market size and forecast 2025-2030 ($ million)
Chart on Spain - Year-over-year growth 2025-2030 (%)
Data Table on Spain - Year-over-year growth 2025-2030 (%)

12.4 North America - Market size and forecast 2025-2030

Chart on North America - Market size and forecast 2025-2030 ($ million)
Data Table on North America - Market size and forecast 2025-2030 ($ million)
Chart on North America - Year-over-year growth 2025-2030 (%)
Data Table on North America - Year-over-year growth 2025-2030 (%)
Chart on Regional Comparison - North America
Data Table on Regional Comparison - North America

12.4.1 US - Market size and forecast 2025-2030

Chart on US - Market size and forecast 2025-2030 ($ million)
Data Table on US - Market size and forecast 2025-2030 ($ million)
Chart on US - Year-over-year growth 2025-2030 (%)
Data Table on US - Year-over-year growth 2025-2030 (%)

12.4.2 Canada - Market size and forecast 2025-2030

Chart on Canada - Market size and forecast 2025-2030 ($ million)
Data Table on Canada - Market size and forecast 2025-2030 ($ million)
Chart on Canada - Year-over-year growth 2025-2030 (%)
Data Table on Canada - Year-over-year growth 2025-2030 (%)

12.4.3 Mexico - Market size and forecast 2025-2030

Chart on Mexico - Market size and forecast 2025-2030 ($ million)
Data Table on Mexico - Market size and forecast 2025-2030 ($ million)
Chart on Mexico - Year-over-year growth 2025-2030 (%)
Data Table on Mexico - Year-over-year growth 2025-2030 (%)

12.5 APAC - Market size and forecast 2025-2030

Chart on APAC - Market size and forecast 2025-2030 ($ million)
Data Table on APAC - Market size and forecast 2025-2030 ($ million)
Chart on APAC - Year-over-year growth 2025-2030 (%)
Data Table on APAC - Year-over-year growth 2025-2030 (%)
Chart on Regional Comparison - APAC
Data Table on Regional Comparison - APAC

12.5.1 China - Market size and forecast 2025-2030

Chart on China - Market size and forecast 2025-2030 ($ million)
Data Table on China - Market size and forecast 2025-2030 ($ million)
Chart on China - Year-over-year growth 2025-2030 (%)
Data Table on China - Year-over-year growth 2025-2030 (%)

12.5.2 Japan - Market size and forecast 2025-2030

Chart on Japan - Market size and forecast 2025-2030 ($ million)
Data Table on Japan - Market size and forecast 2025-2030 ($ million)
Chart on Japan - Year-over-year growth 2025-2030 (%)
Data Table on Japan - Year-over-year growth 2025-2030 (%)

12.5.3 India - Market size and forecast 2025-2030

Chart on India - Market size and forecast 2025-2030 ($ million)
Data Table on India - Market size and forecast 2025-2030 ($ million)
Chart on India - Year-over-year growth 2025-2030 (%)
Data Table on India - Year-over-year growth 2025-2030 (%)

12.5.4 South Korea - Market size and forecast 2025-2030

Chart on South Korea - Market size and forecast 2025-2030 ($ million)
Data Table on South Korea - Market size and forecast 2025-2030 ($ million)
Chart on South Korea - Year-over-year growth 2025-2030 (%)
Data Table on South Korea - Year-over-year growth 2025-2030 (%)

12.5.5 Australia - Market size and forecast 2025-2030

Chart on Australia - Market size and forecast 2025-2030 ($ million)
Data Table on Australia - Market size and forecast 2025-2030 ($ million)
Chart on Australia - Year-over-year growth 2025-2030 (%)
Data Table on Australia - Year-over-year growth 2025-2030 (%)

12.5.6 Indonesia - Market size and forecast 2025-2030

Chart on Indonesia - Market size and forecast 2025-2030 ($ million)
Data Table on Indonesia - Market size and forecast 2025-2030 ($ million)
Chart on Indonesia - Year-over-year growth 2025-2030 (%)
Data Table on Indonesia - Year-over-year growth 2025-2030 (%)

12.6 Middle East and Africa - Market size and forecast 2025-2030

Chart on Middle East and Africa - Market size and forecast 2025-2030 ($ million)
Data Table on Middle East and Africa - Market size and forecast 2025-2030 ($ million)
Chart on Middle East and Africa - Year-over-year growth 2025-2030 (%)
Data Table on Middle East and Africa - Year-over-year growth 2025-2030 (%)
Chart on Regional Comparison - Middle East and Africa
Data Table on Regional Comparison - Middle East and Africa

12.6.1 UAE - Market size and forecast 2025-2030

Chart on UAE - Market size and forecast 2025-2030 ($ million)
Data Table on UAE - Market size and forecast 2025-2030 ($ million)
Chart on UAE - Year-over-year growth 2025-2030 (%)
Data Table on UAE - Year-over-year growth 2025-2030 (%)

12.6.2 Saudi Arabia - Market size and forecast 2025-2030

Chart on Saudi Arabia - Market size and forecast 2025-2030 ($ million)
Data Table on Saudi Arabia - Market size and forecast 2025-2030 ($ million)
Chart on Saudi Arabia - Year-over-year growth 2025-2030 (%)
Data Table on Saudi Arabia - Year-over-year growth 2025-2030 (%)

12.6.3 South Africa - Market size and forecast 2025-2030

Chart on South Africa - Market size and forecast 2025-2030 ($ million)
Data Table on South Africa - Market size and forecast 2025-2030 ($ million)
Chart on South Africa - Year-over-year growth 2025-2030 (%)
Data Table on South Africa - Year-over-year growth 2025-2030 (%)

12.6.4 Israel - Market size and forecast 2025-2030

Chart on Israel - Market size and forecast 2025-2030 ($ million)
Data Table on Israel - Market size and forecast 2025-2030 ($ million)
Chart on Israel - Year-over-year growth 2025-2030 (%)
Data Table on Israel - Year-over-year growth 2025-2030 (%)

12.6.5 Turkey - Market size and forecast 2025-2030

Chart on Turkey - Market size and forecast 2025-2030 ($ million)
Data Table on Turkey - Market size and forecast 2025-2030 ($ million)
Chart on Turkey - Year-over-year growth 2025-2030 (%)
Data Table on Turkey - Year-over-year growth 2025-2030 (%)

12.7 South America - Market size and forecast 2025-2030

Chart on South America - Market size and forecast 2025-2030 ($ million)
Data Table on South America - Market size and forecast 2025-2030 ($ million)
Chart on South America - Year-over-year growth 2025-2030 (%)
Data Table on South America - Year-over-year growth 2025-2030 (%)
Chart on Regional Comparison - South America
Data Table on Regional Comparison - South America

12.7.1 Brazil - Market size and forecast 2025-2030

Chart on Brazil - Market size and forecast 2025-2030 ($ million)
Data Table on Brazil - Market size and forecast 2025-2030 ($ million)
Chart on Brazil - Year-over-year growth 2025-2030 (%)
Data Table on Brazil - Year-over-year growth 2025-2030 (%)

12.7.2 Argentina - Market size and forecast 2025-2030

Chart on Argentina - Market size and forecast 2025-2030 ($ million)
Data Table on Argentina - Market size and forecast 2025-2030 ($ million)
Chart on Argentina - Year-over-year growth 2025-2030 (%)
Data Table on Argentina - Year-over-year growth 2025-2030 (%)

12.7.3 Chile - Market size and forecast 2025-2030

Chart on Chile - Market size and forecast 2025-2030 ($ million)
Data Table on Chile - Market size and forecast 2025-2030 ($ million)
Chart on Chile - Year-over-year growth 2025-2030 (%)
Data Table on Chile - Year-over-year growth 2025-2030 (%)

12.8 Market opportunity by geography

Market opportunity by geography ($ million)
Data Tables on Market opportunity by geography ($ million)

13. Drivers, Challenges, and Opportunity

13.1 Market drivers

Standardization of communication protocols as catalyst for infrastructure scalability
Expansion of cross-network roaming and consumer accessibility
Integration of smart grid infrastructure and bidirectional power flow

13.2 Market challenges

Technological fragmentation and persistence of legacy infrastructure
Cybersecurity vulnerabilities and data privacy risks in interconnected networks
High capital expenditure and uncertain return on investment for interoperable upgrades

13.3 Impact of drivers and challenges

Impact of drivers and challenges in 2025 and 2030

13.4 Market opportunities

Implementation of universal plug and charge technology and automated user authentication
Expansion of digital roaming hubs and international clearinghouse harmonization
Integration of AI for predictive load balancing and bidirectional interoperability

14. Competitive Landscape

14.1 Overview

14.2

Overview on criticality of inputs and factors of differentiation

14.3 Landscape disruption

Overview on factors of disruption

14.4 Industry risks

Impact of key risks on business

15. Competitive Analysis

15.1 Companies profiled

Companies covered

15.2 Company ranking index

15.3 Market positioning of companies

Matrix on companies position and classification

15.4 ABB Ltd.

ABB Ltd. - Overview
ABB Ltd. - Business segments
ABB Ltd. - Key news
ABB Ltd. - Key offerings
ABB Ltd. - Segment focus
SWOT

15.5 Alfen NV

Alfen NV - Overview
Alfen NV - Product / Service
Alfen NV - Key offerings
SWOT

15.6 AMPECO LTD

AMPECO LTD - Overview
AMPECO LTD - Product / Service
AMPECO LTD - Key offerings
SWOT

15.7 Chargecloud GmbH

Chargecloud GmbH - Overview
Chargecloud GmbH - Product / Service
Chargecloud GmbH - Key offerings
SWOT

15.8 Chargemap SAS

Chargemap SAS - Overview
Chargemap SAS - Product / Service
Chargemap SAS - Key offerings
SWOT

15.9 ChargePoint Holdings Inc.

ChargePoint Holdings Inc. - Overview
ChargePoint Holdings Inc. - Business segments
ChargePoint Holdings Inc. - Key news
ChargePoint Holdings Inc. - Key offerings
ChargePoint Holdings Inc. - Segment focus
SWOT

15.10 Digital Charging Solutions GmbH

Digital Charging Solutions GmbH - Overview
Digital Charging Solutions GmbH - Product / Service
Digital Charging Solutions GmbH - Key offerings
SWOT

15.11 Driivz Ltd.

Driivz Ltd. - Overview
Driivz Ltd. - Product / Service
Driivz Ltd. - Key offerings
SWOT

15.12 GreenFlux Assets B.V.

GreenFlux Assets B.V. - Overview
GreenFlux Assets B.V. - Product / Service
GreenFlux Assets B.V. - Key offerings
SWOT

15.13 Hubject GmbH

Hubject GmbH - Overview
Hubject GmbH - Product / Service
Hubject GmbH - Key offerings
SWOT

15.14 Kempower Oyj

Kempower Oyj - Overview
Kempower Oyj - Product / Service
Kempower Oyj - Key offerings
SWOT

15.15 Last Mile Solutions

Last Mile Solutions - Overview
Last Mile Solutions - Product / Service
Last Mile Solutions - Key offerings
SWOT

15.16 Liikennevirta Oy Ltd.

Liikennevirta Oy Ltd. - Overview
Liikennevirta Oy Ltd. - Product / Service
Liikennevirta Oy Ltd. - Key offerings
SWOT

15.17 Shell plc

Shell plc - Overview
Shell plc - Business segments
Shell plc - Key news
Shell plc - Key offerings
Shell plc - Segment focus
SWOT

15.18 Siemens AG

Siemens AG - Overview
Siemens AG - Business segments
Siemens AG - Key news
Siemens AG - Key offerings
Siemens AG - Segment focus
SWOT

16. Appendix

16.1 Scope of the report

Market definition
Objectives
Notes and caveats

16.2 Inclusions and exclusions checklist

Inclusions checklist
Exclusions checklist

16.3 Currency conversion rates for US$

16.4 Research methodology

16.5 Data procurement

Information sources

16.6 Data validation

16.7 Validation techniques employed for market sizing

16.8 Data synthesis

16.9 360 degree market analysis

16.10 List of abbreviations

Research Methodology

Technavio presents a detailed picture of the market by way of study, synthesis, and summation of data from multiple sources. The analysts have presented the various facets of the market with a particular focus on identifying the key industry influencers. The data thus presented is comprehensive, reliable, and the result of extensive research, both primary and secondary.

INFORMATION SOURCES

Primary sources

  • Manufacturers and suppliers
  • Channel partners
  • Industry experts
  • Strategic decision makers

Secondary sources

  • Industry journals and periodicals
  • Government data
  • Financial reports of key industry players
  • Historical data
  • Press releases

DATA ANALYSIS

Data Synthesis

  • Collation of data
  • Estimation of key figures
  • Analysis of derived insights

Data Validation

  • Triangulation with data models
  • Reference against proprietary databases
  • Corroboration with industry experts

REPORT WRITING

Qualitative

  • Market drivers
  • Market challenges
  • Market trends
  • Five forces analysis

Quantitative

  • Market size and forecast
  • Market segmentation
  • Geographical insights
  • Competitive landscape

Interested in this report?

Get your sample now to see our research methodology and insights!

Download Now

Frequently Asked Questions

EV Charging Interoperability market growth will increase by USD 4605.0 million during 2026-2030.

The EV Charging Interoperability market is expected to grow at a CAGR of 19.2% during 2026-2030.

EV Charging Interoperability market is segmented by Component (Hardware, Software, Services) Type (AC charging, DC fast charging) Application (Public charging, Private charging, Fleet charging)

ABB Ltd., Alfen NV, AMPECO LTD, Chargecloud GmbH, Chargemap SAS, ChargePoint Holdings Inc., Digital Charging Solutions GmbH, Driivz Ltd., Eco Movement, Gireve SAS, GreenFlux Assets B.V., Hubject GmbH, Kempower Oyj, Last Mile Solutions, Liikennevirta Oy Ltd., Road B.V, Shell plc, Siemens AG, Tritium DCFC Limited, Wallbox NV are a few of the key vendors in the EV Charging Interoperability market.

Europe will register the highest growth rate of 35.7% among the other regions. Therefore, the EV Charging Interoperability market in Europe is expected to garner significant business opportunities for the vendors during the forecast period.

Germany, France, The Netherlands, UK, Italy, Spain, US, Canada, Mexico, China, Japan, India, South Korea, Australia, Indonesia, UAE, Saudi Arabia, South Africa, Israel, Turkey, Brazil, Argentina, Chile

  • Standardization of communication protocols as catalyst for infrastructure scalability is the driving factor this market.

The EV Charging Interoperability market vendors should focus on grabbing business opportunities from the Component segment as it accounted for the largest market share in the base year.
RIA - Research AI Assistant
Ask RIA