
Factory Energy Optimization Platform Market Size and Growth Forecast 2026-2030
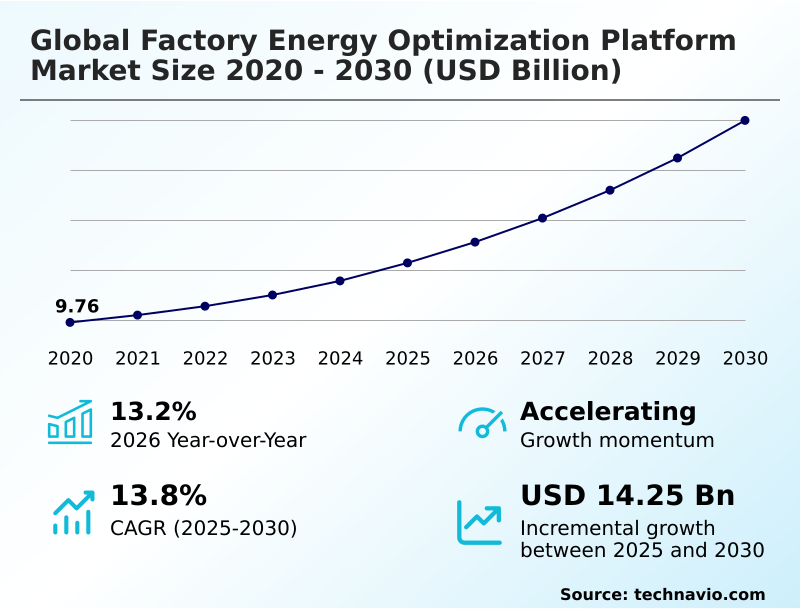
The Factory Energy Optimization Platform Market size was valued at USD 15.71 billion in 2025 growing at a CAGR of 13.8% during the forecast period 2026-2030.
North America accounts for 32.6% of incremental growth during the forecast period. The Software segment by Component was valued at USD 6.21 billion in 2024, while the Cloud-based segment holds the largest revenue share by Deployment.
The market is projected to grow by USD 20.20 billion from 2020 to 2030, with USD 14.25 billion of the growth expected during the forecast period of 2025 to 2030.
Get Key Insights on Market Forecast (PDF) Request Free Sample
Factory Energy Optimization Platform Market Overview
The factory energy optimization platform market is defined by the convergence of industrial IoT (IIoT) and advanced analytics, driven by the need to manage volatile energy costs and meet stringent decarbonization mandates. With North America poised to contribute over 32% of the market's incremental growth, adoption is accelerating in energy-intensive sectors. These platforms move beyond basic supervisory control and data acquisition (SCADA) systems by providing a comprehensive energy management information system (EMIS) that links shop-floor data to enterprise-level sustainability goals. For example, a high-volume automotive die-casting plant deploying an IIoT sensor network can achieve real-time load balancing of its melting furnaces. By using a predictive analytics engine to synchronize high-consumption processes with off-peak electricity rates, the facility can reduce peak demand charges and lower its overall energy cost per unit, demonstrating a clear return on investment tied to operational efficiency.
Drivers, Trends, and Challenges in the Factory Energy Optimization Platform Market
Strategic decision-making in the factory energy optimization platform market is becoming increasingly complex, driven by a year-over-year growth of 13.2%. The choice between cloud vs on-premise energy management software is a critical consideration, weighing the scalability of cloud solutions against the security and control of on-premises deployments, particularly for organizations bound by strict data sovereignty rules.
In practice, implementing digital twins for predictive sustainability allows manufacturers to model energy consumption scenarios, a key step in achieving ISO 50001 certification. For instance, a steel producer focused on reducing peak demand charges in steel plants can use a digital twin to simulate the impact of rescheduling electric arc furnace operations.
This predictive capability is also vital in the automotive sector, where factory energy optimization for automotive manufacturing must account for the high, intermittent power draws of robotic assembly lines and EV charging infrastructure. Similarly, AI driven load balancing for chemical processing plants enables operators to optimize the thermal energy inputs for reactors, ensuring process stability while minimizing natural gas consumption.
The market is projected to see an incremental growth of USD 14249.9, underscoring the significant capital flowing into these advanced industrial technologies.
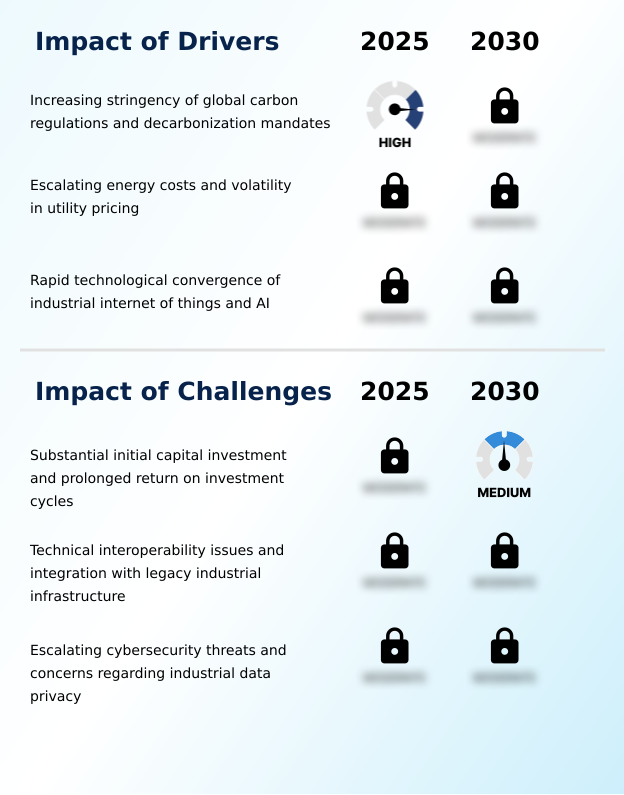
Primary Growth Driver: The primary driver for market growth is the increasing stringency of global carbon regulations and decarbonization mandates, compelling manufacturers to adopt sophisticated digital tools for utility management.
Market growth, accelerating at a year-over-year rate of 13.2%, is primarily propelled by a convergence of regulatory pressure, economic necessity, and technological maturity.
The implementation of industrial decarbonization frameworks, such as the EU's Advanced Manufacturing Carbon Accountability Framework, creates a clear mandate for adoption.
Simultaneously, volatile utility price signals and dynamic industrial pricing models make platforms that can execute automated demand response an economic imperative.
This is made possible by technological advancements like industrial 5G connectivity and edge computing gateways, which enable the low-latency communication required for real-time optimization.
The application of sophisticated machine learning models allows these platforms to learn a factory's unique energy signature and continuously refine its performance.
Emerging Market Trend: A prominent trend is the market's rapid transition from passive monitoring tools to autonomous steering systems driven by generative AI, which actively intervene in industrial processes to minimize waste.
Key market trends are centered on the shift from passive data monitoring to proactive, automated control, a transition most evident in the APAC region, which is projected to have the highest growth rate at 14.9%.
The integration of a generative AI agent into energy platforms is enabling autonomous energy steering, where systems can independently write and execute control scripts to optimize equipment settings in real time. This is complemented by the use of a high-fidelity digital twin to simulate and validate energy-saving strategies before deployment, minimizing operational risk.
Furthermore, the commercial landscape is being reshaped by the rise of performance-based subscription models, which lower the barrier to entry for advanced asset performance management and allow manufacturers to pay for outcomes rather than assets.
Key Industry Challenge: A significant challenge affecting market adoption is the substantial initial capital investment required for hardware, software, and facility retrofitting, combined with prolonged and often complex return on investment calculations.
Significant challenges persist, primarily related to technical integration and security, which can impede widespread adoption. A major hurdle is legacy system integration, as a technical committee recently reported that nearly sixty percent of industrial facilities still use communication protocols incompatible with modern cloud-native software without expensive intermediary hardware.
This fragmentation complicates shop-floor data collection and hinders the effectiveness of optimization algorithms. Furthermore, as these platforms increase OT/IT convergence, they expand the cyber-physical attack surface.
Concerns over data sovereignty compliance and the risk of cyberattacks, as highlighted in warnings from CISA regarding industrial control systems, lead many organizations to hesitate or opt for more costly, isolated on-premises solutions, slowing market penetration.
Explore Full Market Dynamics Analysis Request Free Sample
Factory Energy Optimization Platform Market Segmentation
The factory energy optimization platform industry research report provides comprehensive data including region-wise segment analysis, with forecasts and analysis for the period 2026-2030, as well as historical data from 2020-2024 for the following segments.
Component Segment Analysis
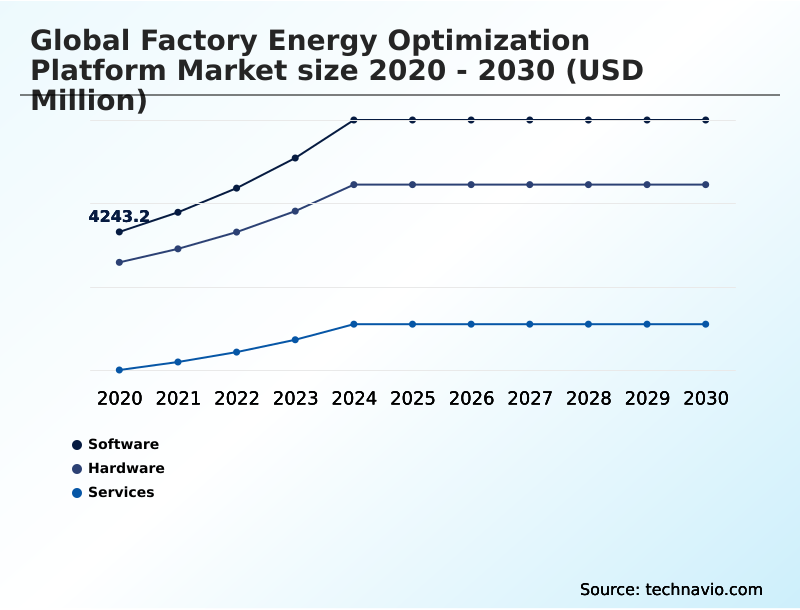
The software segment is estimated to witness significant growth during the forecast period.
The software segment is the intelligence layer of the factory energy optimization platform market, representing approximately 45% of the market in 2025.
Procurement decisions for these platforms are driven by the need for a robust cloud-native architecture that can support a high-fidelity digital twin of factory operations.
Modern platforms leverage a predictive analytics engine to automate energy conservation measures and ensure compliance with carbon disclosure protocols like the EU's Corporate Sustainability Reporting Directive.
Effective asset performance management is achieved by integrating real-time data from shop-floor systems, providing a holistic view of energy consumption.
The ability of software to scale across multiple sites while maintaining data integrity is paramount for large-scale manufacturing enterprises navigating the complexities of modern energy grids.
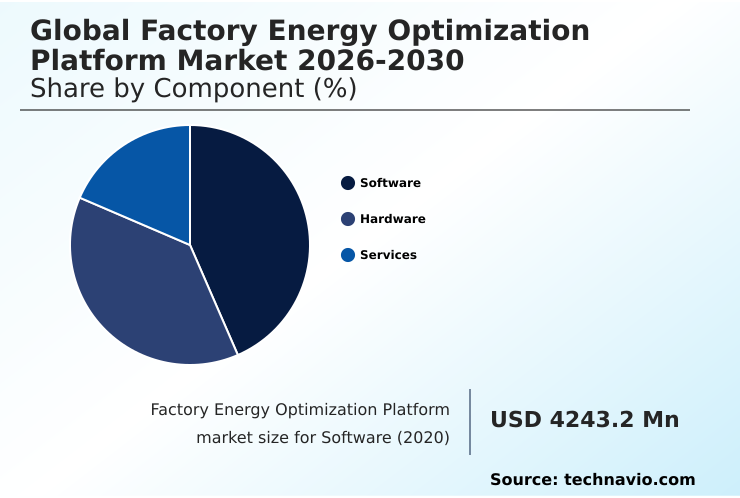
The Software segment was valued at USD 6.21 billion in 2024 and showed a gradual increase during the forecast period.
Factory Energy Optimization Platform Market by Region: North America Leads with 32.6% Growth Share
North America is estimated to contribute 32.6% to the growth of the global market during the forecast period.
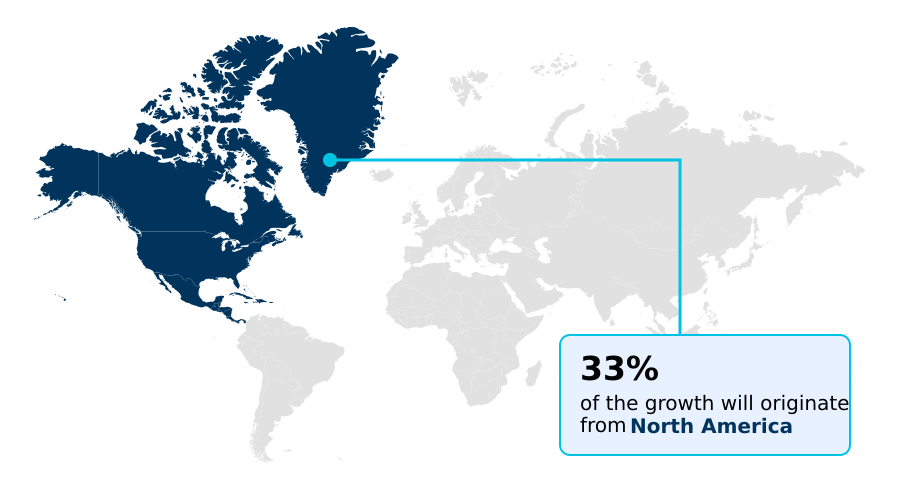
The geographic landscape is characterized by diverse regional priorities, with North America representing 32% of the global opportunity, driven by industrial modernization and grid stability initiatives.
In this region, there is a strong focus on smart grid integration to enable automated demand response programs.
In contrast, APAC, the fastest-growing region, prioritizes scalable solutions for its vast manufacturing base, covering both process industry optimization in chemical plants and discrete manufacturing efficiency in electronics assembly.
Regulatory frameworks, such as the US Department of Energy's industrial decarbonization roadmap, are accelerating the adoption of platforms that provide a verifiable energy audit trail, making energy efficiency a cornerstone of competitive strategy across all major industrial economies.
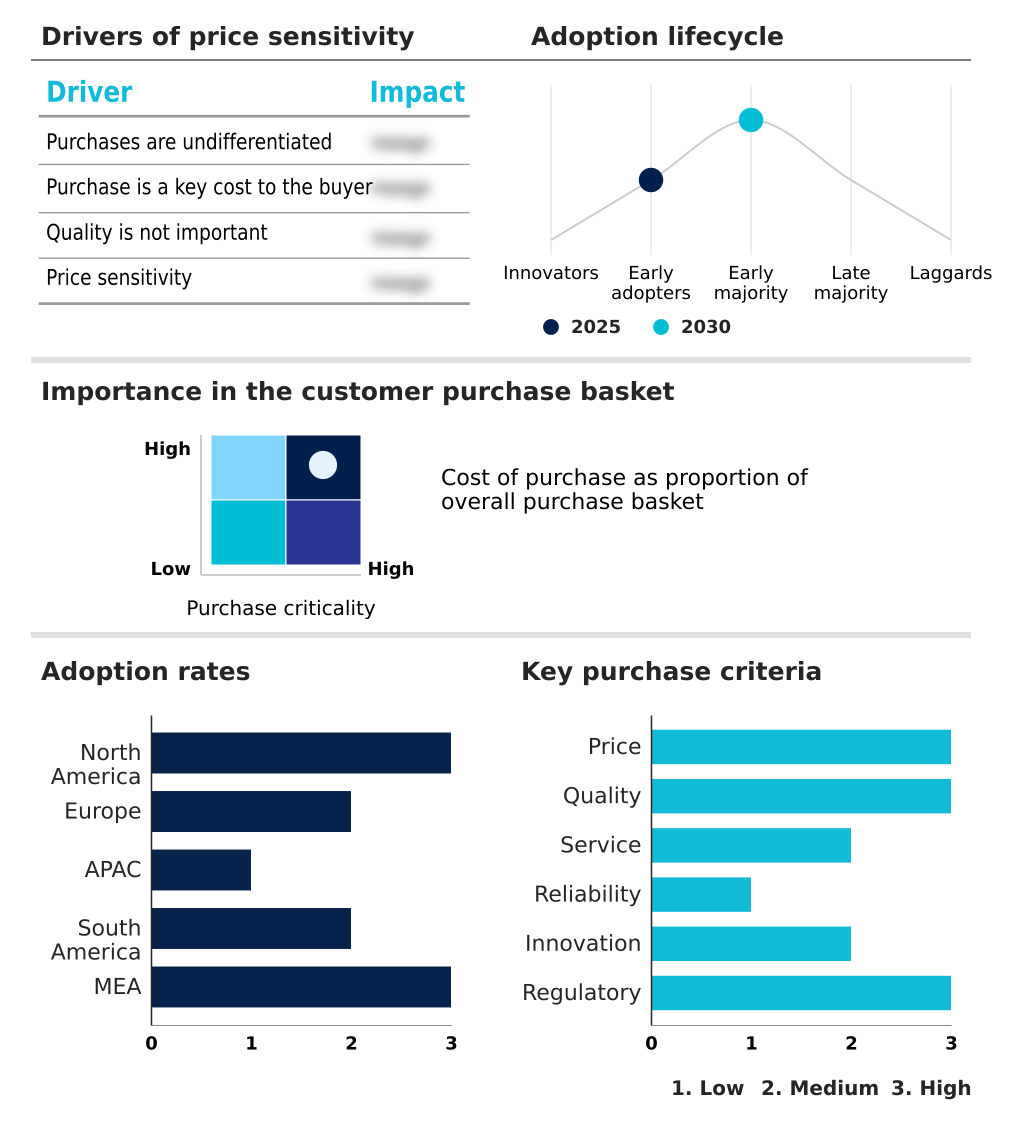
Customer Landscape Analysis for the Factory Energy Optimization Platform Market
The factory energy optimization platform market forecasting report includes the adoption lifecycle of the market, covering from the innovator’s stage to the laggard’s stage. It focuses on adoption rates in different regions based on penetration. Furthermore, the factory energy optimization platform market report also includes key purchase criteria and drivers of price sensitivity to help companies evaluate and develop their market growth analysis strategies.
Competitive Landscape of the Factory Energy Optimization Platform Market
Companies are implementing various strategies, such as strategic alliances, partnerships, mergers and acquisitions, geographical expansion, and product/service launches, to enhance their presence in the factory energy optimization platform market industry.
ABB Ltd. - Offerings include industrial energy management solutions featuring AI-driven analytics, real-time monitoring, and process optimization to reduce consumption, lower costs, and meet sustainability targets.
The industry research and growth report includes detailed analyses of the competitive landscape of the market and information about key companies, including:
- ABB Ltd.
- Advantech Co. Ltd.
- Autodesk Inc.
- Eaton Corp. Plc
- Emerson Electric Co.
- GE Vernova Inc.
- Hitachi Ltd.
- Honeywell International Inc.
- Johnson Controls International
- Microsoft Corp.
- Mitsubishi Electric Corp.
- OMRON Corp.
- Oracle Corp.
- PTC Inc.
- Rockwell Automation Inc.
- SAP SE
- Schneider Electric SE
- Siemens AG
- Yokogawa Electric Corp.
- Zerynth S.p.A
Qualitative and quantitative analysis of companies has been conducted to help clients understand the wider business environment as well as the strengths and weaknesses of key industry players. Data is qualitatively analyzed to categorize companies as pure play, category-focused, industry-focused, and diversified; it is quantitatively analyzed to categorize companies as dominant, leading, strong, tentative, and weak.
Recent Developments in the Factory Energy Optimization Platform Market
- In May, 2025, Rockwell Automation released an autonomous energy steering module that applies reinforcement learning to balance a factory's power demand with its production throughput requirements, enabling facilities to function as flexible loads on the electrical grid.
- In April, 2025, a leading manufacturing alliance in the Asia-Pacific region published a strategic review identifying that mid-market enterprises frequently lack the liquidity required to initiate large-scale digital transformations for energy optimization due to high upfront costs.
- In March, 2025, the European Commission ratified the Advanced Manufacturing Carbon Accountability Framework, a legislative action requiring all heavy industrial facilities to provide hourly data on energy intensity and carbon output, mandating the use of digital optimization tools.
- In February, 2025, Siemens launched a specialized pilot program that utilizes a generative AI agent to write real-time energy-saving scripts for programmable logic controllers, allowing systems to autonomously identify and act upon complex energy-saving opportunities.
Research Analyst Overview: Factory Energy Optimization Platform Market
Boardroom decisions regarding capital expenditure are increasingly influenced by the capabilities of factory energy optimization platforms, which now offer more than just cost savings. The software segment, commanding approximately 45% of the market, has evolved into a critical tool for risk management and regulatory compliance.
The ability to perform accurate carbon intensity forecasting is no longer a niche feature but a core requirement for companies reporting under frameworks like the EU's CSRD. For a COO, this means an investment in an advanced platform is also an investment in de-risking the business from carbon tariffs.
We see this playing out in how platforms are integrating with the programmable logic controller (PLC) on the factory floor, enabling real-time load balancing and peak demand management.
This direct control, guided by machine learning models and aligned with standards like ISO 50001, provides the data-driven certainty needed to justify significant technology upgrades in an environment of fluctuating energy prices and tightening environmental oversight.
Dive into Technavio’s robust research methodology, blending expert interviews, extensive data synthesis, and validated models for unparalleled Factory Energy Optimization Platform Market insights. See full methodology.
| Market Scope | |
|---|---|
| Page number | 303 |
| Base year | 2025 |
| Historic period | 2020-2024 |
| Forecast period | 2026-2030 |
| Growth momentum & CAGR | Accelerate at a CAGR of 13.8% |
| Market growth 2026-2030 | USD 14249.9 million |
| Market structure | Fragmented |
| YoY growth 2025-2026(%) | 13.2% |
| Key countries | US, Canada, Mexico, Germany, UK, France, Italy, Spain, The Netherlands, China, India, Japan, South Korea, Australia, Indonesia, Brazil, Argentina, Colombia, Saudi Arabia, UAE, South Africa, Israel and Turkey |
| Competitive landscape | Leading Companies, Market Positioning of Companies, Competitive Strategies, and Industry Risks |
Factory Energy Optimization Platform Market: Key Questions Answered in This Report
-
What is the expected growth of the Factory Energy Optimization Platform Market between 2026 and 2030?
-
The Factory Energy Optimization Platform Market is expected to grow by USD 14.25 billion during 2026-2030, registering a CAGR of 13.8%. Year-over-year growth in 2026 is estimated at 13.2%%. This acceleration is shaped by increasing stringency of global carbon regulations and decarbonization mandates, which is intensifying demand across multiple end-use verticals covered in the report.
-
-
What segmentation does the market report cover?
-
The report is segmented by Component (Software, Hardware, and Services), Deployment (Cloud-based, On-premises, and Hybrid), End-user (Process industry, and Discrete industry) and Geography (North America, Europe, APAC, South America, Middle East and Africa). Among these, the Software segment is estimated to witness significant growth during the forecast period, driven by rising adoption across key application areas. Each segment includes detailed qualitative and quantitative analysis, along with historical data from 2020-2024 and forecasts through 2030 with year-over-year growth rates.
-
-
Which regions are analyzed in the report?
-
The report covers North America, Europe, APAC, South America and Middle East and Africa. North America is estimated to contribute 32.6% to market growth during the forecast period. Country-level analysis includes US, Canada, Mexico, Germany, UK, France, Italy, Spain, The Netherlands, China, India, Japan, South Korea, Australia, Indonesia, Brazil, Argentina, Colombia, Saudi Arabia, UAE, South Africa, Israel and Turkey, with dedicated market size tables and year-over-year growth for each.
-
-
What are the key growth drivers and market challenges?
-
The primary driver is increasing stringency of global carbon regulations and decarbonization mandates, which is accelerating investment and industry demand. The main challenge is substantial initial capital investment and prolonged return on investment cycles, creating operational barriers for key market participants. The report quantifies the impact of each driver and challenge across 2026 and 2030 with comparative analysis.
-
-
Who are the major players in the Factory Energy Optimization Platform Market?
-
Key vendors include ABB Ltd., Advantech Co. Ltd., Autodesk Inc., Eaton Corp. Plc, Emerson Electric Co., GE Vernova Inc., Hitachi Ltd., Honeywell International Inc., Johnson Controls International, Microsoft Corp., Mitsubishi Electric Corp., OMRON Corp., Oracle Corp., PTC Inc., Rockwell Automation Inc., SAP SE, Schneider Electric SE, Siemens AG, Yokogawa Electric Corp. and Zerynth S.p.A. The report provides qualitative and quantitative analysis categorizing companies as dominant, leading, strong, tentative, and weak based on their market positioning. Company profiles include business segment analysis, SWOT assessment, key offerings, and recent strategic developments.
-
Factory Energy Optimization Platform Market Research Insights
Market dynamics are increasingly shaped by the need to bridge the gap between modern cloud platforms and legacy industrial infrastructure. Integrating a new energy orchestration system with an existing operational technology (OT) network presents significant legacy system integration challenges.
For instance, a facility manager must ensure that data from an IIoT sensor network can be securely transmitted without creating new vulnerabilities on the cyber-physical attack surface, a concern highlighted in recent CISA guidance.
The choice between deployment models is critical; while cloud-based platforms represent a larger market segment than on-premises solutions, many organizations in sectors with high data sovereignty compliance needs opt for on-premises or hybrid models to maintain absolute control over sensitive production data.
We can help! Our analysts can customize this factory energy optimization platform market research report to meet your requirements.
 RIA -
RIA - 
