Farm Management Software Market Analysis North America, Europe, APAC, Middle East and Africa, South America - US, Canada, China, UK, Germany - Size and Forecast 2024-2028

Farm Management Software Market Analysis North America, Europe, APAC, Middle East and Africa, South America - US, Canada, China, UK, Germany - Size and Forecast 2024-2028

Published: Feb 2024 180 Pages SKU: IRTNTR70059

Market Overview at a Glance

$2.13 B
Market Opportunity
11.29%
CAGR
10.49
YoY growth 2023-2024(%)

Farm Management Software Market Size 2024-2028

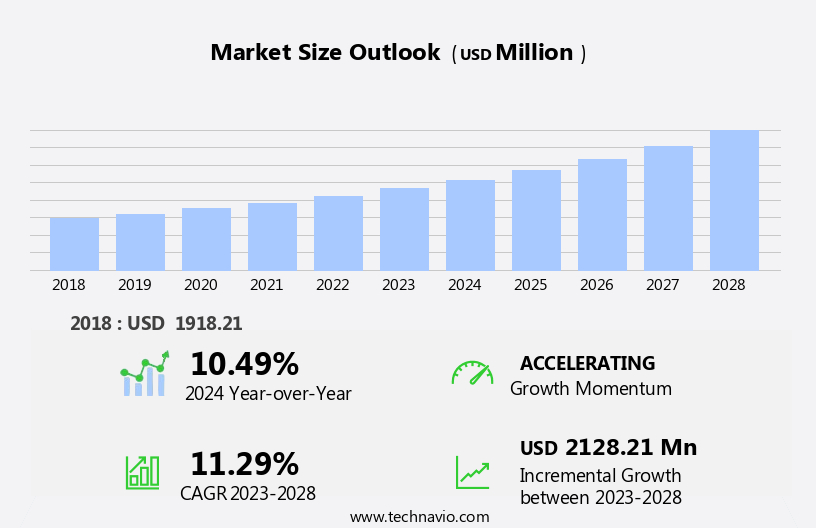
The farm management software market size is forecast to increase by USD 2.13 billion at a CAGR of 11.29% between 2023 and 2028.

  • The market is experiencing significant growth, driven by the increasing popularity of precision farming. This approach to agriculture utilizes data-driven insights to optimize crop yields and reduce operational costs. Another trend is the use of farm management software for virtual fencing, enabling farmers to manage livestock more efficiently and effectively as well as facilitating livestock monitoring
  • However, challenges remain, such as the lack of internet connectivity in remote areas, which can hinder the adoption of these technologies. Despite these hurdles, the market is poised for continued expansion as farmers seek to improve productivity and profitability through technology integration.

What will be the Size of the Farm Management Software Market During the Forecast Period?

Farm Management Software Market Size

 Request Free Sample

How is this Farm Management Software Industry segmented and which is the largest segment?

The farm management software industry research report provides comprehensive data (region-wise segment analysis), with forecasts and estimates in "USD billion" for the period 2024-2028, as well as historical data from 2018-2022 for the following segments.

  • Application
    • Precision farming
    • Precision livestock
    • Precision aquaculture
    • Others
  • Deployment
    • Cloud-based
    • Web-based
  • Geography
    • North America
      • Canada
      • US
    • Europe
      • Germany
      • UK
    • APAC
      • China
    • Middle East and Africa
    • South America

By Application Insights

  • The precision farming segment is estimated to witness significant growth during the forecast period.

Farm management software is experiencing significant growth due to the increasing implementation of precision farming techniques in agriculture. Yield monitoring, a component of precision farming, enables farmers to make informed decisions based on data collected through sensors and agricultural drones. This data is utilized for field mapping, allowing for the variable application of irrigation and fertilizers. Identifying high- and low-performing areas of a field is facilitated through yield monitoring and field mapping. Key providers of yield monitoring software for farm management are Ag Leader Technology and Trimble Inc. Additionally, farm management software is essential for livestock monitoring, precision aquaculture, smart greenhouses, vertical farming, and indoor farming.

Rapid urbanization, rising population, water shortage issues, climate changes, recession, farming equipment, labor shortages, investment scenario, and the requirement for big data analytics are driving the demand for advanced farm management software. This software assists in crop health and growth monitoring, harvest time optimization, profitability analysis, farm office management, crop yields enhancement, fertilizer requirement estimation, soil mapping, and weather pattern analysis. Animal health monitoring is also facilitated through farm management software, ensuring sustainable farming practices.

Farm Management Software Market Size

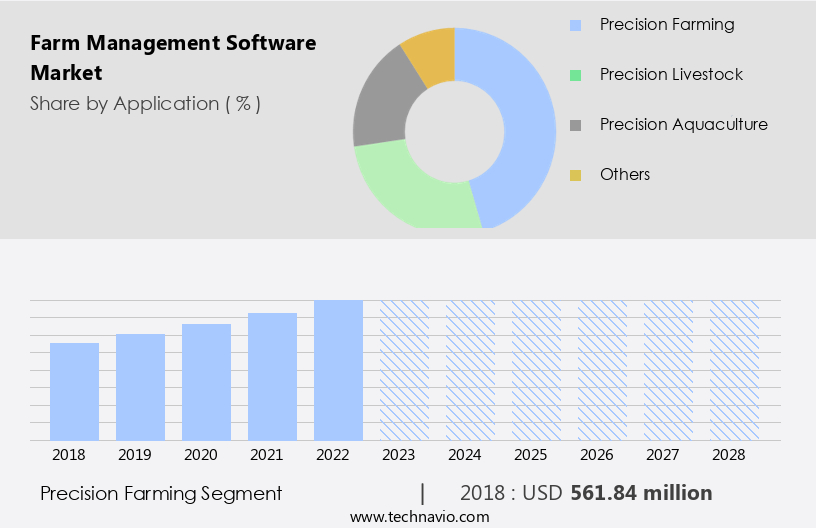
Get a glance at the Farm Management Software Industry report of share of various segments Request Free Sample

The Precision farming segment was valued at USD 561.84 million in 2018 and showed a gradual increase during the forecast period.

Regional Analysis

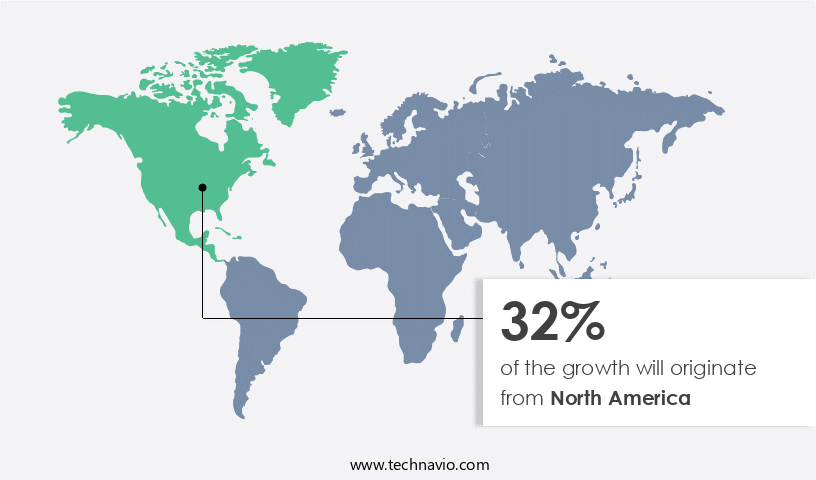
  • North America is estimated to contribute 32% to the growth of the global market during the forecast period.

Technavio's analysts have elaborately explained the regional trends and drivers that shape the market during the forecast period.

Farm Management Software Market Share by Geography

For more insights on the market share of various regions, Request Free Sample

The US is a significant player in the North American market, driven by its leadership in technology adoption withIn the agriculture sector. Precision farming, a key application of farm management software, has seen widespread usage in the US due to its ability to optimize crop yields and reduce resource consumption. Major American companies, such as AGCO Corp., Ag Leader Technology, Deere and Co., and Trimble Inc., are at the forefront of this trend, offering advanced solutions with features like big data analytics and precision farming integration. Other factors fueling the market include rapid urbanization, rising population, water shortage issues, climate changes, recession, farming equipment needs, labor shortages, and investment scenarios.

Farm management software enables farmers to monitor crop health, growth, and harvest time, optimizing profitability through data-driven insights. Additionally, it facilitates livestock monitoring, precision aquaculture, smart greenhouses, vertical farming, and indoor farming operations. Farm offices can manage fertilizer requirements, soil mapping, and weather patterns, ensuring efficient and sustainable farming practices.

Market Dynamics

Our  researchers analyzed the data with 2023 as the base year, along with the key drivers, trends, and challenges. A holistic analysis of drivers will help companies refine their marketing strategies to gain a competitive advantage.

What are the key market drivers leading to the rise In the adoption of Farm Management Software Industry?

Growing popularity of precision farming is the key driver of the market.

  • Precision farming is revolutionizing the agricultural industry through the integration of machine learning and advanced software tools. These solutions optimize farm production with minimal inputs, addressing challenges posed by rapid urbanization, rising population, water shortage issues, and climate changes. Software applications are instrumental in managing various aspects of farming, including crop health and growth monitoring, harvest time prediction, and fertilizer requirement estimation. Precision farming software tools collect data from various sources, such as soil mapping, weather patterns, and crop yields, to provide farmers with actionable insights. For instance, Trimble Ag Software offers features for moisture, variety, and load tracking for crops grown on farms.
  • Livestock monitoring is another crucial application of precision farming software, ensuring animal health and welfare. Moreover, precision farming extends to innovative farming methods like smart greenhouses, vertical farming, and indoor farming. Big data analytics plays a pivotal role In these modern farming practices, enabling farmers to make informed decisions regarding crop management and resource allocation. The compatibility of these software tools with multiple devices, such as smartphones and tablets, offers farmers the convenience of accessing real-time data on the go. Farm offices can benefit significantly from precision farming software, streamlining tasks and enhancing overall farm management efficiency. In the context of livestock farming, poultry and swine farms can leverage these tools to monitor animal health, manage feed requirements, and optimize production.
  • Ultimately, precision farming software solutions contribute to improved profitability and sustainability In the face of labor shortages and economic recessions.

What are the market trends shaping the Farm Management Software Industry?

Usage of farm management software for virtual fencing is the upcoming market trend.

  • Farm management software is a valuable investment for modern agricultural businesses, particularly In the context of machine learning and precision farming. This technology enables farmers to optimize resources and enhance productivity through advanced analytics and real-time monitoring. Precision farming, including livestock monitoring, is revolutionizing the industry. Virtual fencing technology, for instance, utilizes GPS and Internet-connected collars for livestock to eliminate the need for physical fences. This not only saves on labor and maintenance costs but also improves animal containment and welfare. Moreover, precision aquaculture, smart greenhouses, vertical farming, and indoor farming are gaining traction in response to rapid urbanization, rising population, water shortage issues, and climate changes.
  • These farming methods rely heavily on data analysis for growth monitoring, harvest time prediction, and profitability assessment. Big data analytics plays a crucial role in farming, providing insights into crop health, fertilizer requirements, soil mapping, weather patterns, and animal health. Farm offices can access this data in real time, making informed decisions to optimize yields and reduce costs. The farming equipment sector is also adapting to these trends, integrating machine learning and automation to streamline operations. Labor shortages, a common challenge for the industry, are being addressed through technology. In summary, farm management software is a vital tool for agricultural businesses seeking to remain competitive and profitable In the face of evolving market dynamics.

What challenges does the Farm Management Software Industry face during its growth?

Lack of internet connectivity in remote areas is a key challenge affecting the industry growth.

  • The farming industry is experiencing significant transformation due to technological advancements and changing market dynamics. Machine learning and big data analytics are revolutionizing precision farming, enabling farmers to optimize crop health, growth monitoring, fertilizer requirement, soil mapping, and weather patterns. Precision farming extends to livestock monitoring, precision aquaculture, smart greenhouses, vertical farming, and indoor farming. Rapid urbanization, rising population, water shortage issues, and climate changes pose challenges for the farming sector. Farmers must adapt to these conditions to ensure profitability and maintain farm offices efficiently. Farm management software plays a crucial role in addressing these challenges. Advanced features, such as real-time animal health monitoring, harvest time optimization, and growth monitoring, are essential for poultry farms and swine farms.
  • However, Internet connectivity remains a barrier for farmers in rural areas. With approximately 75% of Internet users in Europe and North America and 25% in other regions, the digital divide persists. Farmers in remote areas often lack access to fast Internet connections necessary for advanced software features. Addressing this challenge will be crucial for the investment scenario in farm management software.

Exclusive Customer Landscape

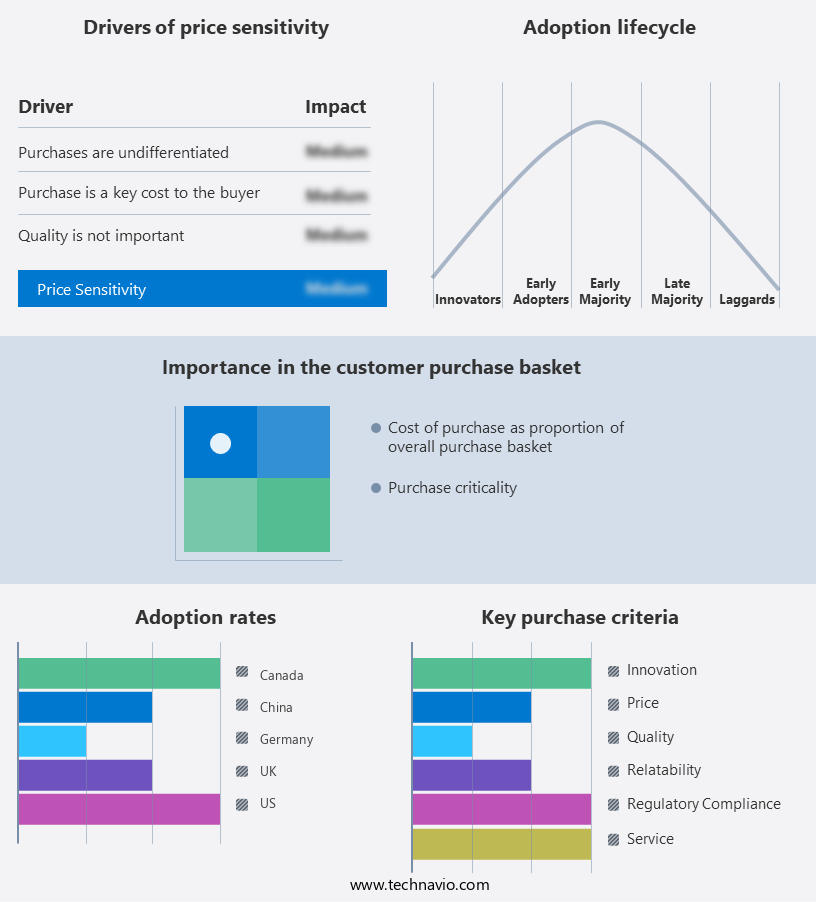
The farm management software market forecasting report includes the adoption lifecycle of the market, covering from the innovator's stage to the laggard's stage. It focuses on adoption rates in different regions based on penetration. Furthermore, the farm management software market report also includes key purchase criteria and drivers of price sensitivity to help companies evaluate and develop their market growth analysis strategies.

Farm Management Software Market Share by Geography

 Customer Landscape

Key Companies & Market Insights

Companies are implementing various strategies, such as strategic alliances, farm management software market forecast, partnerships, mergers and acquisitions, geographical expansion, and product/service launches, to enhance their presence In the industry.

Ag Leader Technology - Farm management software solutions, including SMS software, facilitate data-driven decision-making in agriculture. This technology gathers information from planting to harvest, transforming raw field data into intelligent management insights. By leveraging advanced analytics and real-time data processing, farmers can optimize their operations, improve yields, and enhance overall productivity.

The industry research and growth report includes detailed analyses of the competitive landscape of the market and information about key companies, including:

  • Ag Leader Technology
  • AGCO Corp.
  • Agrivi d.o.o.
  • Bayer AG
  • CNH Industrial NV
  • Cropin Technology Solutions Pvt. Ltd.
  • Deere and Co.
  • Fairfax Financial Holdings Ltd.
  • GEA Group AG
  • International Business Machines Corp.
  • Iteris Inc.
  • Kubota Corp.
  • Madison One Holdings LLC
  • Nofence AS
  • RELX Plc
  • SemiosBio Technologies Inc.
  • Syngenta Crop Protection AG
  • Topcon Corp.
  • Trimble Inc.
  • TSI Inc.
  • Microsoft Corp.

Qualitative and quantitative analysis of companies has been conducted to help clients understand the wider business environment as well as the strengths and weaknesses of key industry players. Data is qualitatively analyzed to categorize companies as pure play, category-focused, industry-focused, and diversified; it is quantitatively analyzed to categorize companies as dominant, leading, strong, tentative, and weak.

Research Analyst Overview

The market is experiencing significant growth due to the increasing adoption of technology in agriculture. Precision farming techniques, which utilize machine learning algorithms to optimize crop yields, are driving demand for advanced software solutions. These technologies enable farmers to monitor crop health, growth, and fertilizer requirements in real time, leading to increased profitability and efficiency. Moreover, the rise of livestock monitoring systems is also contributing to the growth of the market. These systems allow farmers to track animal health and productivity, optimizing feed management and reducing labor costs. Precision aquaculture is another emerging sector, where software solutions enable farmers to monitor water quality, temperature, and fish growth, ensuring optimal conditions for production.

The trend towards smart greenhouses and vertical farming is further fueling the demand for farm management software. These modern farming methods require precise control over environmental conditions and automation of various processes. Software solutions enable farmers to monitor and adjust temperature, humidity, light, and nutrient levels, ensuring optimal growing conditions and higher yields. Rapid urbanization and a rising population are putting pressure on farmers to increase production while minimizing water usage and reducing their carbon footprint. Farm management software can help farmers address these challenges by providing real-time data on water usage, weather patterns, and soil mapping. Big data analytics can also be used to optimize irrigation schedules and fertilizer applications, reducing water waste and increasing crop yields.

Climate changes and recession are also impacting the farming industry, making it essential for farmers to adapt to new challenges. Farm management software can help farmers mitigate the effects of climate changes by providing real-time data on weather patterns and soil conditions. Additionally, during economic downturns, software solutions can help farmers optimize their operations and reduce costs, making their businesses more resilient. Farm offices are increasingly relying on farm management software to streamline their operations and improve profitability. These solutions enable farmers to manage their equipment inventory, track labor hours, and analyze financial data. Crop yields and harvest times can also be monitored and analyzed, allowing farmers to make data-driven decisions and optimize their production cycles.

The market is experiencing significant growth due to the increasing adoption of technology in agriculture. Precision farming, livestock monitoring, smart greenhouses, and vertical farming are all driving demand for advanced software solutions. Farmers are using these technologies to optimize crop yields, reduce labor costs, and address the challenges of climate changes, water shortages, and economic downturns. Farm management software is becoming an essential tool for farmers to remain competitive and profitable in an ever-changing agricultural landscape.

Market Scope

Report Coverage

Details

Page number

180

Base year

2023

Historic period

2018-2022

Forecast period

2024-2028

Growth momentum & CAGR

Accelerate at a CAGR of 11.29%

Market growth 2024-2028

USD 2.13 billion

Market structure

Fragmented

YoY growth 2023-2024(%)

10.49

Key countries

US, Canada, China, UK, and Germany

Competitive landscape

Leading Companies, Market Positioning of Companies, Competitive Strategies, and Industry Risks

Request Free Sample

What are the Key Data Covered in this Farm Management Software Market Research and Growth Report?

  • CAGR of the Farm Management Software industry during the forecast period
  • Detailed information on factors that will drive the growth and forecasting between 2024 and 2028
  • Precise estimation of the size of the market and its contribution of the industry in focus to the parent market
  • Accurate predictions about upcoming growth and trends and changes in consumer behaviour
  • Growth of the market across North America, Europe, APAC, Middle East and Africa, and South America
  • Thorough analysis of the market's competitive landscape and detailed information about companies
  • Comprehensive analysis of factors that will challenge the farm management software market growth of industry companies

We can help! Our analysts can customize this farm management software market research report to meet your requirements.

Get in touch

1 Executive Summary

  • 1.1 Market overview
    • Exhibit 01: Executive Summary – Chart on Market Overview
    • Exhibit 02: Executive Summary – Data Table on Market Overview
    • Exhibit 03: Executive Summary – Chart on Global Market Characteristics
    • Exhibit 04: Executive Summary – Chart on Market by Geography
    • Exhibit 05: Executive Summary – Chart on Market Segmentation by Application
    • Exhibit 06: Executive Summary – Chart on Market Segmentation by Deployment
    • Exhibit 07: Executive Summary – Chart on Incremental Growth
    • Exhibit 08: Executive Summary – Data Table on Incremental Growth
    • Exhibit 09: Executive Summary – Chart on Vendor Market Positioning

2 Market Landscape

  • 2.1 Market ecosystem
    • Exhibit 10: Parent market
    • Exhibit 11: Market Characteristics

3 Market Sizing

  • 3.1 Market definition
    • Exhibit 12: Offerings of vendors included in the market definition
  • 3.2 Market segment analysis
    • Exhibit 13: Market segments
  • 3.3 Market size 2023
    • 3.4 Market outlook: Forecast for 2023-2028
      • Exhibit 14: Chart on Global - Market size and forecast 2023-2028 ($ million)
      • Exhibit 15: Data Table on Global - Market size and forecast 2023-2028 ($ million)
      • Exhibit 16: Chart on Global Market: Year-over-year growth 2023-2028 (%)
      • Exhibit 17: Data Table on Global Market: Year-over-year growth 2023-2028 (%)

    4 Historic Market Size

    • 4.1 Global farm management software market 2018 - 2022
      • Exhibit 18: Historic Market Size – Data Table on global farm management software market 2018 - 2022 ($ million)
    • 4.2 Application Segment Analysis 2018 - 2022
      • Exhibit 19: Historic Market Size – Application Segment 2018 - 2022 ($ million)
    • 4.3 Deployment Segment Analysis 2018 - 2022
      • Exhibit 20: Historic Market Size – Deployment Segment 2018 - 2022 ($ million)
    • 4.4 Geography Segment Analysis 2018 - 2022
      • Exhibit 21: Historic Market Size – Geography Segment 2018 - 2022 ($ million)
    • 4.5 Country Segment Analysis 2018 - 2022
      • Exhibit 22: Historic Market Size – Country Segment 2018 - 2022 ($ million)

    5 Five Forces Analysis

    • 5.1 Five forces summary
      • Exhibit 23: Five forces analysis - Comparison between 2023 and 2028
    • 5.2 Bargaining power of buyers
      • Exhibit 24: Chart on Bargaining power of buyers – Impact of key factors 2023 and 2028
    • 5.3 Bargaining power of suppliers
      • Exhibit 25: Bargaining power of suppliers – Impact of key factors in 2023 and 2028
    • 5.4 Threat of new entrants
      • Exhibit 26: Threat of new entrants – Impact of key factors in 2023 and 2028
    • 5.5 Threat of substitutes
      • Exhibit 27: Threat of substitutes – Impact of key factors in 2023 and 2028
    • 5.6 Threat of rivalry
      • Exhibit 28: Threat of rivalry – Impact of key factors in 2023 and 2028
    • 5.7 Market condition
      • Exhibit 29: Chart on Market condition - Five forces 2023 and 2028

    6 Market Segmentation by Application

    • 6.1 Market segments
      • Exhibit 30: Chart on Application - Market share 2023-2028 (%)
      • Exhibit 31: Data Table on Application - Market share 2023-2028 (%)
    • 6.2 Comparison by Application
      • Exhibit 32: Chart on Comparison by Application
      • Exhibit 33: Data Table on Comparison by Application
    • 6.3 Precision farming - Market size and forecast 2023-2028
      • Exhibit 34: Chart on Precision farming - Market size and forecast 2023-2028 ($ million)
      • Exhibit 35: Data Table on Precision farming - Market size and forecast 2023-2028 ($ million)
      • Exhibit 36: Chart on Precision farming - Year-over-year growth 2023-2028 (%)
      • Exhibit 37: Data Table on Precision farming - Year-over-year growth 2023-2028 (%)
    • 6.4 Precision livestock - Market size and forecast 2023-2028
      • Exhibit 38: Chart on Precision livestock - Market size and forecast 2023-2028 ($ million)
      • Exhibit 39: Data Table on Precision livestock - Market size and forecast 2023-2028 ($ million)
      • Exhibit 40: Chart on Precision livestock - Year-over-year growth 2023-2028 (%)
      • Exhibit 41: Data Table on Precision livestock - Year-over-year growth 2023-2028 (%)
    • 6.5 Precision aquaculture - Market size and forecast 2023-2028
      • Exhibit 42: Chart on Precision aquaculture - Market size and forecast 2023-2028 ($ million)
      • Exhibit 43: Data Table on Precision aquaculture - Market size and forecast 2023-2028 ($ million)
      • Exhibit 44: Chart on Precision aquaculture - Year-over-year growth 2023-2028 (%)
      • Exhibit 45: Data Table on Precision aquaculture - Year-over-year growth 2023-2028 (%)
    • 6.6 Others - Market size and forecast 2023-2028
      • Exhibit 46: Chart on Others - Market size and forecast 2023-2028 ($ million)
      • Exhibit 47: Data Table on Others - Market size and forecast 2023-2028 ($ million)
      • Exhibit 48: Chart on Others - Year-over-year growth 2023-2028 (%)
      • Exhibit 49: Data Table on Others - Year-over-year growth 2023-2028 (%)
    • 6.7 Market opportunity by Application
      • Exhibit 50: Market opportunity by Application ($ million)
      • Exhibit 51: Data Table on Market opportunity by Application ($ million)

    7 Market Segmentation by Deployment

    • 7.1 Market segments
      • Exhibit 52: Chart on Deployment - Market share 2023-2028 (%)
      • Exhibit 53: Data Table on Deployment - Market share 2023-2028 (%)
    • 7.2 Comparison by Deployment
      • Exhibit 54: Chart on Comparison by Deployment
      • Exhibit 55: Data Table on Comparison by Deployment
    • 7.3 Cloud-based - Market size and forecast 2023-2028
      • Exhibit 56: Chart on Cloud-based - Market size and forecast 2023-2028 ($ million)
      • Exhibit 57: Data Table on Cloud-based - Market size and forecast 2023-2028 ($ million)
      • Exhibit 58: Chart on Cloud-based - Year-over-year growth 2023-2028 (%)
      • Exhibit 59: Data Table on Cloud-based - Year-over-year growth 2023-2028 (%)
    • 7.4 Web-based - Market size and forecast 2023-2028
      • Exhibit 60: Chart on Web-based - Market size and forecast 2023-2028 ($ million)
      • Exhibit 61: Data Table on Web-based - Market size and forecast 2023-2028 ($ million)
      • Exhibit 62: Chart on Web-based - Year-over-year growth 2023-2028 (%)
      • Exhibit 63: Data Table on Web-based - Year-over-year growth 2023-2028 (%)
    • 7.5 Market opportunity by Deployment
      • Exhibit 64: Market opportunity by Deployment ($ million)
      • Exhibit 65: Data Table on Market opportunity by Deployment ($ million)

    8 Customer Landscape

    • 8.1 Customer landscape overview
      • Exhibit 66: Analysis of price sensitivity, lifecycle, customer purchase basket, adoption rates, and purchase criteria

    9 Geographic Landscape

    • 9.1 Geographic segmentation
      • Exhibit 67: Chart on Market share by geography 2023-2028 (%)
      • Exhibit 68: Data Table on Market share by geography 2023-2028 (%)
    • 9.2 Geographic comparison
      • Exhibit 69: Chart on Geographic comparison
      • Exhibit 70: Data Table on Geographic comparison
    • 9.3 North America - Market size and forecast 2023-2028
      • Exhibit 71: Chart on North America - Market size and forecast 2023-2028 ($ million)
      • Exhibit 72: Data Table on North America - Market size and forecast 2023-2028 ($ million)
      • Exhibit 73: Chart on North America - Year-over-year growth 2023-2028 (%)
      • Exhibit 74: Data Table on North America - Year-over-year growth 2023-2028 (%)
    • 9.4 Europe - Market size and forecast 2023-2028
      • Exhibit 75: Chart on Europe - Market size and forecast 2023-2028 ($ million)
      • Exhibit 76: Data Table on Europe - Market size and forecast 2023-2028 ($ million)
      • Exhibit 77: Chart on Europe - Year-over-year growth 2023-2028 (%)
      • Exhibit 78: Data Table on Europe - Year-over-year growth 2023-2028 (%)
    • 9.5 APAC - Market size and forecast 2023-2028
      • Exhibit 79: Chart on APAC - Market size and forecast 2023-2028 ($ million)
      • Exhibit 80: Data Table on APAC - Market size and forecast 2023-2028 ($ million)
      • Exhibit 81: Chart on APAC - Year-over-year growth 2023-2028 (%)
      • Exhibit 82: Data Table on APAC - Year-over-year growth 2023-2028 (%)
    • 9.6 Middle East and Africa - Market size and forecast 2023-2028
      • Exhibit 83: Chart on Middle East and Africa - Market size and forecast 2023-2028 ($ million)
      • Exhibit 84: Data Table on Middle East and Africa - Market size and forecast 2023-2028 ($ million)
      • Exhibit 85: Chart on Middle East and Africa - Year-over-year growth 2023-2028 (%)
      • Exhibit 86: Data Table on Middle East and Africa - Year-over-year growth 2023-2028 (%)
    • 9.7 South America - Market size and forecast 2023-2028
      • Exhibit 87: Chart on South America - Market size and forecast 2023-2028 ($ million)
      • Exhibit 88: Data Table on South America - Market size and forecast 2023-2028 ($ million)
      • Exhibit 89: Chart on South America - Year-over-year growth 2023-2028 (%)
      • Exhibit 90: Data Table on South America - Year-over-year growth 2023-2028 (%)
    • 9.8 US - Market size and forecast 2023-2028
      • Exhibit 91: Chart on US - Market size and forecast 2023-2028 ($ million)
      • Exhibit 92: Data Table on US - Market size and forecast 2023-2028 ($ million)
      • Exhibit 93: Chart on US - Year-over-year growth 2023-2028 (%)
      • Exhibit 94: Data Table on US - Year-over-year growth 2023-2028 (%)
    • 9.9 UK - Market size and forecast 2023-2028
      • Exhibit 95: Chart on UK - Market size and forecast 2023-2028 ($ million)
      • Exhibit 96: Data Table on UK - Market size and forecast 2023-2028 ($ million)
      • Exhibit 97: Chart on UK - Year-over-year growth 2023-2028 (%)
      • Exhibit 98: Data Table on UK - Year-over-year growth 2023-2028 (%)
    • 9.10 Germany - Market size and forecast 2023-2028
      • Exhibit 99: Chart on Germany - Market size and forecast 2023-2028 ($ million)
      • Exhibit 100: Data Table on Germany - Market size and forecast 2023-2028 ($ million)
      • Exhibit 101: Chart on Germany - Year-over-year growth 2023-2028 (%)
      • Exhibit 102: Data Table on Germany - Year-over-year growth 2023-2028 (%)
    • 9.11 China - Market size and forecast 2023-2028
      • Exhibit 103: Chart on China - Market size and forecast 2023-2028 ($ million)
      • Exhibit 104: Data Table on China - Market size and forecast 2023-2028 ($ million)
      • Exhibit 105: Chart on China - Year-over-year growth 2023-2028 (%)
      • Exhibit 106: Data Table on China - Year-over-year growth 2023-2028 (%)
    • 9.12 Canada - Market size and forecast 2023-2028
      • Exhibit 107: Chart on Canada - Market size and forecast 2023-2028 ($ million)
      • Exhibit 108: Data Table on Canada - Market size and forecast 2023-2028 ($ million)
      • Exhibit 109: Chart on Canada - Year-over-year growth 2023-2028 (%)
      • Exhibit 110: Data Table on Canada - Year-over-year growth 2023-2028 (%)
    • 9.13 Market opportunity by geography
      • Exhibit 111: Market opportunity by geography ($ million)
      • Exhibit 112: Data Tables on Market opportunity by geography ($ million)

    10 Drivers, Challenges, and Trends

    • 10.1 Market drivers
      • 10.2 Market challenges
        • 10.3 Impact of drivers and challenges
          • Exhibit 113: Impact of drivers and challenges in 2023 and 2028
        • 10.4 Market trends

          11 Vendor Landscape

          • 11.1 Overview
            • 11.2 Vendor landscape
              • Exhibit 114: Overview on Criticality of inputs and Factors of differentiation
            • 11.3 Landscape disruption
              • Exhibit 115: Overview on factors of disruption
            • 11.4 Industry risks
              • Exhibit 116: Impact of key risks on business

            12 Vendor Analysis

            • 12.1 Vendors covered
              • Exhibit 117: Vendors covered
            • 12.2 Market positioning of vendors
              • Exhibit 118: Matrix on vendor position and classification
            • 12.3 Ag Leader Technology
              • Exhibit 119: Ag Leader Technology - Overview
              • Exhibit 120: Ag Leader Technology - Product / Service
              • Exhibit 121: Ag Leader Technology - Key offerings
            • 12.4 AGCO Corp.
              • Exhibit 122: AGCO Corp. - Overview
              • Exhibit 123: AGCO Corp. - Business segments
              • Exhibit 124: AGCO Corp. - Key news
              • Exhibit 125: AGCO Corp. - Key offerings
              • Exhibit 126: AGCO Corp. - Segment focus
            • 12.5 Agrivi d.o.o.
              • Exhibit 127: Agrivi d.o.o. - Overview
              • Exhibit 128: Agrivi d.o.o. - Product / Service
              • Exhibit 129: Agrivi d.o.o. - Key offerings
            • 12.6 Bayer AG
              • Exhibit 130: Bayer AG - Overview
              • Exhibit 131: Bayer AG - Business segments
              • Exhibit 132: Bayer AG - Key news
              • Exhibit 133: Bayer AG - Key offerings
              • Exhibit 134: Bayer AG - Segment focus
            • 12.7 CNH Industrial NV
              • Exhibit 135: CNH Industrial NV - Overview
              • Exhibit 136: CNH Industrial NV - Business segments
              • Exhibit 137: CNH Industrial NV - Key news
              • Exhibit 138: CNH Industrial NV - Key offerings
              • Exhibit 139: CNH Industrial NV - Segment focus
            • 12.8 Cropin Technology Solutions Pvt. Ltd.
              • Exhibit 140: Cropin Technology Solutions Pvt. Ltd. - Overview
              • Exhibit 141: Cropin Technology Solutions Pvt. Ltd. - Product / Service
              • Exhibit 142: Cropin Technology Solutions Pvt. Ltd. - Key offerings
            • 12.9 Deere and Co.
              • Exhibit 143: Deere and Co. - Overview
              • Exhibit 144: Deere and Co. - Business segments
              • Exhibit 145: Deere and Co. - Key news
              • Exhibit 146: Deere and Co. - Key offerings
              • Exhibit 147: Deere and Co. - Segment focus
            • 12.10 Fairfax Financial Holdings Ltd.
              • Exhibit 148: Fairfax Financial Holdings Ltd. - Overview
              • Exhibit 149: Fairfax Financial Holdings Ltd. - Business segments
              • Exhibit 150: Fairfax Financial Holdings Ltd. - Key offerings
              • Exhibit 151: Fairfax Financial Holdings Ltd. - Segment focus
            • 12.11 International Business Machines Corp.
              • Exhibit 152: International Business Machines Corp. - Overview
              • Exhibit 153: International Business Machines Corp. - Business segments
              • Exhibit 154: International Business Machines Corp. - Key news
              • Exhibit 155: International Business Machines Corp. - Key offerings
              • Exhibit 156: International Business Machines Corp. - Segment focus
            • 12.12 Kubota Corp.
              • Exhibit 157: Kubota Corp. - Overview
              • Exhibit 158: Kubota Corp. - Business segments
              • Exhibit 159: Kubota Corp. - Key news
              • Exhibit 160: Kubota Corp. - Key offerings
              • Exhibit 161: Kubota Corp. - Segment focus
            • 12.13 RELX Plc
              • Exhibit 162: RELX Plc - Overview
              • Exhibit 163: RELX Plc - Business segments
              • Exhibit 164: RELX Plc - Key offerings
              • Exhibit 165: RELX Plc - Segment focus
            • 12.14 SemiosBio Technologies Inc.
              • Exhibit 166: SemiosBio Technologies Inc. - Overview
              • Exhibit 167: SemiosBio Technologies Inc. - Product / Service
              • Exhibit 168: SemiosBio Technologies Inc. - Key offerings
            • 12.15 Syngenta Crop Protection AG
              • Exhibit 169: Syngenta Crop Protection AG - Overview
              • Exhibit 170: Syngenta Crop Protection AG - Product / Service
              • Exhibit 171: Syngenta Crop Protection AG - Key offerings
            • 12.16 Topcon Corp.
              • Exhibit 172: Topcon Corp. - Overview
              • Exhibit 173: Topcon Corp. - Business segments
              • Exhibit 174: Topcon Corp. - Key news
              • Exhibit 175: Topcon Corp. - Key offerings
              • Exhibit 176: Topcon Corp. - Segment focus
            • 12.17 Trimble Inc.
              • Exhibit 177: Trimble Inc. - Overview
              • Exhibit 178: Trimble Inc. - Business segments
              • Exhibit 179: Trimble Inc. - Key offerings
              • Exhibit 180: Trimble Inc. - Segment focus

            13 Appendix

            • 13.1 Scope of the report
              • 13.2 Inclusions and exclusions checklist
                • Exhibit 181: Inclusions checklist
                • Exhibit 182: Exclusions checklist
              • 13.3 Currency conversion rates for US$
                • Exhibit 183: Currency conversion rates for US$
              • 13.4 Research methodology
                • Exhibit 184: Research methodology
                • Exhibit 185: Validation techniques employed for market sizing
                • Exhibit 186: Information sources
              • 13.5 List of abbreviations
                • Exhibit 187: List of abbreviations

              Research Methodology

              Technavio presents a detailed picture of the market by way of study, synthesis, and summation of data from multiple sources. The analysts have presented the various facets of the market with a particular focus on identifying the key industry influencers. The data thus presented is comprehensive, reliable, and the result of extensive research, both primary and secondary.

              INFORMATION SOURCES

              Primary sources

              • Manufacturers and suppliers
              • Channel partners
              • Industry experts
              • Strategic decision makers

              Secondary sources

              • Industry journals and periodicals
              • Government data
              • Financial reports of key industry players
              • Historical data
              • Press releases

              DATA ANALYSIS

              Data Synthesis

              • Collation of data
              • Estimation of key figures
              • Analysis of derived insights

              Data Validation

              • Triangulation with data models
              • Reference against proprietary databases
              • Corroboration with industry experts

              REPORT WRITING

              Qualitative

              • Market drivers
              • Market challenges
              • Market trends
              • Five forces analysis

              Quantitative

              • Market size and forecast
              • Market segmentation
              • Geographical insights
              • Competitive landscape

              Interested in this report?

              Get your sample now to see our research methodology and insights!

              Download Now

              Frequently Asked Questions

              Farm Management Software market growth will increase by $ 2128.21 mn during 2024-2028.

              The Farm Management Software market is expected to grow at a CAGR of 11.29% during 2024-2028.

              Farm Management Software market is segmented by Application( Precision farming, Precision livestock, Precision aquaculture, Others) Deployment( Cloud-based, Web-based, APAC, South America, MEA)

              Ag Leader Technology, AGCO Corp., Agrivi d.o.o., Bayer AG, CNH Industrial NV, Cropin Technology Solutions Pvt. Ltd., Deere and Co., Fairfax Financial Holdings Ltd., GEA Group AG, International Business Machines Corp., Iteris Inc., Kubota Corp., Madison One Holdings LLC, Nofence AS, RELX Plc, SemiosBio Technologies Inc., Syngenta Crop Protection AG, Topcon Corp., Trimble Inc., TSI Inc., Microsoft Corp. are a few of the key vendors in the Farm Management Software market.

              North America will register the highest growth rate of 32% among the other regions. Therefore, the Farm Management Software market in North America is expected to garner significant business opportunities for the vendors during the forecast period.

              US, Canada, China, UK, Germany

              • Growing popularity of precision farmingPrecision farming uses hardware and software tools to maximize farm production with fewer inputs. Software tools are used for purposes such as managing fertilizer input is the driving factor this market.
              • monitoring crops is the driving factor this market.
              • and managing tasks on the farm. For monitoring crops is the driving factor this market.
              • software tools use data collected from hardware is the driving factor this market.
              • such as crop yield and moisture content in the oil. The compatibility of the software with multiple devices makes the process convenient for farmers who can view the information on their mobile devices. For example is the driving factor this market.
              • Trimble Ag Software has features for moisture is the driving factor this market.
              • variety is the driving factor this market.
              • and load tracking for crops grown on farms. Precision farming also includes yield and soil mapping applications with input management. Yield and soil mapping are done by geographic information system (GIS) software packages is the driving factor this market.
              • which display desired data is the driving factor this market.
              • such as yield and soil nutrient information is the driving factor this market.
              • on a map. As farmers need to increase yield and improve soil nutrient concentration is the driving factor this market.
              • an easy-to-understand view of the yield and soil nutrient variability in the form of a map is helpful. Input management involves controlling the amount of seeds is the driving factor this market.
              • fertilizers is the driving factor this market.
              • and pesticides to be used in different areas of the field through variable-rate technology. Based on the mapping data is the driving factor this market.
              • the input can be predetermined through software. The increasing adoption of precision farming leads to a proportional increase in the demand for farm management software. Not only precision farming but precision livestock technologies also require the mandatory electronic tagging of animals. These electronic identification modules can be managed using livestock management software. Thus is the driving factor this market.
              • the increasing popularity of precision farming is expected to drive the growth of the global farm management software market during the forecast period. is the driving factor this market.

              The Farm Management Software market vendors should focus on grabbing business opportunities from the Precision farming segment as it accounted for the largest market share in the base year.
              RIA - Research AI Assistant
              Ask RIA