Smart Greenhouse Market Analysis, Size, and Forecast 2026-2030: APAC (China, India, and Japan), Europe (Germany, France, and UK), North America (US, Canada, and Mexico), South America (Brazil and Argentina), Middle East and Africa (Saudi Arabia, UAE, and South Africa), and Rest of World (ROW)

Smart Greenhouse Market Analysis, Size, and Forecast 2026-2030:
APAC (China, India, and Japan), Europe (Germany, France, and UK), North America (US, Canada, and Mexico), South America (Brazil and Argentina), Middle East and Africa (Saudi Arabia, UAE, and South Africa), and Rest of World (ROW)

Published: Apr 2026 306 Pages SKU: IRTNTR76211

Market Overview at a Glance

$1.72 B
Market Opportunity
10.1%
CAGR 2025 - 2030
48.4%
APAC Growth
$1.50 B
Hydroponic segment 2024

Smart Greenhouse Market Size 2026-2030

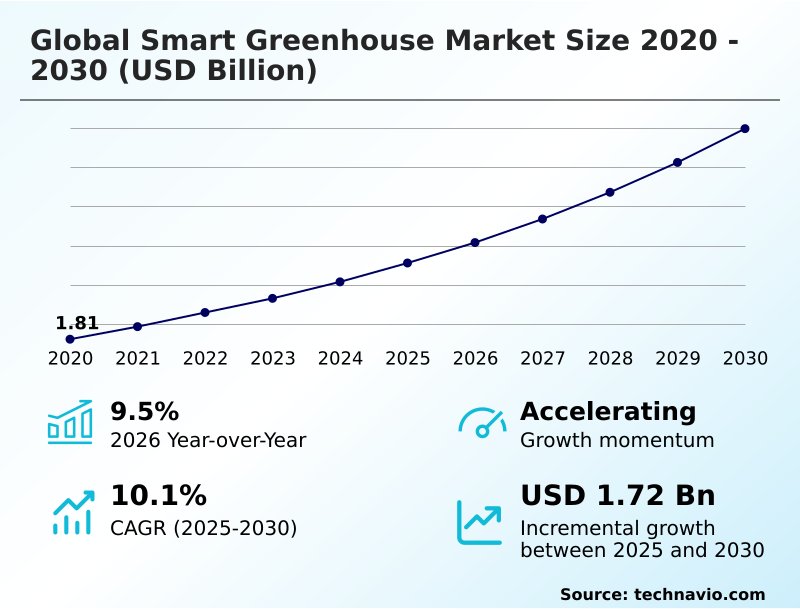
The smart greenhouse market size is valued to increase by USD 1.72 billion, at a CAGR of 10.1% from 2025 to 2030. Integration of advanced AI and autonomous control platforms will drive the smart greenhouse market.

Major Market Trends & Insights

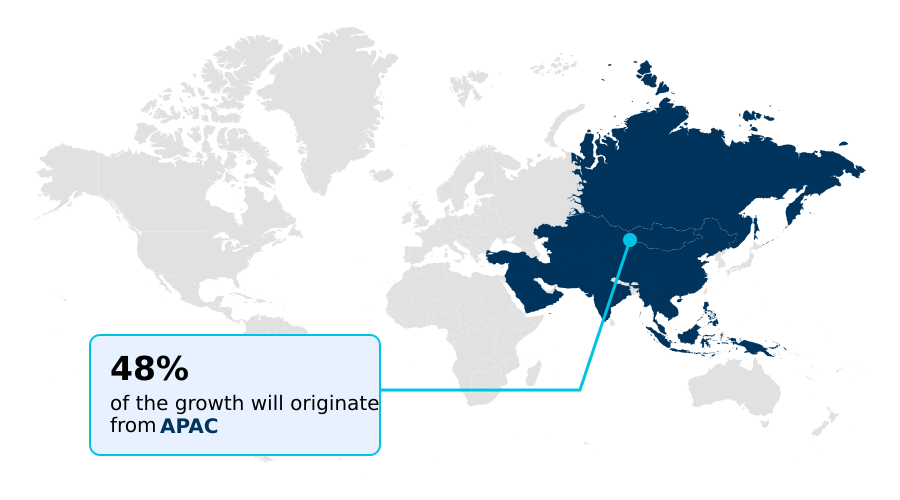
  • APAC dominated the market and accounted for a 48.4% growth during the forecast period.
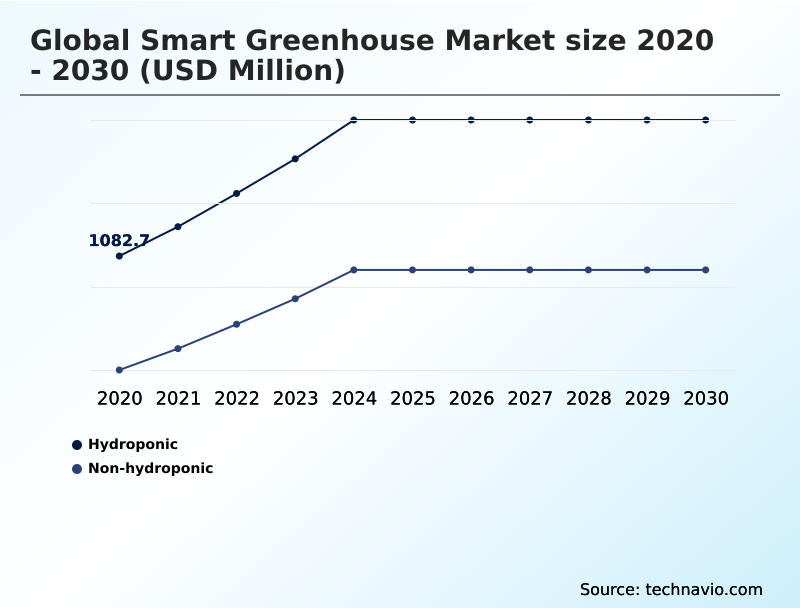
  • By Type - Hydroponic segment was valued at USD 1.50 billion in 2024
  • By Component - HVAC systems segment accounted for the largest market revenue share in 2024

Market Size & Forecast

  • Market Opportunities: USD 2.68 billion
  • Market Future Opportunities: USD 1.72 billion
  • CAGR from 2025 to 2030 : 10.1%

Market Summary

  • The smart greenhouse market is advancing controlled environment agriculture through the integration of automation and data analytics. A key driver is the adoption of AI-driven autonomous control platforms, which process data from wireless sensor networks to make real-time adjustments, moving the industry toward predictive modeling.
  • This technological shift addresses labor shortages and the need for precise environmental management to ensure crop quality. For example, a large-scale commercial operation can deploy a self-optimizing ecosystem that uses predictive maintenance alerts to prevent HVAC system failures, protecting high-value crops and reducing downtime by over 25%.
  • A primary trend is the convergence of smart infrastructure with urban vertical farming and circular economies, emphasizing resource-efficient cultivation. High initial capital expenditure remains a challenge, particularly for smaller operators who face financing barriers to adopting advanced sensors and automated irrigation. However, the escalating demand for year-round, high-quality produce continues to fuel investment in these sophisticated agricultural systems.

What will be the Size of the Smart Greenhouse Market during the forecast period?

Get Key Insights on Market Forecast (PDF) Get Free Sample

How is the Smart Greenhouse Market Segmented?

The smart greenhouse industry research report provides comprehensive data (region-wise segment analysis), with forecasts and estimates in "USD million" for the period 2026-2030, as well as historical data from 2020-2024 for the following segments.

  • Type
    • Hydroponic
    • Non-hydroponic
  • Component
    • HVAC systems
    • Control systems and sensors
    • LED grow lights
    • Others
  • Crop type
    • Fruits and vegetables
    • Flowers and ornamentals
    • Herbs and leafy greens
    • Others
  • Technology
    • IoT-enabled greenhouse
    • Automated greenhouse
  • Geography
    • APAC
      • China
      • India
      • Japan
    • Europe
      • Germany
      • France
      • UK
    • North America
      • US
      • Canada
      • Mexico
    • South America
      • Brazil
      • Argentina
    • Middle East and Africa
      • Saudi Arabia
      • UAE
      • South Africa
    • Rest of World (ROW)

By Type Insights

The hydroponic segment is estimated to witness significant growth during the forecast period.

Hydroponic cultivation represents a key segment, leveraging nutrient-rich solutions to bypass traditional soil-based methods. This approach is highly synergistic with smart technologies, where control systems and sensors provide granular oversight of the root zone environment.

The integration of an IoT-enabled greenhouse framework allows for the automatic adjustment of nutrient concentrations, enhancing growth rates by up to 22% compared to conventional farming. This precision is critical for high-density production in urban vertical farming settings.

Utilizing a closed-loop nutrient delivery system, these facilities achieve significant water efficiency. By eliminating soil-borne pathogens through advanced water recovery and regulated crop development, the need for chemical intervention is reduced, aligning with demand for sustainable farming practices.

Get Free Sample

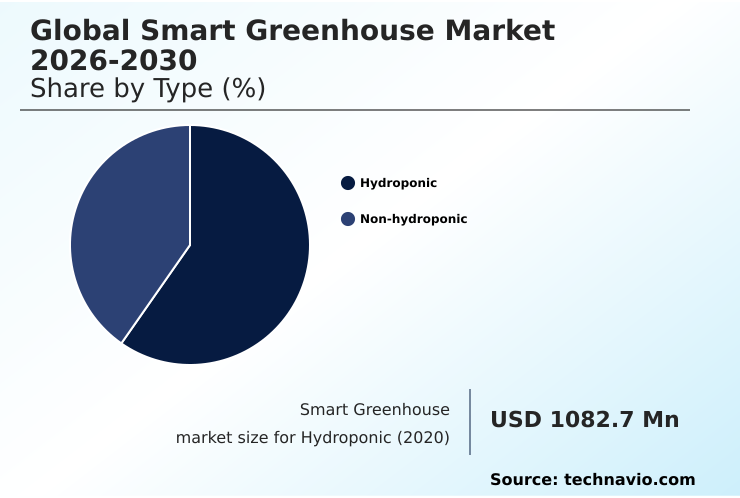
The Hydroponic segment was valued at USD 1.50 billion in 2024 and showed a gradual increase during the forecast period.

Get Free Sample

Regional Analysis

APAC is estimated to contribute 48.4% to the growth of the global market during the forecast period.Technavio’s analysts have elaborately explained the regional trends and drivers that shape the market during the forecast period.

See How Smart Greenhouse Market Demand is Rising in APAC Get Free Sample

The APAC region is a significant growth hub, driven by a focus on food self-sufficiency and the modernization of agriculture. Countries like China, Japan, and South Korea are investing in high-tech horticulture infrastructure to supply urban populations.

This has led to an 18% increase in the adoption of digital agricultural tools in the region over the past two years.

The proliferation of affordable agritech hardware and IoT sensors has made real-time climate regulation and nutrient management feasible for a wider range of growers. This data-driven agriculture is often supported by government initiatives promoting localized production hubs.

The focus on high-value leafy greens and other sensitive crops is particularly strong, as these benefit most from the controlled environment agriculture and blockchain traceability for ensuring food safety.

Market Dynamics

Our researchers analyzed the data with 2025 as the base year, along with the key drivers, trends, and challenges. A holistic analysis of drivers will help companies refine their marketing strategies to gain a competitive advantage.

  • The evolution of the global smart greenhouse market 2026-2030 is increasingly shaped by specialized applications and integrated systems. Smart greenhouse automation for urban farming is becoming essential for ensuring local food security, with deployments showing a 20% faster farm-to-table delivery time compared to rural supply chains.
  • The precision of IoT sensors for greenhouse climate control and autonomous irrigation and fertigation systems are foundational to this shift. AI-driven predictive analytics for crop yield is enabling growers to optimize production cycles, while data analytics for pest and disease detection minimizes losses.
  • Further advancements are seen in LED grow light spectrum optimization and techniques for optimizing CO2 levels in automated greenhouses. The ROI of smart greenhouse technology is bolstered by innovations in vertical farming environmental controls and smart greenhouse water reclamation systems. Even hydroponic nutrient management automation and real-time monitoring of soil moisture contribute to substantial resource savings.
  • As operators seek greater efficiency, integrating renewable energy in smart farms and understanding the benefits of computer vision in horticulture are key strategic priorities, addressing both the challenges of smart greenhouse implementation and the costs of greenhouse automation. This is particularly relevant when comparing hydroponic vs non-hydroponic systems or adapting a smart greenhouse for medicinal plant cultivation.

What are the key market drivers leading to the rise in the adoption of Smart Greenhouse Industry?

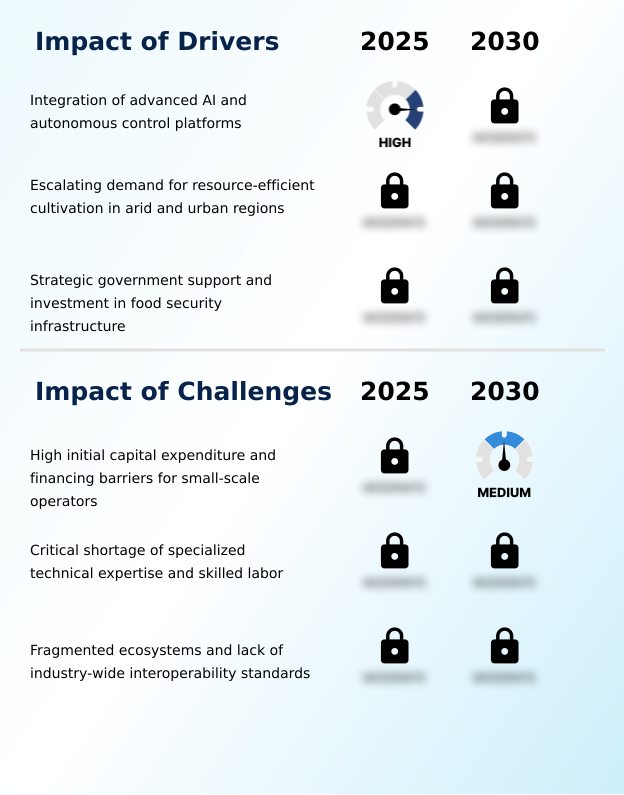
  • The integration of advanced AI and autonomous control platforms serves as a key driver for market expansion.

  • The primary driver is the integration of advanced AI, where an automated greenhouse functions with minimal human oversight. This shift toward resource-efficient cultivation is critical in urban regions, where high-yield crop management must be maximized in limited spaces.
  • The use of semiconductor materials in next-generation sensors has improved monitoring accuracy by over 25%, enabling precise adjustments to the microclimate. Furthermore, intelligent shading and geothermal energy systems are reducing operational expenditure optimization by as much as 15%.
  • This technology enables the management of complex microclimates for non-hydroponic cultivation and high-value crops, which was previously unfeasible, and supports the broader push for greater food security through localized, efficient production and floriculture.

What are the market trends shaping the Smart Greenhouse Industry?

  • The proliferation of AI-driven predictive analytics is a defining market trend, coupled with the increasing adoption of autonomous environmental management systems.

  • A primary trend is the shift toward the self-optimizing ecosystem, where AI-powered predictive analytics and machine learning models process data from wireless sensor networks. This enables autonomous environmental parameter control for fertigation schedules and vapor pressure deficit, reducing manual intervention by over 40%.
  • The convergence of turnkey infrastructure with circular economies is also gaining traction, with facilities integrating renewable energy integration to lower operational costs. This data-centric agriculture approach allows operators to manage larger facilities with fewer resources, addressing labor shortages. Adoption of these precision farming technologies improves forecast accuracy by 18%, fostering a more resilient agricultural landscape.

What challenges does the Smart Greenhouse Industry face during its growth?

  • High initial capital expenditure, alongside financing barriers for small-scale operators, presents a key challenge to industry growth.

  • A significant challenge is the fragmented nature of the technology landscape, hindering the adoption of automated irrigation and open-source technology. The lack of interoperability standards for hardware like LED grow lights and software for remote environmental monitoring creates complexities, increasing integration costs by up to 20%.
  • While advanced components like energy recovery ventilators offer significant long-term savings, their high upfront cost is a barrier. Furthermore, there is a critical shortage of skilled labor capable of managing sophisticated automated pollination systems and interpreting complex data for crop stress detection, which can delay ROI realization.
  • This fragmentation makes it difficult for operators to build a cohesive, efficient system without relying on single-vendor solutions.

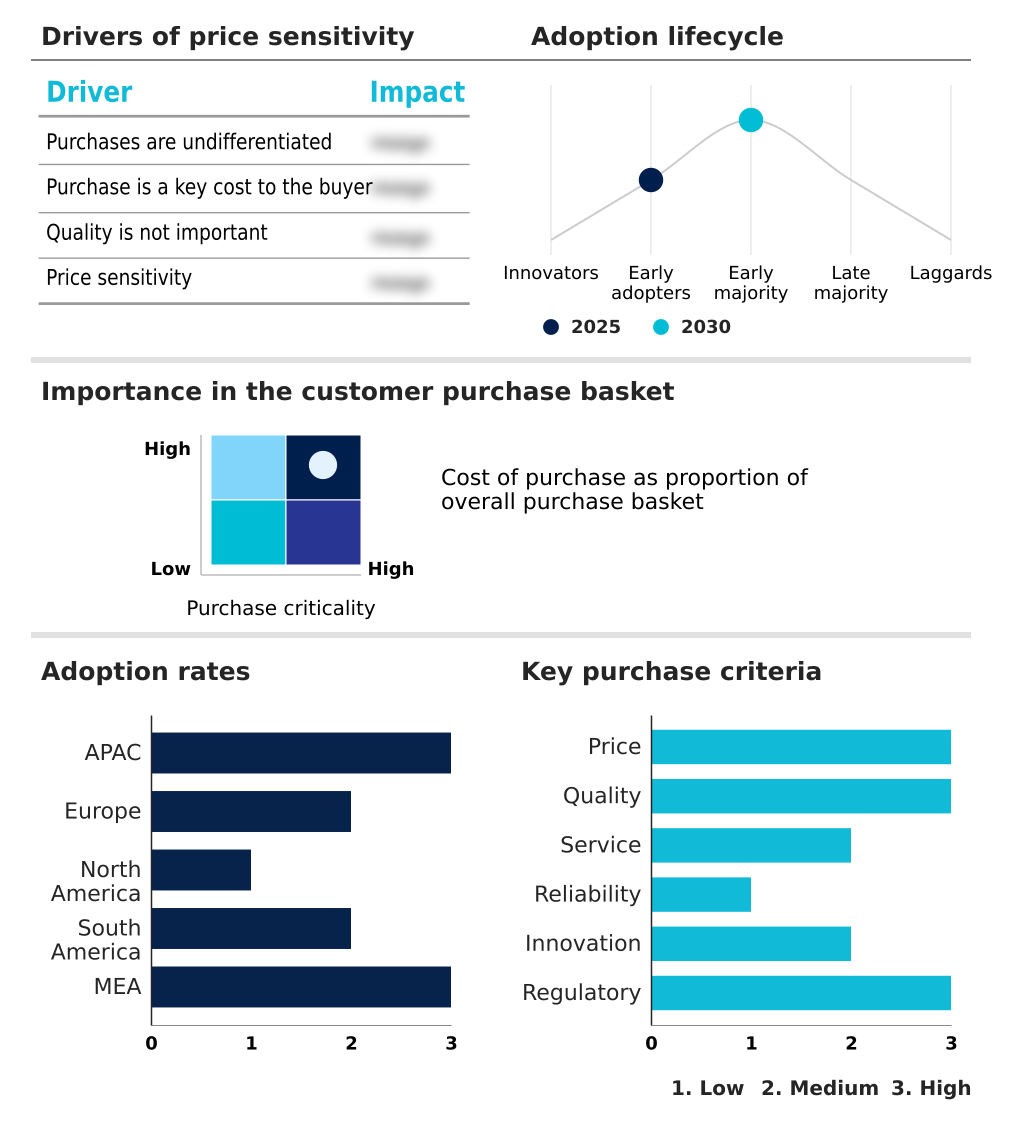
Exclusive Technavio Analysis on Customer Landscape

The smart greenhouse market forecasting report includes the adoption lifecycle of the market, covering from the innovator’s stage to the laggard’s stage. It focuses on adoption rates in different regions based on penetration. Furthermore, the smart greenhouse market report also includes key purchase criteria and drivers of price sensitivity to help companies evaluate and develop their market growth analysis strategies.

Customer Landscape of Smart Greenhouse Industry

Competitive Landscape

Companies are implementing various strategies, such as strategic alliances, smart greenhouse market forecast, partnerships, mergers and acquisitions, geographical expansion, and product/service launches, to enhance their presence in the industry.

Argus Control Systems Ltd. - Delivers integrated automation systems for optimized controlled environment agriculture, enhancing crop yield and resource management.

The industry research and growth report includes detailed analyses of the competitive landscape of the market and information about key companies, including:

  • Argus Control Systems Ltd.
  • Autogrow Systems
  • Certhon Build B.V.
  • Cultivar Ltd.
  • Growlink
  • Heliospectra AB
  • Hoogendoorn Growth Management
  • IGS Ltd.
  • iUNU Inc.
  • KUBO Greenhouse Projects
  • LOGIQS B.V.
  • Netafim Ltd.
  • Phonetics Inc.
  • Priva Holding BV
  • Prospiant Inc.
  • Ridder Drive Systems BV
  • Signify NV
  • Stuppy Greenhouse
  • Urban Crop Solutions
  • Valoya Oy

Qualitative and quantitative analysis of companies has been conducted to help clients understand the wider business environment as well as the strengths and weaknesses of key industry players. Data is qualitatively analyzed to categorize companies as pure play, category-focused, industry-focused, and diversified; it is quantitatively analyzed to categorize companies as dominant, leading, strong, tentative, and weak.

Recent Development and News in Smart greenhouse market

  • In May 2025, Ridder Drive Systems BV announced a collaboration with Signify to standardize communication between smart spectrum lighting and climate control systems, enabling more precise, automated light and climate management.
  • In April 2025, Koidra established a strategic partnership with Windset Farms to implement an AI-driven autonomous greenhouse initiative, leveraging advanced data analytics for enhanced climate regulation and nutrient management.
  • In March 2025, the United States Department of Agriculture expanded its Climate-Smart Commodities initiative, allocating new funding to help smaller producers deploy data-driven greenhouse systems.
  • In January 2025, a leading Chinese technology conglomerate announced the completion of a large-scale automated greenhouse complex in Shandong province, featuring a proprietary cloud-based management system to improve yields.

Dive into Technavio’s robust research methodology, blending expert interviews, extensive data synthesis, and validated models for unparalleled Smart Greenhouse Market insights. See full methodology.

Market Scope
Page number 306
Base year 2025
Historic period 2020-2024
Forecast period 2026-2030
Growth momentum & CAGR Accelerate at a CAGR of 10.1%
Market growth 2026-2030 USD 1715.5 million
Market structure Fragmented
YoY growth 2025-2026(%) 9.5%
Key countries China, India, Japan, South Korea, Australia, Indonesia, Germany, France, UK, Italy, Spain, The Netherlands, US, Canada, Mexico, Brazil, Argentina, Chile, Saudi Arabia, UAE, South Africa, Israel and Turkey
Competitive landscape Leading Companies, Market Positioning of Companies, Competitive Strategies, and Industry Risks

Request Free Sample

Research Analyst Overview

  • The smart greenhouse market is defined by its rapid integration of intelligent automation, fundamentally reshaping controlled environment agriculture. The core of this transformation lies in the autonomous control platform, which leverages data from high-precision sensors for plant physiology monitoring, light intensity monitoring, and carbon dioxide distribution. This allows for unparalleled climate regulation and nutrient management.
  • For boardroom consideration, the adoption of computer vision technology is no longer speculative; it is a key driver of operational efficiency, having demonstrated the ability to reduce manual inspection times by over 40% while improving crop stress detection.
  • This shift toward a data-driven agriculture model, supported by cloud-based management tools and modular hardware components, enables growers to achieve higher levels of high-density production. As the industry matures, the focus will be on standardizing these technologies to ensure seamless interoperability and continued innovation in fertigation schedules and HVAC systems management.

What are the Key Data Covered in this Smart Greenhouse Market Research and Growth Report?

  • What is the expected growth of the Smart Greenhouse Market between 2026 and 2030?

    • USD 1.72 billion, at a CAGR of 10.1%

  • What segmentation does the market report cover?

    • The report is segmented by Type (Hydroponic, and Non-hydroponic), Component (HVAC systems, Control systems and sensors, LED grow lights, and Others), Crop Type (Fruits and vegetables, Flowers and ornamentals, Herbs and leafy greens, and Others), Technology (IoT-enabled greenhouse, and Automated greenhouse) and Geography (APAC, Europe, North America, South America, Middle East and Africa)

  • Which regions are analyzed in the report?

    • APAC, Europe, North America, South America and Middle East and Africa

  • What are the key growth drivers and market challenges?

    • Integration of advanced AI and autonomous control platforms, High initial capital expenditure and financing barriers for small-scale operators

  • Who are the major players in the Smart Greenhouse Market?

    • Argus Control Systems Ltd., Autogrow Systems, Certhon Build B.V., Cultivar Ltd., Growlink, Heliospectra AB, Hoogendoorn Growth Management, IGS Ltd., iUNU Inc., KUBO Greenhouse Projects, LOGIQS B.V., Netafim Ltd., Phonetics Inc., Priva Holding BV, Prospiant Inc., Ridder Drive Systems BV, Signify NV, Stuppy Greenhouse, Urban Crop Solutions and Valoya Oy

Market Research Insights

  • Market dynamics are defined by the pursuit of operational efficiency through advanced automation. The adoption of precision farming technologies has been shown to improve yield predictability by up to 30%, a critical metric for commercial growers. At the same time, integrating high-yield crop management protocols with process automation solutions can reduce post-harvest loss reduction by 15%, directly impacting profitability.
  • These systems are central to controlled environment agriculture, where every input is meticulously managed. As operators shift toward data-centric agriculture, the ability to leverage insights for remote environmental monitoring and predictive maintenance becomes a significant competitive advantage. The focus remains on maximizing output while ensuring sustainable farming practices.

We can help! Our analysts can customize this smart greenhouse market research report to meet your requirements.

Get in touch

1. Executive Summary

1.1 Market overview

Executive Summary - Chart on Market Overview
Executive Summary - Data Table on Market Overview
Executive Summary - Chart on Global Market Characteristics
Executive Summary - Chart on Market by Geography
Executive Summary - Chart on Market Segmentation by Type
Executive Summary - Chart on Market Segmentation by Component
Executive Summary - Chart on Market Segmentation by Crop Type
Executive Summary - Chart on Market Segmentation by Technology
Executive Summary - Chart on Incremental Growth
Executive Summary - Data Table on Incremental Growth
Executive Summary - Chart on Company Market Positioning

2. Technavio Analysis

2.1 Analysis of price sensitivity, lifecycle, customer purchase basket, adoption rates, and purchase criteria

2.2 Criticality of inputs and Factors of differentiation

Chart on Overview on criticality of inputs and factors of differentiation

2.3 Factors of disruption

Chart on Overview on factors of disruption

2.4 Impact of drivers and challenges

Chart on Impact of drivers and challenges in 2025 and 2030

3. Market Landscape

3.1 Market ecosystem

Chart on Parent Market
Data Table on - Parent Market

3.2 Market characteristics

Chart on Market characteristics analysis

3.3 Value chain analysis

Chart on Value chain analysis

4. Market Sizing

4.1 Market definition

Data Table on Offerings of companies included in the market definition

4.2 Market segment analysis

Market segments

4.3 Market size 2025

4.4 Market outlook: Forecast for 2025-2030

Chart on Global - Market size and forecast 2025-2030 ($ million)
Data Table on Global - Market size and forecast 2025-2030 ($ million)
Chart on Global Market: Year-over-year growth 2025-2030 (%)
Data Table on Global Market: Year-over-year growth 2025-2030 (%)

5. Historic Market Size

5.1 Global Smart Greenhouse Market 2020 - 2024

Historic Market Size - Data Table on Global Smart Greenhouse Market 2020 - 2024 ($ million)

5.2 Type segment analysis 2020 - 2024

Historic Market Size - Type Segment 2020 - 2024 ($ million)

5.3 Component segment analysis 2020 - 2024

Historic Market Size - Component Segment 2020 - 2024 ($ million)

5.4 Crop Type segment analysis 2020 - 2024

Historic Market Size - Crop Type Segment 2020 - 2024 ($ million)

5.5 Technology segment analysis 2020 - 2024

Historic Market Size - Technology Segment 2020 - 2024 ($ million)

5.6 Geography segment analysis 2020 - 2024

Historic Market Size - Geography Segment 2020 - 2024 ($ million)

5.7 Country segment analysis 2020 - 2024

Historic Market Size - Country Segment 2020 - 2024 ($ million)

6. Qualitative Analysis

6.1 Impact of AI on global smart greenhouse market

6.2 Impact of geopolitical conflict on global smart greenhouse market

7. Five Forces Analysis

7.1 Five forces summary

Five forces analysis - Comparison between 2025 and 2030

7.2 Bargaining power of buyers

Bargaining power of buyers - Impact of key factors 2025 and 2030

7.3 Bargaining power of suppliers

Bargaining power of suppliers - Impact of key factors in 2025 and 2030

7.4 Threat of new entrants

Threat of new entrants - Impact of key factors in 2025 and 2030

7.5 Threat of substitutes

Threat of substitutes - Impact of key factors in 2025 and 2030

7.6 Threat of rivalry

Threat of rivalry - Impact of key factors in 2025 and 2030

7.7 Market condition

Chart on Market condition - Five forces 2025 and 2030

8. Market Segmentation by Type

8.1 Market segments

Chart on Type - Market share 2025-2030 (%)
Data Table on Type - Market share 2025-2030 (%)

8.2 Comparison by Type

Chart on Comparison by Type
Data Table on Comparison by Type

8.3 Hydroponic - Market size and forecast 2025-2030

Chart on Hydroponic - Market size and forecast 2025-2030 ($ million)
Data Table on Hydroponic - Market size and forecast 2025-2030 ($ million)
Chart on Hydroponic - Year-over-year growth 2025-2030 (%)
Data Table on Hydroponic - Year-over-year growth 2025-2030 (%)

8.4 Non-hydroponic - Market size and forecast 2025-2030

Chart on Non-hydroponic - Market size and forecast 2025-2030 ($ million)
Data Table on Non-hydroponic - Market size and forecast 2025-2030 ($ million)
Chart on Non-hydroponic - Year-over-year growth 2025-2030 (%)
Data Table on Non-hydroponic - Year-over-year growth 2025-2030 (%)

8.5 Market opportunity by Type

Market opportunity by Type ($ million)
Data Table on Market opportunity by Type ($ million)

9. Market Segmentation by Component

9.1 Market segments

Chart on Component - Market share 2025-2030 (%)
Data Table on Component - Market share 2025-2030 (%)

9.2 Comparison by Component

Chart on Comparison by Component
Data Table on Comparison by Component

9.3 HVAC systems - Market size and forecast 2025-2030

Chart on HVAC systems - Market size and forecast 2025-2030 ($ million)
Data Table on HVAC systems - Market size and forecast 2025-2030 ($ million)
Chart on HVAC systems - Year-over-year growth 2025-2030 (%)
Data Table on HVAC systems - Year-over-year growth 2025-2030 (%)

9.4 Control systems and sensors - Market size and forecast 2025-2030

Chart on Control systems and sensors - Market size and forecast 2025-2030 ($ million)
Data Table on Control systems and sensors - Market size and forecast 2025-2030 ($ million)
Chart on Control systems and sensors - Year-over-year growth 2025-2030 (%)
Data Table on Control systems and sensors - Year-over-year growth 2025-2030 (%)

9.5 LED grow lights - Market size and forecast 2025-2030

Chart on LED grow lights - Market size and forecast 2025-2030 ($ million)
Data Table on LED grow lights - Market size and forecast 2025-2030 ($ million)
Chart on LED grow lights - Year-over-year growth 2025-2030 (%)
Data Table on LED grow lights - Year-over-year growth 2025-2030 (%)

9.6 Others - Market size and forecast 2025-2030

Chart on Others - Market size and forecast 2025-2030 ($ million)
Data Table on Others - Market size and forecast 2025-2030 ($ million)
Chart on Others - Year-over-year growth 2025-2030 (%)
Data Table on Others - Year-over-year growth 2025-2030 (%)

9.7 Market opportunity by Component

Market opportunity by Component ($ million)
Data Table on Market opportunity by Component ($ million)

10. Market Segmentation by Crop Type

10.1 Market segments

Chart on Crop Type - Market share 2025-2030 (%)
Data Table on Crop Type - Market share 2025-2030 (%)

10.2 Comparison by Crop Type

Chart on Comparison by Crop Type
Data Table on Comparison by Crop Type

10.3 Fruits and vegetables - Market size and forecast 2025-2030

Chart on Fruits and vegetables - Market size and forecast 2025-2030 ($ million)
Data Table on Fruits and vegetables - Market size and forecast 2025-2030 ($ million)
Chart on Fruits and vegetables - Year-over-year growth 2025-2030 (%)
Data Table on Fruits and vegetables - Year-over-year growth 2025-2030 (%)

10.4 Flowers and ornamentals - Market size and forecast 2025-2030

Chart on Flowers and ornamentals - Market size and forecast 2025-2030 ($ million)
Data Table on Flowers and ornamentals - Market size and forecast 2025-2030 ($ million)
Chart on Flowers and ornamentals - Year-over-year growth 2025-2030 (%)
Data Table on Flowers and ornamentals - Year-over-year growth 2025-2030 (%)

10.5 Herbs and leafy greens - Market size and forecast 2025-2030

Chart on Herbs and leafy greens - Market size and forecast 2025-2030 ($ million)
Data Table on Herbs and leafy greens - Market size and forecast 2025-2030 ($ million)
Chart on Herbs and leafy greens - Year-over-year growth 2025-2030 (%)
Data Table on Herbs and leafy greens - Year-over-year growth 2025-2030 (%)

10.6 Others - Market size and forecast 2025-2030

Chart on Others - Market size and forecast 2025-2030 ($ million)
Data Table on Others - Market size and forecast 2025-2030 ($ million)
Chart on Others - Year-over-year growth 2025-2030 (%)
Data Table on Others - Year-over-year growth 2025-2030 (%)

10.7 Market opportunity by Crop Type

Market opportunity by Crop Type ($ million)
Data Table on Market opportunity by Crop Type ($ million)

11. Market Segmentation by Technology

11.1 Market segments

Chart on Technology - Market share 2025-2030 (%)
Data Table on Technology - Market share 2025-2030 (%)

11.2 Comparison by Technology

Chart on Comparison by Technology
Data Table on Comparison by Technology

11.3 IoT-enabled greenhouse - Market size and forecast 2025-2030

Chart on IoT-enabled greenhouse - Market size and forecast 2025-2030 ($ million)
Data Table on IoT-enabled greenhouse - Market size and forecast 2025-2030 ($ million)
Chart on IoT-enabled greenhouse - Year-over-year growth 2025-2030 (%)
Data Table on IoT-enabled greenhouse - Year-over-year growth 2025-2030 (%)

11.4 Automated greenhouse - Market size and forecast 2025-2030

Chart on Automated greenhouse - Market size and forecast 2025-2030 ($ million)
Data Table on Automated greenhouse - Market size and forecast 2025-2030 ($ million)
Chart on Automated greenhouse - Year-over-year growth 2025-2030 (%)
Data Table on Automated greenhouse - Year-over-year growth 2025-2030 (%)

11.5 Market opportunity by Technology

Market opportunity by Technology ($ million)
Data Table on Market opportunity by Technology ($ million)

12. Customer Landscape

12.1 Customer landscape overview

Analysis of price sensitivity, lifecycle, customer purchase basket, adoption rates, and purchase criteria

13. Geographic Landscape

13.1 Geographic segmentation

Chart on Market share by geography 2025-2030 (%)
Data Table on Market share by geography 2025-2030 (%)

13.2 Geographic comparison

Chart on Geographic comparison
Data Table on Geographic comparison

13.3 APAC - Market size and forecast 2025-2030

Chart on APAC - Market size and forecast 2025-2030 ($ million)
Data Table on APAC - Market size and forecast 2025-2030 ($ million)
Chart on APAC - Year-over-year growth 2025-2030 (%)
Data Table on APAC - Year-over-year growth 2025-2030 (%)
Chart on Regional Comparison - APAC
Data Table on Regional Comparison - APAC

13.3.1 China - Market size and forecast 2025-2030

Chart on China - Market size and forecast 2025-2030 ($ million)
Data Table on China - Market size and forecast 2025-2030 ($ million)
Chart on China - Year-over-year growth 2025-2030 (%)
Data Table on China - Year-over-year growth 2025-2030 (%)

13.3.2 India - Market size and forecast 2025-2030

Chart on India - Market size and forecast 2025-2030 ($ million)
Data Table on India - Market size and forecast 2025-2030 ($ million)
Chart on India - Year-over-year growth 2025-2030 (%)
Data Table on India - Year-over-year growth 2025-2030 (%)

13.3.3 Japan - Market size and forecast 2025-2030

Chart on Japan - Market size and forecast 2025-2030 ($ million)
Data Table on Japan - Market size and forecast 2025-2030 ($ million)
Chart on Japan - Year-over-year growth 2025-2030 (%)
Data Table on Japan - Year-over-year growth 2025-2030 (%)

13.3.4 South Korea - Market size and forecast 2025-2030

Chart on South Korea - Market size and forecast 2025-2030 ($ million)
Data Table on South Korea - Market size and forecast 2025-2030 ($ million)
Chart on South Korea - Year-over-year growth 2025-2030 (%)
Data Table on South Korea - Year-over-year growth 2025-2030 (%)

13.3.5 Australia - Market size and forecast 2025-2030

Chart on Australia - Market size and forecast 2025-2030 ($ million)
Data Table on Australia - Market size and forecast 2025-2030 ($ million)
Chart on Australia - Year-over-year growth 2025-2030 (%)
Data Table on Australia - Year-over-year growth 2025-2030 (%)

13.3.6 Indonesia - Market size and forecast 2025-2030

Chart on Indonesia - Market size and forecast 2025-2030 ($ million)
Data Table on Indonesia - Market size and forecast 2025-2030 ($ million)
Chart on Indonesia - Year-over-year growth 2025-2030 (%)
Data Table on Indonesia - Year-over-year growth 2025-2030 (%)

13.4 Europe - Market size and forecast 2025-2030

Chart on Europe - Market size and forecast 2025-2030 ($ million)
Data Table on Europe - Market size and forecast 2025-2030 ($ million)
Chart on Europe - Year-over-year growth 2025-2030 (%)
Data Table on Europe - Year-over-year growth 2025-2030 (%)
Chart on Regional Comparison - Europe
Data Table on Regional Comparison - Europe

13.4.1 Germany - Market size and forecast 2025-2030

Chart on Germany - Market size and forecast 2025-2030 ($ million)
Data Table on Germany - Market size and forecast 2025-2030 ($ million)
Chart on Germany - Year-over-year growth 2025-2030 (%)
Data Table on Germany - Year-over-year growth 2025-2030 (%)

13.4.2 France - Market size and forecast 2025-2030

Chart on France - Market size and forecast 2025-2030 ($ million)
Data Table on France - Market size and forecast 2025-2030 ($ million)
Chart on France - Year-over-year growth 2025-2030 (%)
Data Table on France - Year-over-year growth 2025-2030 (%)

13.4.3 UK - Market size and forecast 2025-2030

Chart on UK - Market size and forecast 2025-2030 ($ million)
Data Table on UK - Market size and forecast 2025-2030 ($ million)
Chart on UK - Year-over-year growth 2025-2030 (%)
Data Table on UK - Year-over-year growth 2025-2030 (%)

13.4.4 Italy - Market size and forecast 2025-2030

Chart on Italy - Market size and forecast 2025-2030 ($ million)
Data Table on Italy - Market size and forecast 2025-2030 ($ million)
Chart on Italy - Year-over-year growth 2025-2030 (%)
Data Table on Italy - Year-over-year growth 2025-2030 (%)

13.4.5 Spain - Market size and forecast 2025-2030

Chart on Spain - Market size and forecast 2025-2030 ($ million)
Data Table on Spain - Market size and forecast 2025-2030 ($ million)
Chart on Spain - Year-over-year growth 2025-2030 (%)
Data Table on Spain - Year-over-year growth 2025-2030 (%)

13.4.6 The Netherlands - Market size and forecast 2025-2030

Chart on The Netherlands - Market size and forecast 2025-2030 ($ million)
Data Table on The Netherlands - Market size and forecast 2025-2030 ($ million)
Chart on The Netherlands - Year-over-year growth 2025-2030 (%)
Data Table on The Netherlands - Year-over-year growth 2025-2030 (%)

13.5 North America - Market size and forecast 2025-2030

Chart on North America - Market size and forecast 2025-2030 ($ million)
Data Table on North America - Market size and forecast 2025-2030 ($ million)
Chart on North America - Year-over-year growth 2025-2030 (%)
Data Table on North America - Year-over-year growth 2025-2030 (%)
Chart on Regional Comparison - North America
Data Table on Regional Comparison - North America

13.5.1 US - Market size and forecast 2025-2030

Chart on US - Market size and forecast 2025-2030 ($ million)
Data Table on US - Market size and forecast 2025-2030 ($ million)
Chart on US - Year-over-year growth 2025-2030 (%)
Data Table on US - Year-over-year growth 2025-2030 (%)

13.5.2 Canada - Market size and forecast 2025-2030

Chart on Canada - Market size and forecast 2025-2030 ($ million)
Data Table on Canada - Market size and forecast 2025-2030 ($ million)
Chart on Canada - Year-over-year growth 2025-2030 (%)
Data Table on Canada - Year-over-year growth 2025-2030 (%)

13.5.3 Mexico - Market size and forecast 2025-2030

Chart on Mexico - Market size and forecast 2025-2030 ($ million)
Data Table on Mexico - Market size and forecast 2025-2030 ($ million)
Chart on Mexico - Year-over-year growth 2025-2030 (%)
Data Table on Mexico - Year-over-year growth 2025-2030 (%)

13.6 South America - Market size and forecast 2025-2030

Chart on South America - Market size and forecast 2025-2030 ($ million)
Data Table on South America - Market size and forecast 2025-2030 ($ million)
Chart on South America - Year-over-year growth 2025-2030 (%)
Data Table on South America - Year-over-year growth 2025-2030 (%)
Chart on Regional Comparison - South America
Data Table on Regional Comparison - South America

13.6.1 Brazil - Market size and forecast 2025-2030

Chart on Brazil - Market size and forecast 2025-2030 ($ million)
Data Table on Brazil - Market size and forecast 2025-2030 ($ million)
Chart on Brazil - Year-over-year growth 2025-2030 (%)
Data Table on Brazil - Year-over-year growth 2025-2030 (%)

13.6.2 Argentina - Market size and forecast 2025-2030

Chart on Argentina - Market size and forecast 2025-2030 ($ million)
Data Table on Argentina - Market size and forecast 2025-2030 ($ million)
Chart on Argentina - Year-over-year growth 2025-2030 (%)
Data Table on Argentina - Year-over-year growth 2025-2030 (%)

13.6.3 Chile - Market size and forecast 2025-2030

Chart on Chile - Market size and forecast 2025-2030 ($ million)
Data Table on Chile - Market size and forecast 2025-2030 ($ million)
Chart on Chile - Year-over-year growth 2025-2030 (%)
Data Table on Chile - Year-over-year growth 2025-2030 (%)

13.7 Middle East and Africa - Market size and forecast 2025-2030

Chart on Middle East and Africa - Market size and forecast 2025-2030 ($ million)
Data Table on Middle East and Africa - Market size and forecast 2025-2030 ($ million)
Chart on Middle East and Africa - Year-over-year growth 2025-2030 (%)
Data Table on Middle East and Africa - Year-over-year growth 2025-2030 (%)
Chart on Regional Comparison - Middle East and Africa
Data Table on Regional Comparison - Middle East and Africa

13.7.1 Saudi Arabia - Market size and forecast 2025-2030

Chart on Saudi Arabia - Market size and forecast 2025-2030 ($ million)
Data Table on Saudi Arabia - Market size and forecast 2025-2030 ($ million)
Chart on Saudi Arabia - Year-over-year growth 2025-2030 (%)
Data Table on Saudi Arabia - Year-over-year growth 2025-2030 (%)

13.7.2 UAE - Market size and forecast 2025-2030

Chart on UAE - Market size and forecast 2025-2030 ($ million)
Data Table on UAE - Market size and forecast 2025-2030 ($ million)
Chart on UAE - Year-over-year growth 2025-2030 (%)
Data Table on UAE - Year-over-year growth 2025-2030 (%)

13.7.3 South Africa - Market size and forecast 2025-2030

Chart on South Africa - Market size and forecast 2025-2030 ($ million)
Data Table on South Africa - Market size and forecast 2025-2030 ($ million)
Chart on South Africa - Year-over-year growth 2025-2030 (%)
Data Table on South Africa - Year-over-year growth 2025-2030 (%)

13.7.4 Israel - Market size and forecast 2025-2030

Chart on Israel - Market size and forecast 2025-2030 ($ million)
Data Table on Israel - Market size and forecast 2025-2030 ($ million)
Chart on Israel - Year-over-year growth 2025-2030 (%)
Data Table on Israel - Year-over-year growth 2025-2030 (%)

13.7.5 Turkey - Market size and forecast 2025-2030

Chart on Turkey - Market size and forecast 2025-2030 ($ million)
Data Table on Turkey - Market size and forecast 2025-2030 ($ million)
Chart on Turkey - Year-over-year growth 2025-2030 (%)
Data Table on Turkey - Year-over-year growth 2025-2030 (%)

13.8 Market opportunity by geography

Market opportunity by geography ($ million)
Data Tables on Market opportunity by geography ($ million)

14. Drivers, Challenges, and Opportunity

14.1 Market drivers

Integration of advanced AI and autonomous control platforms
Escalating demand for resource-efficient cultivation in arid and urban regions
Strategic government support and investment in food security infrastructure

14.2 Market challenges

High initial capital expenditure and financing barriers for small-scale operators
Critical shortage of specialized technical expertise and skilled labor
Fragmented ecosystems and lack of industry-wide interoperability standards

14.3 Impact of drivers and challenges

Impact of drivers and challenges in 2025 and 2030

14.4 Market opportunities

Proliferation of AI-driven predictive analytics and autonomous environment management
Convergence of smart greenhouse infrastructure with urban vertical farming and circular economies
Strategic implementation of renewable energy integration and advanced water recovery systems

15. Competitive Landscape

15.1 Overview

15.2

Overview on criticality of inputs and factors of differentiation

15.3 Landscape disruption

Overview on factors of disruption

15.4 Industry risks

Impact of key risks on business

16. Competitive Analysis

16.1 Companies profiled

Companies covered

16.2 Company ranking index

16.3 Market positioning of companies

Matrix on companies position and classification

16.4 Argus Control Systems Ltd.

Argus Control Systems Ltd. - Overview
Argus Control Systems Ltd. - Product / Service
Argus Control Systems Ltd. - Key offerings
SWOT

16.5 Autogrow Systems

Autogrow Systems - Overview
Autogrow Systems - Product / Service
Autogrow Systems - Key offerings
SWOT

16.6 Certhon Build B.V.

Certhon Build B.V. - Overview
Certhon Build B.V. - Product / Service
Certhon Build B.V. - Key offerings
SWOT

16.7 Hoogendoorn Growth Management

Hoogendoorn Growth Management - Overview
Hoogendoorn Growth Management - Product / Service
Hoogendoorn Growth Management - Key offerings
SWOT

16.8 IGS Ltd.

IGS Ltd. - Overview
IGS Ltd. - Product / Service
IGS Ltd. - Key offerings
SWOT

16.9 KUBO Greenhouse Projects

KUBO Greenhouse Projects - Overview
KUBO Greenhouse Projects - Product / Service
KUBO Greenhouse Projects - Key offerings
SWOT

16.10 LOGIQS B.V.

LOGIQS B.V. - Overview
LOGIQS B.V. - Product / Service
LOGIQS B.V. - Key offerings
SWOT

16.11 Netafim Ltd.

Netafim Ltd. - Overview
Netafim Ltd. - Product / Service
Netafim Ltd. - Key offerings
SWOT

16.12 Phonetics Inc.

Phonetics Inc. - Overview
Phonetics Inc. - Product / Service
Phonetics Inc. - Key offerings
SWOT

16.13 Priva Holding BV

Priva Holding BV - Overview
Priva Holding BV - Product / Service
Priva Holding BV - Key offerings
SWOT

16.14 Prospiant Inc.

Prospiant Inc. - Overview
Prospiant Inc. - Product / Service
Prospiant Inc. - Key offerings
SWOT

16.15 Ridder Drive Systems BV

Ridder Drive Systems BV - Overview
Ridder Drive Systems BV - Product / Service
Ridder Drive Systems BV - Key offerings
SWOT

16.16 Signify NV

Signify NV - Overview
Signify NV - Business segments
Signify NV - Key offerings
Signify NV - Segment focus
SWOT

16.17 Stuppy Greenhouse

Stuppy Greenhouse - Overview
Stuppy Greenhouse - Product / Service
Stuppy Greenhouse - Key offerings
SWOT

16.18 Valoya Oy

Valoya Oy - Overview
Valoya Oy - Product / Service
Valoya Oy - Key offerings
SWOT

17. Appendix

17.1 Scope of the report

Market definition
Objectives
Notes and caveats

17.2 Inclusions and exclusions checklist

Inclusions checklist
Exclusions checklist

17.3 Currency conversion rates for US$

17.4 Research methodology

17.5 Data procurement

Information sources

17.6 Data validation

17.7 Validation techniques employed for market sizing

17.8 Data synthesis

17.9 360 degree market analysis

17.10 List of abbreviations

Research Methodology

Technavio presents a detailed picture of the market by way of study, synthesis, and summation of data from multiple sources. The analysts have presented the various facets of the market with a particular focus on identifying the key industry influencers. The data thus presented is comprehensive, reliable, and the result of extensive research, both primary and secondary.

INFORMATION SOURCES

Primary sources

  • Manufacturers and suppliers
  • Channel partners
  • Industry experts
  • Strategic decision makers

Secondary sources

  • Industry journals and periodicals
  • Government data
  • Financial reports of key industry players
  • Historical data
  • Press releases

DATA ANALYSIS

Data Synthesis

  • Collation of data
  • Estimation of key figures
  • Analysis of derived insights

Data Validation

  • Triangulation with data models
  • Reference against proprietary databases
  • Corroboration with industry experts

REPORT WRITING

Qualitative

  • Market drivers
  • Market challenges
  • Market trends
  • Five forces analysis

Quantitative

  • Market size and forecast
  • Market segmentation
  • Geographical insights
  • Competitive landscape

Interested in this report?

Get your sample now to see our research methodology and insights!

Download Now

Frequently Asked Questions

Smart Greenhouse market growth will increase by USD 1715.5 million during 2026-2030.

The Smart Greenhouse market is expected to grow at a CAGR of 10.1% during 2026-2030.

Smart Greenhouse market is segmented by Type (Hydroponic, Non-hydroponic) Component (HVAC systems, Control systems and sensors, LED grow lights, Others) Crop type (Fruits and vegetables, Flowers and ornamentals, Herbs and leafy greens, Others) Technology (IoT-enabled greenhouse, Automated greenhouse)

Argus Control Systems Ltd., Autogrow Systems, Certhon Build B.V., Cultivar Ltd., Growlink, Heliospectra AB, Hoogendoorn Growth Management, IGS Ltd., iUNU Inc., KUBO Greenhouse Projects, LOGIQS B.V., Netafim Ltd., Phonetics Inc., Priva Holding BV, Prospiant Inc., Ridder Drive Systems BV, Signify NV, Stuppy Greenhouse, Urban Crop Solutions, Valoya Oy are a few of the key vendors in the Smart Greenhouse market.

APAC will register the highest growth rate of 48.4% among the other regions. Therefore, the Smart Greenhouse market in APAC is expected to garner significant business opportunities for the vendors during the forecast period.

China, India, Japan, South Korea, Australia, Indonesia, Germany, France, UK, Italy, Spain, The Netherlands, US, Canada, Mexico, Brazil, Argentina, Chile, Saudi Arabia, UAE, South Africa, Israel, Turkey

  • Integration of advanced AI and autonomous control platforms is the driving factor this market.

The Smart Greenhouse market vendors should focus on grabbing business opportunities from the Type segment as it accounted for the largest market share in the base year.
RIA - Research AI Assistant
Ask RIA