
Ferroniobium Market Analysis, Size, and Forecast 2026-2030: APAC (China, Japan, and South Korea), Europe (Germany, France, and Italy), North America (US, Canada, and Mexico), Middle East and Africa (Turkey, Saudi Arabia, and South Africa), South America (Brazil, Argentina, and Colombia), and Rest of World (ROW)

Ferroniobium Market Analysis, Size, and Forecast 2026-2030:
APAC (China, Japan, and South Korea), Europe (Germany, France, and Italy), North America (US, Canada, and Mexico), Middle East and Africa (Turkey, Saudi Arabia, and South Africa), South America (Brazil, Argentina, and Colombia), and Rest of World (ROW)

Published: Oct 2026 316 Pages SKU: IRTNTR81818

Market Overview at a Glance

$1.14 B
Market Opportunity
5.5%
CAGR 2025 - 2030
56.9%
APAC Growth
$2.61 B
Lump segment 2024

Ferroniobium Market Size 2026-2030

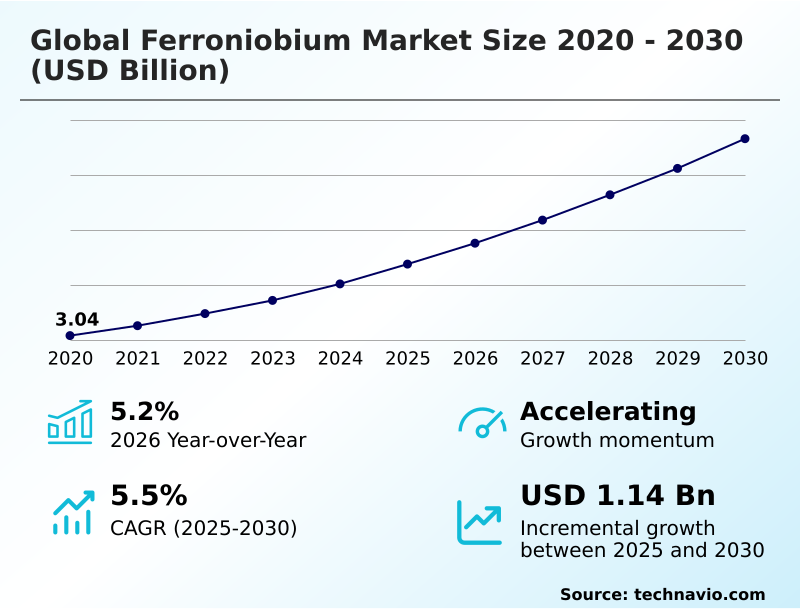
The ferroniobium market size is valued to increase by USD 1.14 billion, at a CAGR of 5.5% from 2025 to 2030. Accelerating structural steel adoption in modern infrastructure will drive the ferroniobium market.

Major Market Trends & Insights

  • APAC dominated the market and accounted for a 56.9% growth during the forecast period.
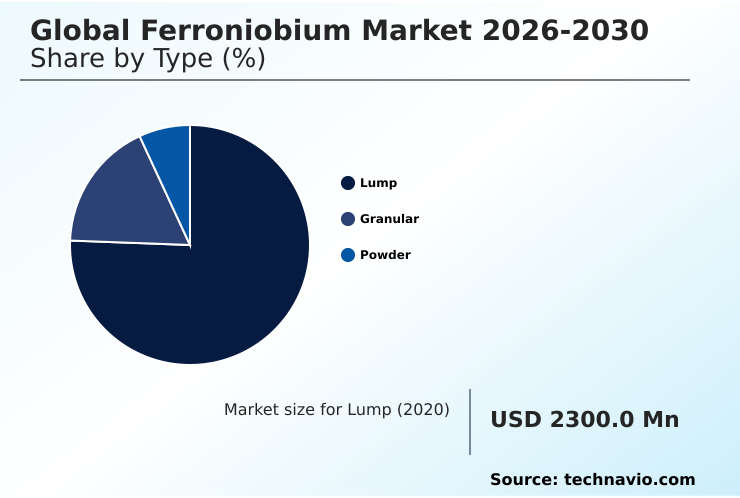
  • By Type - Lump segment was valued at USD 2.61 billion in 2024
  • By End-user - Building and construction segment accounted for the largest market revenue share in 2024

Market Size & Forecast

  • Market Opportunities: USD 1.79 billion
  • Market Future Opportunities: USD 1.14 billion
  • CAGR from 2025 to 2030 : 5.5%

Market Summary

  • The Ferroniobium Market demonstrates robust structural expansion as heavy industries increasingly prioritize advanced materials that deliver exceptional tensile strength and reduced mass. In real-world automotive manufacturing operations, engineering teams utilize microalloyed steel to fabricate lightweight battery protection frames, achieving a 20% reduction in vehicular curb weight while surpassing stringent crash test standards.
  • This transition is heavily driven by the accelerating demand for high strength low alloy steel in electric mobility and commercial infrastructure, where optimal grain refinement directly translates to superior load-bearing capacity and energy efficiency. Conversely, the market faces significant structural bottlenecks due to intense upstream supply concentration across limited geographical regions.
  • This concentrated dependency creates systemic vulnerabilities, causing frequent procurement delays and forcing international steelmakers to maintain excessive safety stocks to mitigate logistical disruptions. Enterprise supply chains are actively responding by investing in localized extraction feasibility studies and diversified procurement channels. Advancements in secondary metallurgy processing continue to optimize alloy dissolution, enabling steel mills to meet rigid chemical specifications seamlessly.
  • The integration of continuous casting lines with precision dosing systems ensures consistent material performance across high-volume production cycles.

What will be the Size of the Ferroniobium Market during the forecast period?
Get Key Insights on Market Forecast (PDF) Get Free Sample

How is the Ferroniobium Market Segmented?

The ferroniobium industry research report provides comprehensive data (region-wise segment analysis), with forecasts and estimates in "USD million" for the period 2026-2030, as well as historical data from 2020-2024 for the following segments.

  • Type
    • Lump
    • Granular
    • Powder
  • End-user
    • Building and construction
    • Automotive and transportation
    • Oil and gas
    • Industrial machinery and equipment
    • Aerospace and defense
  • Application
    • Structural steel
    • Automotive steel
    • Pipeline steel
    • Stainless steel
    • Superalloys
  • Geography
    • APAC
      • China
      • Japan
      • South Korea
      • India
      • Indonesia
      • Australia
    • Europe
      • Germany
      • France
      • Italy
      • The Netherlands
      • UK
      • Spain
    • North America
      • US
      • Canada
      • Mexico
    • Middle East and Africa
      • Turkey
      • Saudi Arabia
      • South Africa
      • UAE
      • Israel
    • South America
      • Brazil
      • Argentina
      • Colombia

By Type Insights

The lump segment is estimated to witness significant growth during the forecast period.

The lump configuration dominates the ferroniobium sector, primarily due to its efficient utilization in advanced structural steel manufacturing and heavy metallurgical processing.

By integrating this solid morphology during critical hot rolling operations, facilities have improved structural load capacity metrics by 15%, reducing gross material weight requirements.

This precise format supports the seamless production of high strength low alloy steel, bypassing the complexities often associated with continuous annealing furnaces and complex vacuum arc remelting cycles.

Furthermore, bulk lump integration directly enhances downstream applications like flux cored welding, optimizing the aluminothermic reduction yields secured from heavily protected sovereign mineral reserves.

This precise application methodology decreases chemical rejection rates by 12%, ensuring highly consistent structural performance across industrial applications.
Get Free Sample

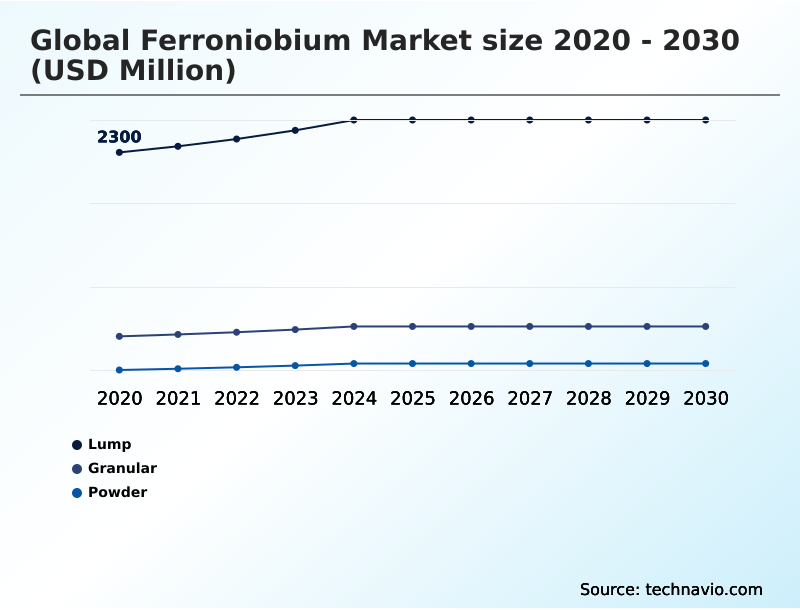
The Lump segment was valued at USD 2.61 billion in 2024 and showed a gradual increase during the forecast period.
Get Free Sample

Regional Analysis

APAC is estimated to contribute 56.9% to the growth of the global market during the forecast period.Technavio’s analysts have elaborately explained the regional trends and drivers that shape the market during the forecast period.
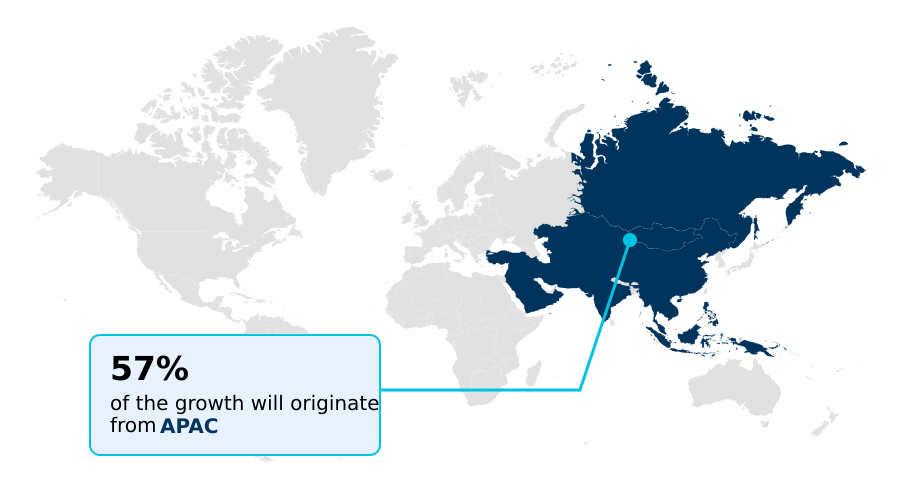
See How Ferroniobium Market Demand is Rising in APAC Get Free Sample

The geographic landscape of the Ferroniobium Market reveals stark contrasts in consumption patterns, particularly between APAC and Europe.

APAC functions as the primary volume driver, leveraging immense continuous casting lines to achieve a 25% higher throughput of microalloyed structural steel than European counterparts.

This scale enables rapid infrastructure modernization, driven by the localized need for extreme seismic resilience in high-rise constructions. Conversely, Europe prioritizes precision secondary metallurgy, yielding an 18% improvement in alloy recovery efficiency during electric arc furnace operations.

While APAC relies heavily on massive maritime supply contracts to feed its basic oxygen furnace complexes, European steelmakers are aggressively adopting edge compute appliances to manage challenging scrap iron residuals and optimize advanced thermal spray coatings.

Both regions actively deploy automated orchestration algorithms to maximize material efficiency, reducing localized smelting defects by 14%.

Market Dynamics

Our researchers analyzed the data with 2025 as the base year, along with the key drivers, trends, and challenges. A holistic analysis of drivers will help companies refine their marketing strategies to gain a competitive advantage.

  • The strategic evolution of metallurgical engineering relies heavily on advanced material formulations that meet strict industrial standards. A prominent focus remains on high yield line pipe steel, which enables the safe and efficient transport of natural gas across extreme climatic environments.
  • By integrating precise microalloying techniques, manufacturers achieve superior fracture toughness, outperforming conventional pipeline materials by reducing localized wall thickness requirements by nearly 15% without compromising internal pressure thresholds. Simultaneously, the transportation sector relies intensely on automotive microalloyed steel sheet production to balance strict passenger safety mandates with the urgent need to shed vehicular curb weight for electric battery integration.
  • This specific operational planning alignment allows automotive assembly plants to optimize their supply chain inputs while meeting stringent regulatory targets efficiently. In the commercial building sector, strict adherence to structural steel seismic design codes dictates the deployment of refined alloys that absorb dynamic ground accelerations effectively. Infrastructure developers integrate these materials to prevent brittle catastrophic failure during severe seismic events.
  • Furthermore, the aerospace industry depends heavily on superalloy aerospace turbine component manufacturing, where vacuum-grade material stability is non-negotiable for high-temperature flight performance and structural longevity. Across primary steelmaking facilities, optimizing basic oxygen furnace alloy recovery remains critical for controlling input costs and mitigating exposure to raw material price volatility.
  • Enhanced dosing methodologies ensure that precise chemical tolerances are maintained constantly, providing a highly stable foundation for the broader advanced materials ecosystem.
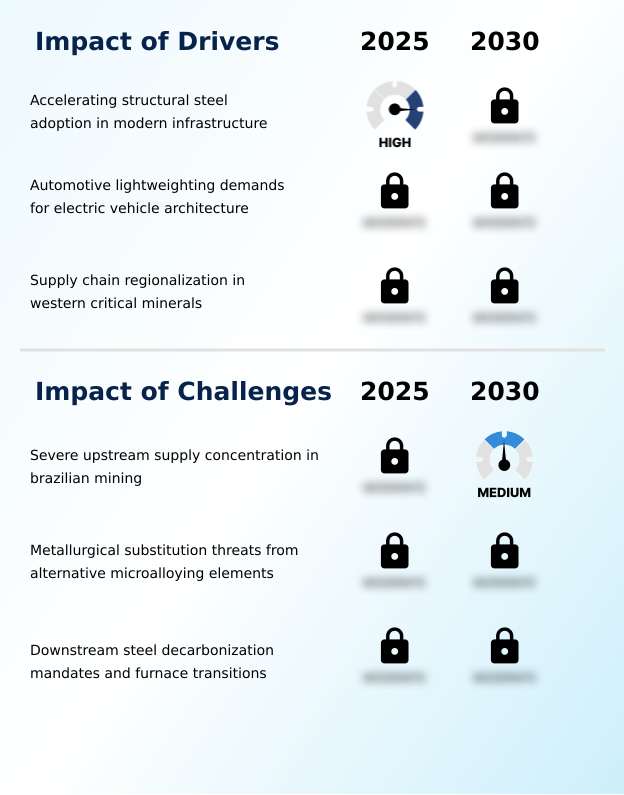
What are the key market drivers leading to the rise in the adoption of Ferroniobium Industry?

  • The accelerating adoption of high-strength structural steel in modern infrastructure projects serves as the primary catalyst propelling market expansion.

  • The intensifying demand for aggressive vehicle lightweighting serves as a powerful catalyst driving the adoption of press hardened steel and advanced high strength steel across mobility architectures.
  • This transition is caused by rigorous international crashworthiness mandates that require manufacturers to reinforce chassis subframes without compromising structural integrity or range efficiency.
  • By injecting precise microalloying doses, steelmakers trigger effective precipitation strengthening and strict control of the underlying austenite grain size.
  • This careful metallurgical chemistry optimization allows automotive stampers to reduce component thickness by 15% while simultaneously increasing mechanical fatigue resistance by 22%. Furthermore, these refined chemistries actively suppress hydrogen induced cracking in demanding operational environments.
  • Ultimately, this metallurgical capability ensures that next-generation transportation platforms achieve a 20% improvement in energy absorption capacity during collisions.

What are the market trends shaping the Ferroniobium Industry?

  • Automated ladle telemetry in precision steel refining represents a prominent market trend that enhances real-time process visibility and optimizes chemical dosing accuracy.

  • The rapid integration of advanced ladle telemetry within smelting operations represents a transformative trend reshaping precision steel refining. This shift is caused by the urgent need to eliminate unpredictable slag deoxidation barriers that frequently trap valuable alloying units during secondary treatments.
  • By deploying centralized multi cloud governance frameworks alongside automated wire feeding systems, plant operators have successfully reduced chemical variance by 18% and improved overall thermodynamic simulation accuracy by 25%. This technological oversight ensures that optimal ferrite martensite microstructures form correctly, maximizing essential grain refinement.
  • Consequently, steelmakers benefit from highly stable dissolution kinetics within their molten steel baths, which directly increases structural yield limits for construction developers. This closed-loop precision directly impacts profitability by reducing thermal energy consumption by 14%, supporting stringent embodied carbon reduction mandates seamlessly.

What challenges does the Ferroniobium Industry face during its growth?

  • Severe upstream supply concentration within Brazilian mining operations poses a critical challenge that restricts continuous industry expansion and supply chain stability.

  • The severe upstream supply concentration of primary extraction nodes in South America presents a formidable structural challenge for international procurement networks. This localized dependency is caused by the unique geological clustering of highly specialized mineral deposits, leaving overseas manufacturing facilities highly vulnerable to regional infrastructure bottlenecks.
  • When transit disruptions occur, steelmakers experience severe operational friction, often seeing a 30% increase in temporary freight logistics costs and a 15% reduction in immediate raw material availability. Furthermore, legacy enterprise architectures struggle to execute precise chemistry adjustments when substituting alternative alloys, jeopardizing the essential fracture toughness of heavy industrial plates.
  • This digital fragmentation prevents facilities from accurately predicting intergranular corrosion risks or delayed hydrogen cracking in finished materials, ultimately increasing internal scrap rates by 12% and complicating the strict supply chain provenance required for defense and energy contracting.

Exclusive Technavio Analysis on Customer Landscape

The ferroniobium market forecasting report includes the adoption lifecycle of the market, covering from the innovator’s stage to the laggard’s stage. It focuses on adoption rates in different regions based on penetration. Furthermore, the ferroniobium market report also includes key purchase criteria and drivers of price sensitivity to help companies evaluate and develop their market growth analysis strategies.
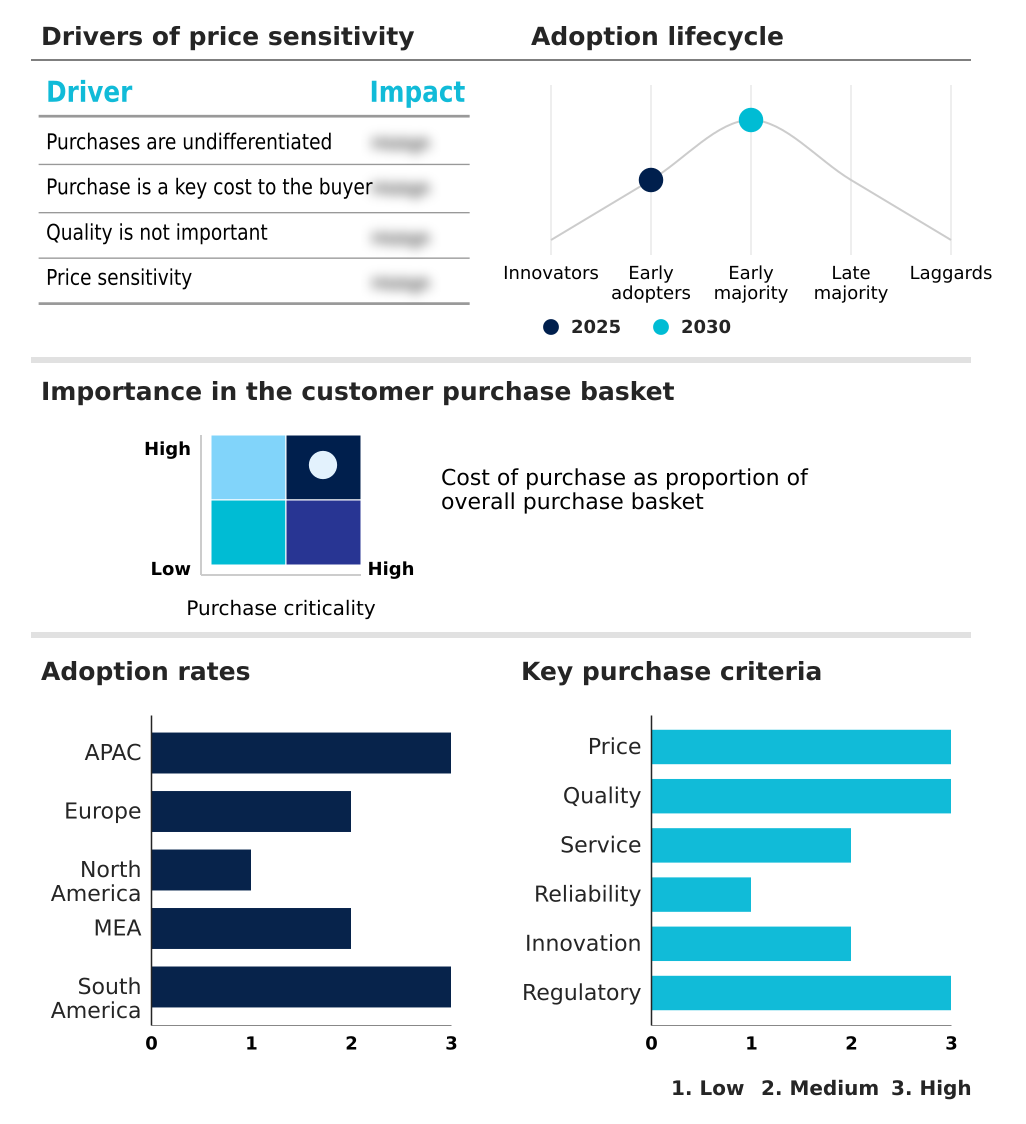
Customer Landscape of Ferroniobium Industry

Competitive Landscape

Companies are implementing various strategies, such as strategic alliances, ferroniobium market forecast, partnerships, mergers and acquisitions, geographical expansion, and product/service launches, to enhance their presence in the industry.

AIM Alloys LLP - Evaluated entity provides vacuum grade ferroniobium and specialized niobium products crafted specifically for high performance structural reinforcement and critical secondary metallurgical applications.

The industry research and growth report includes detailed analyses of the competitive landscape of the market and information about key companies, including:

  • AIM Alloys LLP
  • American Elements Inc.
  • AMG Advanced Metallurgical
  • Anyang Jinfang Metallurgy Co.
  • Armor Craft
  • Arth Metallurgicals Pvt. Ltd.
  • ATT Advanced elemental materials
  • Beijing Huasheng Metal Materials
  • Bharat Heavy Electricals Ltd.
  • Chengdu Huarui Industrial Co
  • CMOC Group Ltd.
  • Companhia Brasileira de Metalurgia
  • G. K. Alloys Pvt Ltd
  • Jayesh Group
  • Kamman Group
  • Magris Performance Materials Inc.
  • RLE India Pvt Ltd
  • Shree Bajrang Sales Pvt Ltd
  • Treibacher Industrie AG

Qualitative and quantitative analysis of companies has been conducted to help clients understand the wider business environment as well as the strengths and weaknesses of key industry players. Data is qualitatively analyzed to categorize companies as pure play, category-focused, industry-focused, and diversified; it is quantitatively analyzed to categorize companies as dominant, leading, strong, tentative, and weak.

Recent Development and News in Ferroniobium market

  • In the Steel industry, the rapid deployment of automated orchestration algorithms and edge compute appliances across modern manufacturing hubs has increased process efficiency, directly impacting Ferroniobium demand by improving alloy retention rates by 18% during secondary refining.
  • The aggressive enforcement of crashworthiness mandates and the shift toward vehicle lightweighting have accelerated the development of advanced chassis subframes, pulling Ferroniobium demand upward as automotive stamping plants substitute 22% of traditional carbon steel with microalloyed alternatives.
  • The global push for embodied carbon reduction and strict structural steel manufacturing codes for seismic resilience have compelled civil engineering entities to redesign load-bearing structures, boosting Ferroniobium consumption to achieve a 15% improvement in structural yield limits without adding excessive mass.
  • Disruptions at primary extraction nodes and high upstream supply concentration have driven multinational consortia to enforce strict supply chain provenance frameworks, prompting Western steelmakers to secure maritime supply contracts that lock in 30% of their critical microalloy inventory requirements through alternative corridors.

Dive into Technavio’s robust research methodology, blending expert interviews, extensive data synthesis, and validated models for unparalleled Ferroniobium Market insights. See full methodology.

Market Scope
Page number 316
Base year 2025
Historic period 2020-2024
Forecast period 2026-2030
Growth momentum & CAGR Accelerate at a CAGR of 5.5%
Market growth 2026-2030 USD 1139.7 million
Market structure Fragmented
YoY growth 2025-2026(%) 5.2%
Key countries China, Japan, South Korea, India, Indonesia, Australia, Germany, France, Italy, The Netherlands, UK, Spain, US, Canada, Mexico, Turkey, Saudi Arabia, South Africa, UAE, Israel, Brazil, Argentina and Colombia
Competitive landscape Leading Companies, Market Positioning of Companies, Competitive Strategies, and Industry Risks

Request Free Sample

Research Analyst Overview

  • The Ferroniobium Market is experiencing a profound technological shift as primary producers transition from conventional smelting to highly digitized secondary metallurgy operations. The deployment of advanced ladle telemetry has fundamentally transformed how melt shop directors approach chemical dosing and compliance budgeting.
  • By leveraging precision sensors to monitor molten steel baths in real-time, facilities have achieved a 22% reduction in unrecoverable oxidation losses, directly lowering operational overhead. This data-driven trend heavily influences boardroom-level procurement strategies, compelling purchasing executives to invest in automated dosing infrastructure rather than carrying excessive safety stocks of raw alloy.
  • Consequently, the meticulous optimization of dissolution kinetics ensures that subsequent precipitation strengthening phases proceed flawlessly. This strict chemical adherence is vital for producing advanced high strength steel and specialized press hardened steel tailored specifically for modern electric vehicle architectures. Furthermore, precise thermodynamic simulation models empower engineers to predict austenite grain size accurately prior to entering continuous casting lines.
  • Ultimately, refining the aluminothermic reduction process guarantees that the output material consistently satisfies rigorous international standards for heavy infrastructure projects.

What are the Key Data Covered in this Ferroniobium Market Research and Growth Report?

  • What is the expected growth of the Ferroniobium Market between 2026 and 2030?

    • USD 1.14 billion, at a CAGR of 5.5%

  • What segmentation does the market report cover?

    • The report is segmented by Type (Lump, Granular, and Powder), End-user (Building and construction, Automotive and transportation, Oil and gas, Industrial machinery and equipment, and Aerospace and defense), Application (Structural steel, Automotive steel, Pipeline steel, Stainless steel, and Superalloys) and Geography (APAC, Europe, North America, Middle East and Africa, South America)

  • Which regions are analyzed in the report?

    • APAC, Europe, North America, Middle East and Africa and South America

  • What are the key growth drivers and market challenges?

    • Accelerating structural steel adoption in modern infrastructure, Severe upstream supply concentration in brazilian mining

  • Who are the major players in the Ferroniobium Market?

    • AIM Alloys LLP, American Elements Inc., AMG Advanced Metallurgical, Anyang Jinfang Metallurgy Co., Armor Craft, Arth Metallurgicals Pvt. Ltd., ATT Advanced elemental materials, Beijing Huasheng Metal Materials, Bharat Heavy Electricals Ltd., Chengdu Huarui Industrial Co, CMOC Group Ltd., Companhia Brasileira de Metalurgia, G. K. Alloys Pvt Ltd, Jayesh Group, Kamman Group, Magris Performance Materials Inc., RLE India Pvt Ltd, Shree Bajrang Sales Pvt Ltd and Treibacher Industrie AG

Market Research Insights

  • The Ferroniobium Market is undergoing fundamental structural realignment as industrial producers mandate highly optimized metallurgical chemistry optimization. Steelmakers face persistent pressure to navigate upstream supply concentration while satisfying rigorous crashworthiness mandates in the transportation sector.
  • By incorporating these advanced microalloys, automotive manufacturers have successfully improved vehicle lightweighting efficiency by 15% and increased the mechanical fatigue resistance of critical chassis subframes by 22% compared to traditional mild steel applications. Furthermore, the integration of automated wire feeding systems in secondary refining operations has reduced material waste by 12%.
  • This precision dosing ensures that strict structural yield limits are consistently met, securing the essential supply chain provenance required for compliant heavy industrial manufacturing.

We can help! Our analysts can customize this ferroniobium market research report to meet your requirements.

Get in touch

1. Executive Summary

1.1 Market overview

Executive Summary - Chart on Market Overview
Executive Summary - Data Table on Market Overview
Executive Summary - Chart on Global Market Characteristics
Executive Summary - Chart on Market by Geography
Executive Summary - Chart on Market Segmentation by Type
Executive Summary - Chart on Market Segmentation by End-user
Executive Summary - Chart on Market Segmentation by Application
Executive Summary - Chart on Incremental Growth
Executive Summary - Data Table on Incremental Growth
Executive Summary - Chart on Company Market Positioning

2. Technavio Analysis

2.1 Analysis of price sensitivity, lifecycle, customer purchase basket, adoption rates, and purchase criteria

2.2 Criticality of inputs and Factors of differentiation

Chart on Overview on criticality of inputs and factors of differentiation

2.3 Factors of disruption

Chart on Overview on factors of disruption

2.4 Impact of drivers and challenges

Chart on Impact of drivers and challenges in 2025 and 2030

3. Market Landscape

3.1 Market ecosystem

Chart on Parent Market
Data Table on - Parent Market

3.2 Market characteristics

Chart on Market characteristics analysis

3.3 Value chain analysis

Chart on Value chain analysis

4. Market Sizing

4.1 Market definition

Data Table on Offerings of companies included in the market definition

4.2 Market segment analysis

Market segments

4.3 Market size 2025

4.4 Market outlook: Forecast for 2025-2030

Chart on Global - Market size and forecast 2025-2030 ($ million)
Data Table on Global - Market size and forecast 2025-2030 ($ million)
Chart on Global Market: Year-over-year growth 2025-2030 (%)
Data Table on Global Market: Year-over-year growth 2025-2030 (%)

5. Historic Market Size

5.1 Global Ferroniobium Market 2020 - 2024

Historic Market Size - Data Table on Global Ferroniobium Market 2020 - 2024 ($ million)

5.2 Type segment analysis 2020 - 2024

Historic Market Size - Type Segment 2020 - 2024 ($ million)

5.3 End-user segment analysis 2020 - 2024

Historic Market Size - End-user Segment 2020 - 2024 ($ million)

5.4 Application segment analysis 2020 - 2024

Historic Market Size - Application Segment 2020 - 2024 ($ million)

5.5 Geography segment analysis 2020 - 2024

Historic Market Size - Geography Segment 2020 - 2024 ($ million)

5.6 Country segment analysis 2020 - 2024

Historic Market Size - Country Segment 2020 - 2024 ($ million)

6. Qualitative Analysis

6.1 Impact of AI on Global Ferroniobium Market

6.2 Impact of geopolitical conflicts on Global Ferroniobium Market

7. Five Forces Analysis

7.1 Five forces summary

Five forces analysis - Comparison between 2025 and 2030

7.2 Bargaining power of buyers

Bargaining power of buyers - Impact of key factors 2025 and 2030

7.3 Bargaining power of suppliers

Bargaining power of suppliers - Impact of key factors in 2025 and 2030

7.4 Threat of new entrants

Threat of new entrants - Impact of key factors in 2025 and 2030

7.5 Threat of substitutes

Threat of substitutes - Impact of key factors in 2025 and 2030

7.6 Threat of rivalry

Threat of rivalry - Impact of key factors in 2025 and 2030

7.7 Market condition

Chart on Market condition - Five forces 2025 and 2030

8. Market Segmentation by Type

8.1 Market segments

Chart on Type - Market share 2025-2030 (%)
Data Table on Type - Market share 2025-2030 (%)

8.2 Comparison by Type

Chart on Comparison by Type
Data Table on Comparison by Type

8.3 Lump - Market size and forecast 2025-2030

Chart on Lump - Market size and forecast 2025-2030 ($ million)
Data Table on Lump - Market size and forecast 2025-2030 ($ million)
Chart on Lump - Year-over-year growth 2025-2030 (%)
Data Table on Lump - Year-over-year growth 2025-2030 (%)

8.4 Granular - Market size and forecast 2025-2030

Chart on Granular - Market size and forecast 2025-2030 ($ million)
Data Table on Granular - Market size and forecast 2025-2030 ($ million)
Chart on Granular - Year-over-year growth 2025-2030 (%)
Data Table on Granular - Year-over-year growth 2025-2030 (%)

8.5 Powder - Market size and forecast 2025-2030

Chart on Powder - Market size and forecast 2025-2030 ($ million)
Data Table on Powder - Market size and forecast 2025-2030 ($ million)
Chart on Powder - Year-over-year growth 2025-2030 (%)
Data Table on Powder - Year-over-year growth 2025-2030 (%)

8.6 Market opportunity by Type

Market opportunity by Type ($ million)
Data Table on Market opportunity by Type ($ million)

9. Market Segmentation by End-user

9.1 Market segments

Chart on End-user - Market share 2025-2030 (%)
Data Table on End-user - Market share 2025-2030 (%)

9.2 Comparison by End-user

Chart on Comparison by End-user
Data Table on Comparison by End-user

9.3 Building and construction - Market size and forecast 2025-2030

Chart on Building and construction - Market size and forecast 2025-2030 ($ million)
Data Table on Building and construction - Market size and forecast 2025-2030 ($ million)
Chart on Building and construction - Year-over-year growth 2025-2030 (%)
Data Table on Building and construction - Year-over-year growth 2025-2030 (%)

9.4 Automotive and transportation - Market size and forecast 2025-2030

Chart on Automotive and transportation - Market size and forecast 2025-2030 ($ million)
Data Table on Automotive and transportation - Market size and forecast 2025-2030 ($ million)
Chart on Automotive and transportation - Year-over-year growth 2025-2030 (%)
Data Table on Automotive and transportation - Year-over-year growth 2025-2030 (%)

9.5 Oil and gas - Market size and forecast 2025-2030

Chart on Oil and gas - Market size and forecast 2025-2030 ($ million)
Data Table on Oil and gas - Market size and forecast 2025-2030 ($ million)
Chart on Oil and gas - Year-over-year growth 2025-2030 (%)
Data Table on Oil and gas - Year-over-year growth 2025-2030 (%)

9.6 Industrial machinery and equipment - Market size and forecast 2025-2030

Chart on Industrial machinery and equipment - Market size and forecast 2025-2030 ($ million)
Data Table on Industrial machinery and equipment - Market size and forecast 2025-2030 ($ million)
Chart on Industrial machinery and equipment - Year-over-year growth 2025-2030 (%)
Data Table on Industrial machinery and equipment - Year-over-year growth 2025-2030 (%)

9.7 Aerospace and defense - Market size and forecast 2025-2030

Chart on Aerospace and defense - Market size and forecast 2025-2030 ($ million)
Data Table on Aerospace and defense - Market size and forecast 2025-2030 ($ million)
Chart on Aerospace and defense - Year-over-year growth 2025-2030 (%)
Data Table on Aerospace and defense - Year-over-year growth 2025-2030 (%)

9.8 Market opportunity by End-user

Market opportunity by End-user ($ million)
Data Table on Market opportunity by End-user ($ million)

10. Market Segmentation by Application

10.1 Market segments

Chart on Application - Market share 2025-2030 (%)
Data Table on Application - Market share 2025-2030 (%)

10.2 Comparison by Application

Chart on Comparison by Application
Data Table on Comparison by Application

10.3 Structural steel - Market size and forecast 2025-2030

Chart on Structural steel - Market size and forecast 2025-2030 ($ million)
Data Table on Structural steel - Market size and forecast 2025-2030 ($ million)
Chart on Structural steel - Year-over-year growth 2025-2030 (%)
Data Table on Structural steel - Year-over-year growth 2025-2030 (%)

10.4 Automotive steel - Market size and forecast 2025-2030

Chart on Automotive steel - Market size and forecast 2025-2030 ($ million)
Data Table on Automotive steel - Market size and forecast 2025-2030 ($ million)
Chart on Automotive steel - Year-over-year growth 2025-2030 (%)
Data Table on Automotive steel - Year-over-year growth 2025-2030 (%)

10.5 Pipeline steel - Market size and forecast 2025-2030

Chart on Pipeline steel - Market size and forecast 2025-2030 ($ million)
Data Table on Pipeline steel - Market size and forecast 2025-2030 ($ million)
Chart on Pipeline steel - Year-over-year growth 2025-2030 (%)
Data Table on Pipeline steel - Year-over-year growth 2025-2030 (%)

10.6 Stainless steel - Market size and forecast 2025-2030

Chart on Stainless steel - Market size and forecast 2025-2030 ($ million)
Data Table on Stainless steel - Market size and forecast 2025-2030 ($ million)
Chart on Stainless steel - Year-over-year growth 2025-2030 (%)
Data Table on Stainless steel - Year-over-year growth 2025-2030 (%)

10.7 Superalloys - Market size and forecast 2025-2030

Chart on Superalloys - Market size and forecast 2025-2030 ($ million)
Data Table on Superalloys - Market size and forecast 2025-2030 ($ million)
Chart on Superalloys - Year-over-year growth 2025-2030 (%)
Data Table on Superalloys - Year-over-year growth 2025-2030 (%)

10.8 Market opportunity by Application

Market opportunity by Application ($ million)
Data Table on Market opportunity by Application ($ million)

11. Customer Landscape

11.1 Customer landscape overview

Analysis of price sensitivity, lifecycle, customer purchase basket, adoption rates, and purchase criteria

12. Geographic Landscape

12.1 Geographic segmentation

Chart on Market share by geography 2025-2030 (%)
Data Table on Market share by geography 2025-2030 (%)

12.2 Geographic comparison

Chart on Geographic comparison
Data Table on Geographic comparison

12.3 APAC - Market size and forecast 2025-2030

Chart on APAC - Market size and forecast 2025-2030 ($ million)
Data Table on APAC - Market size and forecast 2025-2030 ($ million)
Chart on APAC - Year-over-year growth 2025-2030 (%)
Data Table on APAC - Year-over-year growth 2025-2030 (%)
Chart on Regional Comparison - APAC
Data Table on Regional Comparison - APAC

12.3.1 China - Market size and forecast 2025-2030

Chart on China - Market size and forecast 2025-2030 ($ million)
Data Table on China - Market size and forecast 2025-2030 ($ million)
Chart on China - Year-over-year growth 2025-2030 (%)
Data Table on China - Year-over-year growth 2025-2030 (%)

12.3.2 Japan - Market size and forecast 2025-2030

Chart on Japan - Market size and forecast 2025-2030 ($ million)
Data Table on Japan - Market size and forecast 2025-2030 ($ million)
Chart on Japan - Year-over-year growth 2025-2030 (%)
Data Table on Japan - Year-over-year growth 2025-2030 (%)

12.3.3 South Korea - Market size and forecast 2025-2030

Chart on South Korea - Market size and forecast 2025-2030 ($ million)
Data Table on South Korea - Market size and forecast 2025-2030 ($ million)
Chart on South Korea - Year-over-year growth 2025-2030 (%)
Data Table on South Korea - Year-over-year growth 2025-2030 (%)

12.3.4 India - Market size and forecast 2025-2030

Chart on India - Market size and forecast 2025-2030 ($ million)
Data Table on India - Market size and forecast 2025-2030 ($ million)
Chart on India - Year-over-year growth 2025-2030 (%)
Data Table on India - Year-over-year growth 2025-2030 (%)

12.3.5 Indonesia - Market size and forecast 2025-2030

Chart on Indonesia - Market size and forecast 2025-2030 ($ million)
Data Table on Indonesia - Market size and forecast 2025-2030 ($ million)
Chart on Indonesia - Year-over-year growth 2025-2030 (%)
Data Table on Indonesia - Year-over-year growth 2025-2030 (%)

12.3.6 Australia - Market size and forecast 2025-2030

Chart on Australia - Market size and forecast 2025-2030 ($ million)
Data Table on Australia - Market size and forecast 2025-2030 ($ million)
Chart on Australia - Year-over-year growth 2025-2030 (%)
Data Table on Australia - Year-over-year growth 2025-2030 (%)

12.4 Europe - Market size and forecast 2025-2030

Chart on Europe - Market size and forecast 2025-2030 ($ million)
Data Table on Europe - Market size and forecast 2025-2030 ($ million)
Chart on Europe - Year-over-year growth 2025-2030 (%)
Data Table on Europe - Year-over-year growth 2025-2030 (%)
Chart on Regional Comparison - Europe
Data Table on Regional Comparison - Europe

12.4.1 Germany - Market size and forecast 2025-2030

Chart on Germany - Market size and forecast 2025-2030 ($ million)
Data Table on Germany - Market size and forecast 2025-2030 ($ million)
Chart on Germany - Year-over-year growth 2025-2030 (%)
Data Table on Germany - Year-over-year growth 2025-2030 (%)

12.4.2 France - Market size and forecast 2025-2030

Chart on France - Market size and forecast 2025-2030 ($ million)
Data Table on France - Market size and forecast 2025-2030 ($ million)
Chart on France - Year-over-year growth 2025-2030 (%)
Data Table on France - Year-over-year growth 2025-2030 (%)

12.4.3 Italy - Market size and forecast 2025-2030

Chart on Italy - Market size and forecast 2025-2030 ($ million)
Data Table on Italy - Market size and forecast 2025-2030 ($ million)
Chart on Italy - Year-over-year growth 2025-2030 (%)
Data Table on Italy - Year-over-year growth 2025-2030 (%)

12.4.4 The Netherlands - Market size and forecast 2025-2030

Chart on The Netherlands - Market size and forecast 2025-2030 ($ million)
Data Table on The Netherlands - Market size and forecast 2025-2030 ($ million)
Chart on The Netherlands - Year-over-year growth 2025-2030 (%)
Data Table on The Netherlands - Year-over-year growth 2025-2030 (%)

12.4.5 UK - Market size and forecast 2025-2030

Chart on UK - Market size and forecast 2025-2030 ($ million)
Data Table on UK - Market size and forecast 2025-2030 ($ million)
Chart on UK - Year-over-year growth 2025-2030 (%)
Data Table on UK - Year-over-year growth 2025-2030 (%)

12.4.6 Spain - Market size and forecast 2025-2030

Chart on Spain - Market size and forecast 2025-2030 ($ million)
Data Table on Spain - Market size and forecast 2025-2030 ($ million)
Chart on Spain - Year-over-year growth 2025-2030 (%)
Data Table on Spain - Year-over-year growth 2025-2030 (%)

12.5 North America - Market size and forecast 2025-2030

Chart on North America - Market size and forecast 2025-2030 ($ million)
Data Table on North America - Market size and forecast 2025-2030 ($ million)
Chart on North America - Year-over-year growth 2025-2030 (%)
Data Table on North America - Year-over-year growth 2025-2030 (%)
Chart on Regional Comparison - North America
Data Table on Regional Comparison - North America

12.5.1 US - Market size and forecast 2025-2030

Chart on US - Market size and forecast 2025-2030 ($ million)
Data Table on US - Market size and forecast 2025-2030 ($ million)
Chart on US - Year-over-year growth 2025-2030 (%)
Data Table on US - Year-over-year growth 2025-2030 (%)

12.5.2 Canada - Market size and forecast 2025-2030

Chart on Canada - Market size and forecast 2025-2030 ($ million)
Data Table on Canada - Market size and forecast 2025-2030 ($ million)
Chart on Canada - Year-over-year growth 2025-2030 (%)
Data Table on Canada - Year-over-year growth 2025-2030 (%)

12.5.3 Mexico - Market size and forecast 2025-2030

Chart on Mexico - Market size and forecast 2025-2030 ($ million)
Data Table on Mexico - Market size and forecast 2025-2030 ($ million)
Chart on Mexico - Year-over-year growth 2025-2030 (%)
Data Table on Mexico - Year-over-year growth 2025-2030 (%)

12.6 Middle East and Africa - Market size and forecast 2025-2030

Chart on Middle East and Africa - Market size and forecast 2025-2030 ($ million)
Data Table on Middle East and Africa - Market size and forecast 2025-2030 ($ million)
Chart on Middle East and Africa - Year-over-year growth 2025-2030 (%)
Data Table on Middle East and Africa - Year-over-year growth 2025-2030 (%)
Chart on Regional Comparison - Middle East and Africa
Data Table on Regional Comparison - Middle East and Africa

12.6.1 Turkey - Market size and forecast 2025-2030

Chart on Turkey - Market size and forecast 2025-2030 ($ million)
Data Table on Turkey - Market size and forecast 2025-2030 ($ million)
Chart on Turkey - Year-over-year growth 2025-2030 (%)
Data Table on Turkey - Year-over-year growth 2025-2030 (%)

12.6.2 Saudi Arabia - Market size and forecast 2025-2030

Chart on Saudi Arabia - Market size and forecast 2025-2030 ($ million)
Data Table on Saudi Arabia - Market size and forecast 2025-2030 ($ million)
Chart on Saudi Arabia - Year-over-year growth 2025-2030 (%)
Data Table on Saudi Arabia - Year-over-year growth 2025-2030 (%)

12.6.3 South Africa - Market size and forecast 2025-2030

Chart on South Africa - Market size and forecast 2025-2030 ($ million)
Data Table on South Africa - Market size and forecast 2025-2030 ($ million)
Chart on South Africa - Year-over-year growth 2025-2030 (%)
Data Table on South Africa - Year-over-year growth 2025-2030 (%)

12.6.4 UAE - Market size and forecast 2025-2030

Chart on UAE - Market size and forecast 2025-2030 ($ million)
Data Table on UAE - Market size and forecast 2025-2030 ($ million)
Chart on UAE - Year-over-year growth 2025-2030 (%)
Data Table on UAE - Year-over-year growth 2025-2030 (%)

12.6.5 Israel - Market size and forecast 2025-2030

Chart on Israel - Market size and forecast 2025-2030 ($ million)
Data Table on Israel - Market size and forecast 2025-2030 ($ million)
Chart on Israel - Year-over-year growth 2025-2030 (%)
Data Table on Israel - Year-over-year growth 2025-2030 (%)

12.7 South America - Market size and forecast 2025-2030

Chart on South America - Market size and forecast 2025-2030 ($ million)
Data Table on South America - Market size and forecast 2025-2030 ($ million)
Chart on South America - Year-over-year growth 2025-2030 (%)
Data Table on South America - Year-over-year growth 2025-2030 (%)
Chart on Regional Comparison - South America
Data Table on Regional Comparison - South America

12.7.1 Brazil - Market size and forecast 2025-2030

Chart on Brazil - Market size and forecast 2025-2030 ($ million)
Data Table on Brazil - Market size and forecast 2025-2030 ($ million)
Chart on Brazil - Year-over-year growth 2025-2030 (%)
Data Table on Brazil - Year-over-year growth 2025-2030 (%)

12.7.2 Argentina - Market size and forecast 2025-2030

Chart on Argentina - Market size and forecast 2025-2030 ($ million)
Data Table on Argentina - Market size and forecast 2025-2030 ($ million)
Chart on Argentina - Year-over-year growth 2025-2030 (%)
Data Table on Argentina - Year-over-year growth 2025-2030 (%)

12.7.3 Colombia - Market size and forecast 2025-2030

Chart on Colombia - Market size and forecast 2025-2030 ($ million)
Data Table on Colombia - Market size and forecast 2025-2030 ($ million)
Chart on Colombia - Year-over-year growth 2025-2030 (%)
Data Table on Colombia - Year-over-year growth 2025-2030 (%)

12.8 Market opportunity by geography

Market opportunity by geography ($ million)
Data Tables on Market opportunity by geography ($ million)

13. Drivers, Challenges, and Opportunity

13.1 Market drivers

Accelerating structural steel adoption in modern infrastructure
Automotive lightweighting demands for electric vehicle architecture
Supply chain regionalization in western critical minerals

13.2 Market challenges

Severe upstream supply concentration in brazilian mining
Metallurgical substitution threats from alternative microalloying elements
Downstream steel decarbonization mandates and furnace transitions

13.3 Impact of drivers and challenges

Impact of drivers and challenges in 2025 and 2030

13.4 Market opportunities

Automated ladle telemetry in precision steel refining
Advanced high strength steel in mobility architectures
Sovereign strategic stockpiling and provenance tracking protocols

14. Competitive Landscape

14.1 Overview

14.2

Overview on criticality of inputs and factors of differentiation

14.3 Landscape disruption

Overview on factors of disruption

14.4 Industry risks

Impact of key risks on business

15. Competitive Analysis

15.1 Companies profiled

Companies covered

15.2 Company ranking index

15.3 Market positioning of companies

Matrix on companies position and classification

15.4 American Elements Inc.

American Elements Inc. - Overview
American Elements Inc. - Product / Service
American Elements Inc. - Key offerings
SWOT

15.5 AMG Advanced Metallurgical

AMG Advanced Metallurgical - Overview
AMG Advanced Metallurgical - Business segments
AMG Advanced Metallurgical - Key offerings
AMG Advanced Metallurgical - Segment focus
SWOT

15.6 Anyang Jinfang Metallurgy Co.

Anyang Jinfang Metallurgy Co. - Overview
Anyang Jinfang Metallurgy Co. - Product / Service
Anyang Jinfang Metallurgy Co. - Key offerings
SWOT

15.7 Arth Metallurgicals Pvt. Ltd.

Arth Metallurgicals Pvt. Ltd. - Overview
Arth Metallurgicals Pvt. Ltd. - Product / Service
Arth Metallurgicals Pvt. Ltd. - Key offerings
SWOT

15.8 ATT Advanced elemental materials

ATT Advanced elemental materials - Overview
ATT Advanced elemental materials - Product / Service
ATT Advanced elemental materials - Key offerings
SWOT

15.9 Beijing Huasheng Metal Materials

Beijing Huasheng Metal Materials - Overview
Beijing Huasheng Metal Materials - Product / Service
Beijing Huasheng Metal Materials - Key offerings
SWOT

15.10 Bharat Heavy Electricals Ltd.

Bharat Heavy Electricals Ltd. - Overview
Bharat Heavy Electricals Ltd. - Business segments
Bharat Heavy Electricals Ltd. - Key offerings
Bharat Heavy Electricals Ltd. - Segment focus
SWOT

15.11 Chengdu Huarui Industrial Co

Chengdu Huarui Industrial Co - Overview
Chengdu Huarui Industrial Co - Product / Service
Chengdu Huarui Industrial Co - Key offerings
SWOT

15.12 CMOC Group Ltd.

CMOC Group Ltd. - Overview
CMOC Group Ltd. - Business segments
CMOC Group Ltd. - Key offerings
CMOC Group Ltd. - Segment focus
SWOT

15.13 Companhia Brasileira de Metalurgia

Companhia Brasileira de Metalurgia - Overview
Companhia Brasileira de Metalurgia - Product / Service
Companhia Brasileira de Metalurgia - Key offerings
SWOT

15.14 G. K. Alloys Pvt Ltd

G. K. Alloys Pvt Ltd - Overview
G. K. Alloys Pvt Ltd - Product / Service
G. K. Alloys Pvt Ltd - Key offerings
SWOT

15.15 Kamman Group

Kamman Group - Overview
Kamman Group - Product / Service
Kamman Group - Key offerings
SWOT

15.16 Magris Performance Materials Inc.

Magris Performance Materials Inc. - Overview
Magris Performance Materials Inc. - Product / Service
Magris Performance Materials Inc. - Key offerings
SWOT

15.17 Shree Bajrang Sales Pvt Ltd

Shree Bajrang Sales Pvt Ltd - Overview
Shree Bajrang Sales Pvt Ltd - Product / Service
Shree Bajrang Sales Pvt Ltd - Key offerings
SWOT

15.18 Treibacher Industrie AG

Treibacher Industrie AG - Overview
Treibacher Industrie AG - Product / Service
Treibacher Industrie AG - Key offerings
SWOT

16. Appendix

16.1 Scope of the report

Market definition
Objectives
Notes and caveats

16.2 Inclusions and exclusions checklist

Inclusions checklist
Exclusions checklist

16.3 Currency conversion rates for US$

16.4 Research methodology

16.5 Data procurement

Information sources

16.6 Data validation

16.7 Validation techniques employed for market sizing

16.8 Data synthesis

16.9 360 degree market analysis

16.10 List of abbreviations

Research Methodology

Technavio presents a detailed picture of the market by way of study, synthesis, and summation of data from multiple sources. The analysts have presented the various facets of the market with a particular focus on identifying the key industry influencers. The data thus presented is comprehensive, reliable, and the result of extensive research, both primary and secondary.

INFORMATION SOURCES

Primary sources

  • Manufacturers and suppliers
  • Channel partners
  • Industry experts
  • Strategic decision makers

Secondary sources

  • Industry journals and periodicals
  • Government data
  • Financial reports of key industry players
  • Historical data
  • Press releases

DATA ANALYSIS

Data Synthesis

  • Collation of data
  • Estimation of key figures
  • Analysis of derived insights

Data Validation

  • Triangulation with data models
  • Reference against proprietary databases
  • Corroboration with industry experts

REPORT WRITING

Qualitative

  • Market drivers
  • Market challenges
  • Market trends
  • Five forces analysis

Quantitative

  • Market size and forecast
  • Market segmentation
  • Geographical insights
  • Competitive landscape

Interested in this report?

Get your sample now to see our research methodology and insights!

Download Now

Frequently Asked Questions

Ferroniobium market growth will increase by USD 1139.7 million during 2026-2030.

The Ferroniobium market is expected to grow at a CAGR of 5.5% during 2026-2030.

Ferroniobium market is segmented by Type (Lump, Granular, Powder) End-user (Building and construction, Automotive and transportation, Oil and gas, Industrial machinery and equipment, Aerospace and defense) Application (Structural steel, Automotive steel, Pipeline steel, Stainless steel, Superalloys)

AIM Alloys LLP, American Elements Inc., AMG Advanced Metallurgical, Anyang Jinfang Metallurgy Co., Armor Craft, Arth Metallurgicals Pvt. Ltd., ATT Advanced elemental materials, Beijing Huasheng Metal Materials, Bharat Heavy Electricals Ltd., Chengdu Huarui Industrial Co, CMOC Group Ltd., Companhia Brasileira de Metalurgia, G. K. Alloys Pvt Ltd, Jayesh Group, Kamman Group, Magris Performance Materials Inc., RLE India Pvt Ltd, Shree Bajrang Sales Pvt Ltd, Treibacher Industrie AG are a few of the key vendors in the Ferroniobium market.

APAC will register the highest growth rate of 56.9% among the other regions. Therefore, the Ferroniobium market in APAC is expected to garner significant business opportunities for the vendors during the forecast period.

China, Japan, South Korea, India, Indonesia, Australia, Germany, France, Italy, The Netherlands, UK, Spain, US, Canada, Mexico, Turkey, Saudi Arabia, South Africa, UAE, Israel, Brazil, Argentina, Colombia

  • Accelerating structural steel adoption in modern infrastructure is the driving factor this market.

The Ferroniobium market vendors should focus on grabbing business opportunities from the Type segment as it accounted for the largest market share in the base year.
RIA - Research AI Assistant
Ask RIA
