Fiber Based Packaging Market Analysis, Size, and Forecast 2026-2030: APAC (China, Japan, and India), Europe (Germany, UK, and France), North America (US, Canada, and Mexico), South America (Brazil and Argentina), Middle East and Africa (Saudi Arabia, UAE, and South Africa), and Rest of World (ROW)

Fiber Based Packaging Market Analysis, Size, and Forecast 2026-2030:
APAC (China, Japan, and India), Europe (Germany, UK, and France), North America (US, Canada, and Mexico), South America (Brazil and Argentina), Middle East and Africa (Saudi Arabia, UAE, and South Africa), and Rest of World (ROW)

Published: Apr 2026 302 Pages SKU: IRTNTR71409

Market Overview at a Glance

$53.46 B
Market Opportunity
3%
CAGR 2025 - 2030
49.8%
APAC Growth
$76.05 B
Chemical segment 2024

Fiber Based Packaging Market Size 2026-2030

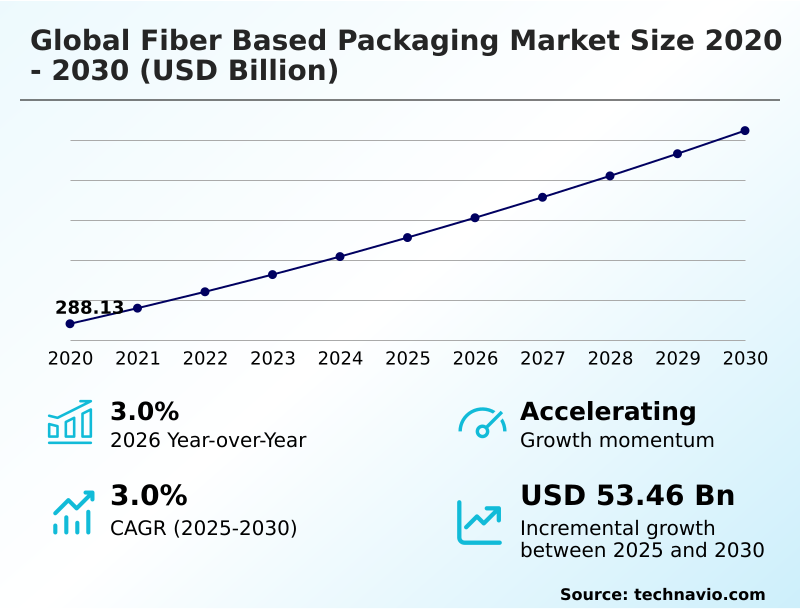
The fiber based packaging market size is valued to increase by USD 53.46 billion, at a CAGR of 3% from 2025 to 2030. Shifting consumer sentiment and corporate sustainability pledges will drive the fiber based packaging market.

Major Market Trends & Insights

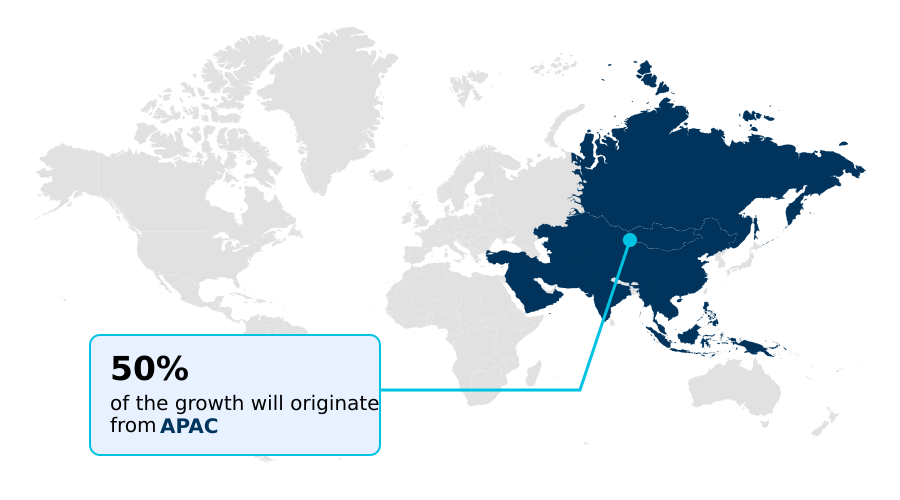
  • APAC dominated the market and accounted for a 49.8% growth during the forecast period.
  • By End-user - Chemical segment was valued at USD 76.05 billion in 2024
  • By Product - Corrugated boxes segment accounted for the largest market revenue share in 2024

Market Size & Forecast

  • Market Opportunities: USD 96.56 billion
  • Market Future Opportunities: USD 53.46 billion
  • CAGR from 2025 to 2030 : 3%

Market Summary

  • The fiber based packaging market is undergoing a significant transformation, driven by a global mandate for sustainability and circularity. This shift is steering the industry away from traditional single-use plastics toward renewable, recyclable, and biodegradable alternatives. Key market dynamics include stringent environmental regulations, growing consumer awareness of plastic pollution, and corporate commitments to reduce carbon footprints.
  • For example, a major consumer goods company might overhaul its entire product line to use only sustainable fiber solutions, from folding cartons to shipping containers. This involves not only changing materials but also redesigning supply chains to prioritize sustainable resource procurement and optimize logistics with lightweighting designs.
  • The challenge lies in achieving this transition without compromising on product protection, shelf life, or cost-effectiveness. Technological innovation in areas like high-performance barrier coatings and molded pulp technology is therefore crucial, enabling fiber-based materials to meet the rigorous demands of industries ranging from food and beverage to electronics and e-commerce.
  • The market's future will be shaped by the ability of manufacturers to deliver scalable, high-performance solutions that align with the principles of a circular economy.

What will be the Size of the Fiber Based Packaging Market during the forecast period?

Get Key Insights on Market Forecast (PDF) Request Free Sample

How is the Fiber Based Packaging Market Segmented?

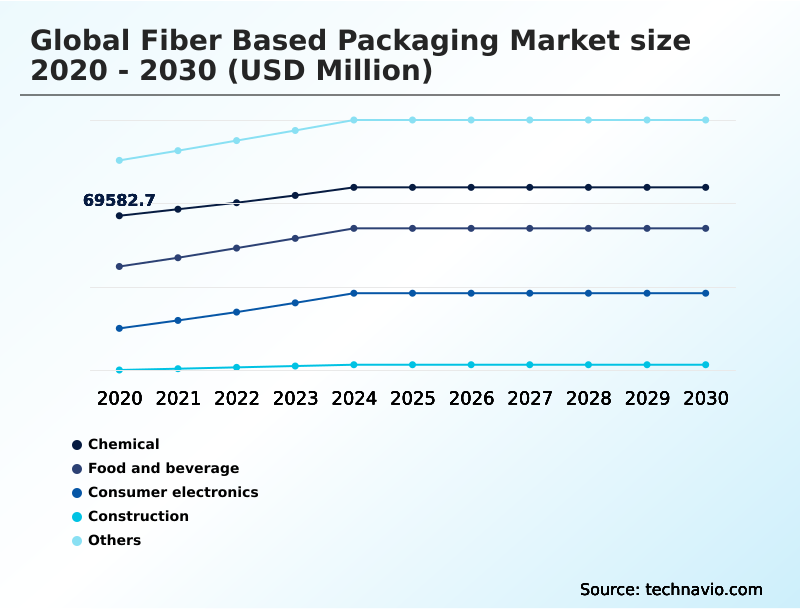
The fiber based packaging industry research report provides comprehensive data (region-wise segment analysis), with forecasts and estimates in "USD million" for the period 2026-2030, as well as historical data from 2020-2024 for the following segments.

  • End-user
    • Chemical
    • Food and beverage
    • Consumer electronics
    • Construction
    • Others
  • Product
    • Corrugated boxes
    • Folding cartons
    • Paper bags and sacks
    • Others
  • Source
    • Recycled fiber
    • Virgin fiber
    • Others
  • Geography
    • APAC
      • China
      • Japan
      • India
    • Europe
      • Germany
      • UK
      • France
    • North America
      • US
      • Canada
      • Mexico
    • South America
      • Brazil
      • Argentina
    • Middle East and Africa
      • Saudi Arabia
      • UAE
      • South Africa
    • Rest of World (ROW)

By End-user Insights

The chemical segment is estimated to witness significant growth during the forecast period.

The industrial chemicals sector is shifting toward sustainable fiber solutions, adopting reinforced fiber containers for non-hazardous material transport. Advanced materials offer enhanced grease and moisture resistance, a critical requirement for product stability.

The focus on lightweighting designs reduces shipping costs and environmental impact, while internal protection is provided by paper-based cushioning and custom molded fiber trays.

This move away from plastics streamlines disposal, feeding directly into the fiber recycling stream rather than landfills. Adoption of these solutions, which include folding cartons and paperboard cartons, has been shown to improve supply chain efficiencies by over 10%.

The versatility of these materials is also driving innovation in specialized fields like medtech packaging and advanced components packaging.

Request Free Sample

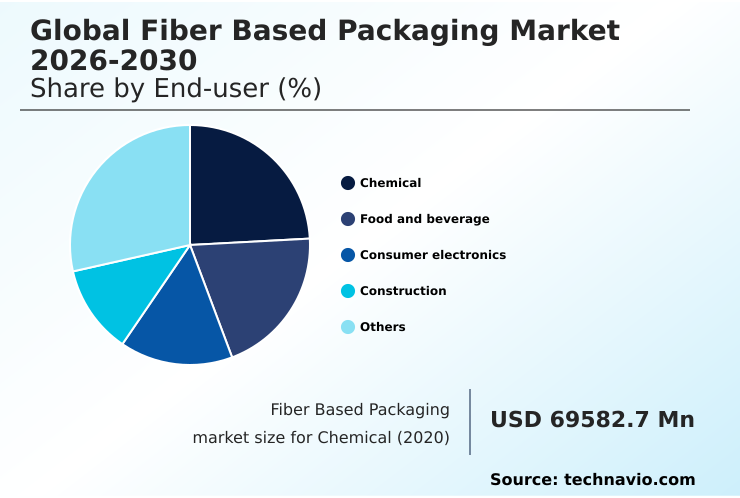
The Chemical segment was valued at USD 76.05 billion in 2024 and showed a gradual increase during the forecast period.

Request Free Sample

Regional Analysis

APAC is estimated to contribute 49.8% to the growth of the global market during the forecast period.Technavio’s analysts have elaborately explained the regional trends and drivers that shape the market during the forecast period.

See How Fiber Based Packaging Market Demand is Rising in APAC Request Free Sample

The geographic landscape of the fiber based packaging market is diversifying, with significant growth in containerboard production across APAC to meet regional demand.

In North America, the e-commerce boom has spurred demand for recyclable paper mailers and other packaging solutions, with some logistics firms reporting a 25% reduction in shipping damages by switching to engineered fiber formats.

European markets are driven by stringent environmental sustainability regulations, promoting the use of paper bags and sacks in retail and biodegradable food packaging.

Manufacturers in regions like South America are focusing on using locally sourced kraft paper to reduce scope three greenhouse gas emissions.

The adoption of smart packaging technologies, including traceability codes, is a global phenomenon, enhancing supply chain transparency from Asia to Europe. This regional specialization is shaping global paperboard manufacturing and industrial packaging supply chains.

Market Dynamics

Our researchers analyzed the data with 2025 as the base year, along with the key drivers, trends, and challenges. A holistic analysis of drivers will help companies refine their marketing strategies to gain a competitive advantage.

  • Navigating the fiber-based packaging market requires a detailed understanding of its complex trade-offs and technical nuances. A critical consideration is the cost-effectiveness of recycled versus virgin fiber, which directly influences sourcing strategies and final product pricing. The technical performance of materials, such as the moisture barrier properties of coated paperboard, determines their suitability for food and beverage applications.
  • The impact of e-commerce on corrugated box design is undeniable, forcing innovations in structural integrity and user experience. This includes exploring the role of molded pulp in electronics packaging and finding effective fiber-based alternatives to plastic bubble wrap.
  • For retail, the performance of paper bags in retail applications and the advancements in digital printing for folding cartons are key to brand presentation. Behind the scenes, there are significant operational hurdles. Meeting regulatory compliance for food-contact paper materials is a non-negotiable and complex process. Managing supply chain risks in global pulp sourcing has become a boardroom-level concern.
  • There remain technological gaps in fiber-based flexible packaging that the industry is racing to close. The ability to accurately assess the recyclability of fiber packaging, especially when dealing with challenges in recycling mixed material paper packaging, is crucial for sustainability claims.
  • Other key areas of R&D include improving grease resistance in foodservice packaging, ensuring automation compatibility of corrugated case designs, and comparing strength of different corrugated flutes for optimization.
  • A comprehensive life cycle assessment of paper-based mailers can reveal truths about environmental impact, while research into the biodegradability of molded fiber in marine environments addresses end-of-life concerns, showing that some fiber products biodegrade up to 90% faster than plastics.
  • This holistic view, covering everything from innovations in lightweighting for industrial packaging to detailed performance metrics, is essential for strategic decision-making.

What are the key market drivers leading to the rise in the adoption of Fiber Based Packaging Industry?

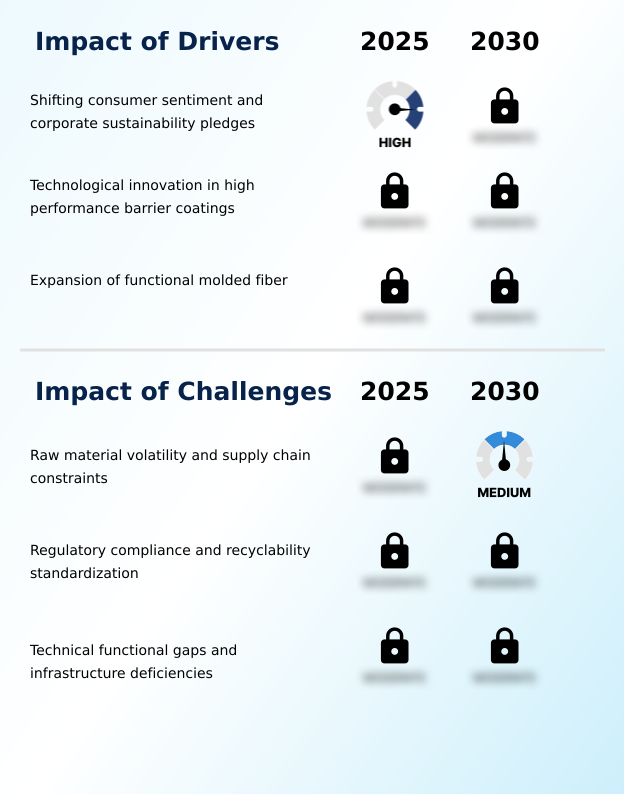
  • Shifting consumer sentiment combined with corporate sustainability pledges serves as a key driver for market growth.

  • Profound shifts in consumer perception and widespread corporate sustainability pledges are primary market drivers. Environmental responsibility is no longer a niche concern, influencing purchasing decisions for everyday consumer packaging.
  • As a result, brands are rapidly adopting single-use plastic alternatives to meet both consumer expectations and regulatory pressures, contributing to a measurable carbon footprint reduction.
  • This has spurred innovation in high-performance barrier coatings, allowing fiber to compete with plastic in demanding applications.
  • According to circular economy principles, retail-ready packaging made from renewable packaging materials is gaining traction, with some retailers reporting a 15% improvement in shelf-stocking efficiency.
  • The use of digital printing on corrugated materials, often sourced according to forest certification standards, allows for sophisticated branding while ensuring supply chain transparency.

What are the market trends shaping the Fiber Based Packaging Industry?

  • The accelerated conversion from plastic to paper-based materials is a significant upcoming trend. This shift is reshaping packaging strategies across multiple industries.

  • The plastic-to-paper conversion continues to accelerate, driven by consumer demand and corporate action. Innovations in molded pulp technology are enabling the creation of complex shapes for electronics and consumer goods, while advancements in de-inking technology improve the quality of recycled materials.
  • A key trend is the development of curbside recyclable solutions, with companies achieving over 95% recyclability rates for new packaging formats. For instance, new flexible paper-based solutions for foodservice packaging are replacing multi-material plastics. This shift also enhances marketing; brands are leveraging packaging for unboxing experience personalization, which has been shown to increase brand loyalty enhancement by up to 20%.
  • The integration of digital watermarks further supports this by enabling interactive consumer experiences.

What challenges does the Fiber Based Packaging Industry face during its growth?

  • Raw material volatility and ongoing supply chain constraints present a key challenge affecting industry growth.

  • The market faces significant hurdles, primarily from raw material volatility and persistent supply chain constraints. Securing consistent virgin fiber sourcing and high-quality post-consumer recycled content at stable prices remains a primary operational challenge. The efficacy of pulp purification technology is critical, yet scaling it to meet demand is capital-intensive, with new plant build-outs taking over 24 months.
  • Furthermore, extended producer responsibility legislation is increasing compliance costs. While heavy-duty corrugated solutions are available for industrial use, optimizing their production requires significant investment in automated packaging lines. Ensuring food-grade safety standards for packaging made from biomaterials and recycled pulp adds another layer of complexity, demanding rigorous testing and sustainable resource procurement protocols.

Exclusive Technavio Analysis on Customer Landscape

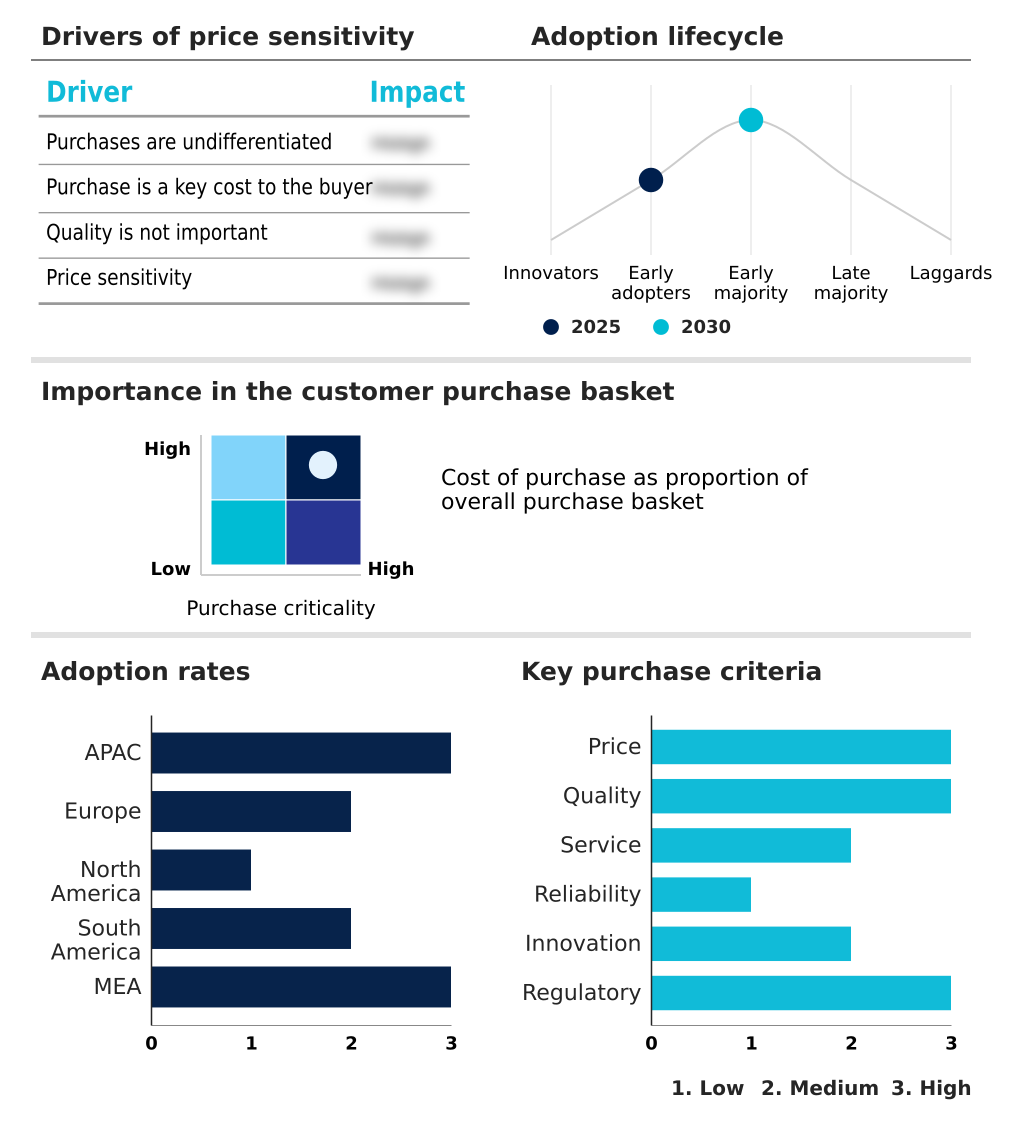
The fiber based packaging market forecasting report includes the adoption lifecycle of the market, covering from the innovator’s stage to the laggard’s stage. It focuses on adoption rates in different regions based on penetration. Furthermore, the fiber based packaging market report also includes key purchase criteria and drivers of price sensitivity to help companies evaluate and develop their market growth analysis strategies.

Customer Landscape of Fiber Based Packaging Industry

Competitive Landscape

Companies are implementing various strategies, such as strategic alliances, fiber based packaging market forecast, partnerships, mergers and acquisitions, geographical expansion, and product/service launches, to enhance their presence in the industry.

Ahlstrom Oyj - Analysis points to a strategic focus on developing sustainable fiber-based materials for advanced filtration, diagnostic, and food packaging applications.

The industry research and growth report includes detailed analyses of the competitive landscape of the market and information about key companies, including:

  • Ahlstrom Oyj
  • Brodrene Hartmann AS
  • Genpak LLC
  • Graphic Packaging Holding Co.
  • Huhtamaki Oyj
  • International Paper Co.
  • Mayr Melnhof Karton AG
  • Mondi Plc
  • Nine Dragons Paper Holdings Ltd.
  • Oji Fiber Solutions
  • Packaging Corp. of America
  • Pactiv Evergreen Inc.
  • Papacks Sales GmbH
  • Pratt Industries Inc.
  • ProAmpac Holdings Inc.
  • Smurfit Westrock plc
  • Sonoco Products Co.
  • Stora Enso Oyj
  • UFP Technologies Inc.

Qualitative and quantitative analysis of companies has been conducted to help clients understand the wider business environment as well as the strengths and weaknesses of key industry players. Data is qualitatively analyzed to categorize companies as pure play, category-focused, industry-focused, and diversified; it is quantitatively analyzed to categorize companies as dominant, leading, strong, tentative, and weak.

Recent Development and News in Fiber based packaging market

  • In February 2025, ProAmpac Holdings Inc. advanced its portfolio by extending its curbside recyclable packaging into new segments like frozen foods and overwraps.
  • In March 2025, Georgia-Pacific initiated full-scale production from a new high-speed US manufacturing line for recyclable paper mailers featuring a proprietary cushioning technology.
  • In April 2025, SCG Packaging Public Company Limited started operations at a new molded fiber plant in Vietnam, targeting the high demand for biodegradable food containers from quick-service restaurants.
  • In May 2025, Amcor plc and Metsa Group formed a strategic alliance to pioneer advanced 3D molded fiber packaging, incorporating specialized lidding and liners for diverse food product applications.

Dive into Technavio’s robust research methodology, blending expert interviews, extensive data synthesis, and validated models for unparalleled Fiber Based Packaging Market insights. See full methodology.

Market Scope
Page number 302
Base year 2025
Historic period 2020-2024
Forecast period 2026-2030
Growth momentum & CAGR Accelerate at a CAGR of 3%
Market growth 2026-2030 USD 53461.7 million
Market structure Fragmented
YoY growth 2025-2026(%) 3.0%
Key countries China, Japan, India, South Korea, Australia, Indonesia, Germany, UK, France, Italy, Spain, The Netherlands, US, Canada, Mexico, Brazil, Argentina, Chile, Saudi Arabia, UAE, South Africa, Israel and Turkey
Competitive landscape Leading Companies, Market Positioning of Companies, Competitive Strategies, and Industry Risks

Request Free Sample

Research Analyst Overview

  • The fiber based packaging market is defined by a dynamic push toward circularity and functional innovation. The industry is moving beyond basic containers, focusing on developing advanced packaging materials and biomaterials that meet specialized needs in sectors like medtech packaging and consumer packaging.
  • Core activities such as containerboard production and paperboard manufacturing are being transformed by efficiency mandates and sustainability targets. We are seeing widespread adoption of molded pulp technology and flexible paper-based solutions, which offer viable alternatives to plastics. The development of high-performance barrier coatings is a critical enabler, providing essential grease and moisture resistance.
  • R&D in pulp purification technology and de-inking technology is improving the quality of post-consumer recycled content, a key input. Companies are engineering lightweighting designs and heavy-duty corrugated solutions to optimize logistics. The use of recyclable paper mailers and molded fiber trays in e-commerce has demonstrated a reduction in material usage by up to 20% compared to legacy solutions.
  • Ultimately, creating effective packaging solutions hinges on integrating everything from virgin fiber sourcing to the final folding cartons and paperboard cartons.

What are the Key Data Covered in this Fiber Based Packaging Market Research and Growth Report?

  • What is the expected growth of the Fiber Based Packaging Market between 2026 and 2030?

    • USD 53.46 billion, at a CAGR of 3%

  • What segmentation does the market report cover?

    • The report is segmented by End-user (Chemical, Food and beverage, Consumer electronics, Construction, and Others), Product (Corrugated boxes, Folding cartons, Paper bags and sacks, and Others), Source (Recycled fiber, Virgin fiber, and Others) and Geography (APAC, Europe, North America, South America, Middle East and Africa)

  • Which regions are analyzed in the report?

    • APAC, Europe, North America, South America and Middle East and Africa

  • What are the key growth drivers and market challenges?

    • Shifting consumer sentiment and corporate sustainability pledges, Raw material volatility and supply chain constraints

  • Who are the major players in the Fiber Based Packaging Market?

    • Ahlstrom Oyj, Brodrene Hartmann AS, Genpak LLC, Graphic Packaging Holding Co., Huhtamaki Oyj, International Paper Co., Mayr Melnhof Karton AG, Mondi Plc, Nine Dragons Paper Holdings Ltd., Oji Fiber Solutions, Packaging Corp. of America, Pactiv Evergreen Inc., Papacks Sales GmbH, Pratt Industries Inc., ProAmpac Holdings Inc., Smurfit Westrock plc, Sonoco Products Co., Stora Enso Oyj and UFP Technologies Inc.

Market Research Insights

  • The market is rapidly evolving beyond simple packaging, driven by a convergence of corporate sustainability pledges and consumer demand for environmental responsibility. The plastic-to-paper conversion is accelerating, with adoption rates in some consumer goods categories increasing by 30% in just two years. This shift is enabled by innovations that address previous material limitations.
  • For instance, new barrier technologies have improved moisture resistance, making biodegradable food packaging a viable option for a wider range of products. The surge in e-commerce packaging demand is also a powerful force, pushing for curbside recyclable solutions that improve logistics efficiency.
  • Companies adopting these solutions report a 10% improvement in customer satisfaction scores related to unboxing experience personalization and sustainability perception.

We can help! Our analysts can customize this fiber based packaging market research report to meet your requirements.

Get in touch

1. Executive Summary

1.1 Market overview

Executive Summary - Chart on Market Overview
Executive Summary - Data Table on Market Overview
Executive Summary - Chart on Global Market Characteristics
Executive Summary - Chart on Market by Geography
Executive Summary - Chart on Market Segmentation by End-user
Executive Summary - Chart on Market Segmentation by Product
Executive Summary - Chart on Market Segmentation by Source
Executive Summary - Chart on Incremental Growth
Executive Summary - Data Table on Incremental Growth
Executive Summary - Chart on Company Market Positioning

2. Technavio Analysis

2.1 Analysis of price sensitivity, lifecycle, customer purchase basket, adoption rates, and purchase criteria

2.2 Criticality of inputs and Factors of differentiation

Chart on Overview on criticality of inputs and factors of differentiation

2.3 Factors of disruption

Chart on Overview on factors of disruption

2.4 Impact of drivers and challenges

Chart on Impact of drivers and challenges in 2025 and 2030

3. Market Landscape

3.1 Market ecosystem

Chart on Parent Market
Data Table on - Parent Market

3.2 Market characteristics

Chart on Market characteristics analysis

3.3 Value chain analysis

Chart on Value chain analysis

4. Market Sizing

4.1 Market definition

Data Table on Offerings of companies included in the market definition

4.2 Market segment analysis

Market segments

4.3 Market size 2025

4.4 Market outlook: Forecast for 2025-2030

Chart on Global - Market size and forecast 2025-2030 ($ million)
Data Table on Global - Market size and forecast 2025-2030 ($ million)
Chart on Global Market: Year-over-year growth 2025-2030 (%)
Data Table on Global Market: Year-over-year growth 2025-2030 (%)

5. Historic Market Size

5.1 Global Fiber Based Packaging Market 2020 - 2024

Historic Market Size - Data Table on Global Fiber Based Packaging Market 2020 - 2024 ($ million)

5.2 End-user segment analysis 2020 - 2024

Historic Market Size - End-user Segment 2020 - 2024 ($ million)

5.3 Product segment analysis 2020 - 2024

Historic Market Size - Product Segment 2020 - 2024 ($ million)

5.4 Source segment analysis 2020 - 2024

Historic Market Size - Source Segment 2020 - 2024 ($ million)

5.5 Geography segment analysis 2020 - 2024

Historic Market Size - Geography Segment 2020 - 2024 ($ million)

5.6 Country segment analysis 2020 - 2024

Historic Market Size - Country Segment 2020 - 2024 ($ million)

6. Qualitative Analysis

6.1 Impact of AI on Global Fiber Based Packaging Market

6.2 Impact of Geopolitical Conflict on Global Fiber Based Packaging Market

7. Five Forces Analysis

7.1 Five forces summary

Five forces analysis - Comparison between 2025 and 2030

7.2 Bargaining power of buyers

Bargaining power of buyers - Impact of key factors 2025 and 2030

7.3 Bargaining power of suppliers

Bargaining power of suppliers - Impact of key factors in 2025 and 2030

7.4 Threat of new entrants

Threat of new entrants - Impact of key factors in 2025 and 2030

7.5 Threat of substitutes

Threat of substitutes - Impact of key factors in 2025 and 2030

7.6 Threat of rivalry

Threat of rivalry - Impact of key factors in 2025 and 2030

7.7 Market condition

Chart on Market condition - Five forces 2025 and 2030

8. Market Segmentation by End-user

8.1 Market segments

Chart on End-user - Market share 2025-2030 (%)
Data Table on End-user - Market share 2025-2030 (%)

8.2 Comparison by End-user

Chart on Comparison by End-user
Data Table on Comparison by End-user

8.3 Chemical - Market size and forecast 2025-2030

Chart on Chemical - Market size and forecast 2025-2030 ($ million)
Data Table on Chemical - Market size and forecast 2025-2030 ($ million)
Chart on Chemical - Year-over-year growth 2025-2030 (%)
Data Table on Chemical - Year-over-year growth 2025-2030 (%)

8.4 Food and beverage - Market size and forecast 2025-2030

Chart on Food and beverage - Market size and forecast 2025-2030 ($ million)
Data Table on Food and beverage - Market size and forecast 2025-2030 ($ million)
Chart on Food and beverage - Year-over-year growth 2025-2030 (%)
Data Table on Food and beverage - Year-over-year growth 2025-2030 (%)

8.5 Consumer electronics - Market size and forecast 2025-2030

Chart on Consumer electronics - Market size and forecast 2025-2030 ($ million)
Data Table on Consumer electronics - Market size and forecast 2025-2030 ($ million)
Chart on Consumer electronics - Year-over-year growth 2025-2030 (%)
Data Table on Consumer electronics - Year-over-year growth 2025-2030 (%)

8.6 Construction - Market size and forecast 2025-2030

Chart on Construction - Market size and forecast 2025-2030 ($ million)
Data Table on Construction - Market size and forecast 2025-2030 ($ million)
Chart on Construction - Year-over-year growth 2025-2030 (%)
Data Table on Construction - Year-over-year growth 2025-2030 (%)

8.7 Others - Market size and forecast 2025-2030

Chart on Others - Market size and forecast 2025-2030 ($ million)
Data Table on Others - Market size and forecast 2025-2030 ($ million)
Chart on Others - Year-over-year growth 2025-2030 (%)
Data Table on Others - Year-over-year growth 2025-2030 (%)

8.8 Market opportunity by End-user

Market opportunity by End-user ($ million)
Data Table on Market opportunity by End-user ($ million)

9. Market Segmentation by Product

9.1 Market segments

Chart on Product - Market share 2025-2030 (%)
Data Table on Product - Market share 2025-2030 (%)

9.2 Comparison by Product

Chart on Comparison by Product
Data Table on Comparison by Product

9.3 Corrugated boxes - Market size and forecast 2025-2030

Chart on Corrugated boxes - Market size and forecast 2025-2030 ($ million)
Data Table on Corrugated boxes - Market size and forecast 2025-2030 ($ million)
Chart on Corrugated boxes - Year-over-year growth 2025-2030 (%)
Data Table on Corrugated boxes - Year-over-year growth 2025-2030 (%)

9.4 Folding cartons - Market size and forecast 2025-2030

Chart on Folding cartons - Market size and forecast 2025-2030 ($ million)
Data Table on Folding cartons - Market size and forecast 2025-2030 ($ million)
Chart on Folding cartons - Year-over-year growth 2025-2030 (%)
Data Table on Folding cartons - Year-over-year growth 2025-2030 (%)

9.5 Paper bags and sacks - Market size and forecast 2025-2030

Chart on Paper bags and sacks - Market size and forecast 2025-2030 ($ million)
Data Table on Paper bags and sacks - Market size and forecast 2025-2030 ($ million)
Chart on Paper bags and sacks - Year-over-year growth 2025-2030 (%)
Data Table on Paper bags and sacks - Year-over-year growth 2025-2030 (%)

9.6 Others - Market size and forecast 2025-2030

Chart on Others - Market size and forecast 2025-2030 ($ million)
Data Table on Others - Market size and forecast 2025-2030 ($ million)
Chart on Others - Year-over-year growth 2025-2030 (%)
Data Table on Others - Year-over-year growth 2025-2030 (%)

9.7 Market opportunity by Product

Market opportunity by Product ($ million)
Data Table on Market opportunity by Product ($ million)

10. Market Segmentation by Source

10.1 Market segments

Chart on Source - Market share 2025-2030 (%)
Data Table on Source - Market share 2025-2030 (%)

10.2 Comparison by Source

Chart on Comparison by Source
Data Table on Comparison by Source

10.3 Recycled fiber - Market size and forecast 2025-2030

Chart on Recycled fiber - Market size and forecast 2025-2030 ($ million)
Data Table on Recycled fiber - Market size and forecast 2025-2030 ($ million)
Chart on Recycled fiber - Year-over-year growth 2025-2030 (%)
Data Table on Recycled fiber - Year-over-year growth 2025-2030 (%)

10.4 Virgin fiber - Market size and forecast 2025-2030

Chart on Virgin fiber - Market size and forecast 2025-2030 ($ million)
Data Table on Virgin fiber - Market size and forecast 2025-2030 ($ million)
Chart on Virgin fiber - Year-over-year growth 2025-2030 (%)
Data Table on Virgin fiber - Year-over-year growth 2025-2030 (%)

10.5 Others - Market size and forecast 2025-2030

Chart on Others - Market size and forecast 2025-2030 ($ million)
Data Table on Others - Market size and forecast 2025-2030 ($ million)
Chart on Others - Year-over-year growth 2025-2030 (%)
Data Table on Others - Year-over-year growth 2025-2030 (%)

10.6 Market opportunity by Source

Market opportunity by Source ($ million)
Data Table on Market opportunity by Source ($ million)

11. Customer Landscape

11.1 Customer landscape overview

Analysis of price sensitivity, lifecycle, customer purchase basket, adoption rates, and purchase criteria

12. Geographic Landscape

12.1 Geographic segmentation

Chart on Market share by geography 2025-2030 (%)
Data Table on Market share by geography 2025-2030 (%)

12.2 Geographic comparison

Chart on Geographic comparison
Data Table on Geographic comparison

12.3 APAC - Market size and forecast 2025-2030

Chart on APAC - Market size and forecast 2025-2030 ($ million)
Data Table on APAC - Market size and forecast 2025-2030 ($ million)
Chart on APAC - Year-over-year growth 2025-2030 (%)
Data Table on APAC - Year-over-year growth 2025-2030 (%)
Chart on Regional Comparison - APAC
Data Table on Regional Comparison - APAC

12.3.1 China - Market size and forecast 2025-2030

Chart on China - Market size and forecast 2025-2030 ($ million)
Data Table on China - Market size and forecast 2025-2030 ($ million)
Chart on China - Year-over-year growth 2025-2030 (%)
Data Table on China - Year-over-year growth 2025-2030 (%)

12.3.2 Japan - Market size and forecast 2025-2030

Chart on Japan - Market size and forecast 2025-2030 ($ million)
Data Table on Japan - Market size and forecast 2025-2030 ($ million)
Chart on Japan - Year-over-year growth 2025-2030 (%)
Data Table on Japan - Year-over-year growth 2025-2030 (%)

12.3.3 India - Market size and forecast 2025-2030

Chart on India - Market size and forecast 2025-2030 ($ million)
Data Table on India - Market size and forecast 2025-2030 ($ million)
Chart on India - Year-over-year growth 2025-2030 (%)
Data Table on India - Year-over-year growth 2025-2030 (%)

12.3.4 South Korea - Market size and forecast 2025-2030

Chart on South Korea - Market size and forecast 2025-2030 ($ million)
Data Table on South Korea - Market size and forecast 2025-2030 ($ million)
Chart on South Korea - Year-over-year growth 2025-2030 (%)
Data Table on South Korea - Year-over-year growth 2025-2030 (%)

12.3.5 Australia - Market size and forecast 2025-2030

Chart on Australia - Market size and forecast 2025-2030 ($ million)
Data Table on Australia - Market size and forecast 2025-2030 ($ million)
Chart on Australia - Year-over-year growth 2025-2030 (%)
Data Table on Australia - Year-over-year growth 2025-2030 (%)

12.3.6 Indonesia - Market size and forecast 2025-2030

Chart on Indonesia - Market size and forecast 2025-2030 ($ million)
Data Table on Indonesia - Market size and forecast 2025-2030 ($ million)
Chart on Indonesia - Year-over-year growth 2025-2030 (%)
Data Table on Indonesia - Year-over-year growth 2025-2030 (%)

12.4 Europe - Market size and forecast 2025-2030

Chart on Europe - Market size and forecast 2025-2030 ($ million)
Data Table on Europe - Market size and forecast 2025-2030 ($ million)
Chart on Europe - Year-over-year growth 2025-2030 (%)
Data Table on Europe - Year-over-year growth 2025-2030 (%)
Chart on Regional Comparison - Europe
Data Table on Regional Comparison - Europe

12.4.1 Germany - Market size and forecast 2025-2030

Chart on Germany - Market size and forecast 2025-2030 ($ million)
Data Table on Germany - Market size and forecast 2025-2030 ($ million)
Chart on Germany - Year-over-year growth 2025-2030 (%)
Data Table on Germany - Year-over-year growth 2025-2030 (%)

12.4.2 UK - Market size and forecast 2025-2030

Chart on UK - Market size and forecast 2025-2030 ($ million)
Data Table on UK - Market size and forecast 2025-2030 ($ million)
Chart on UK - Year-over-year growth 2025-2030 (%)
Data Table on UK - Year-over-year growth 2025-2030 (%)

12.4.3 France - Market size and forecast 2025-2030

Chart on France - Market size and forecast 2025-2030 ($ million)
Data Table on France - Market size and forecast 2025-2030 ($ million)
Chart on France - Year-over-year growth 2025-2030 (%)
Data Table on France - Year-over-year growth 2025-2030 (%)

12.4.4 Italy - Market size and forecast 2025-2030

Chart on Italy - Market size and forecast 2025-2030 ($ million)
Data Table on Italy - Market size and forecast 2025-2030 ($ million)
Chart on Italy - Year-over-year growth 2025-2030 (%)
Data Table on Italy - Year-over-year growth 2025-2030 (%)

12.4.5 Spain - Market size and forecast 2025-2030

Chart on Spain - Market size and forecast 2025-2030 ($ million)
Data Table on Spain - Market size and forecast 2025-2030 ($ million)
Chart on Spain - Year-over-year growth 2025-2030 (%)
Data Table on Spain - Year-over-year growth 2025-2030 (%)

12.4.6 The Netherlands - Market size and forecast 2025-2030

Chart on The Netherlands - Market size and forecast 2025-2030 ($ million)
Data Table on The Netherlands - Market size and forecast 2025-2030 ($ million)
Chart on The Netherlands - Year-over-year growth 2025-2030 (%)
Data Table on The Netherlands - Year-over-year growth 2025-2030 (%)

12.5 North America - Market size and forecast 2025-2030

Chart on North America - Market size and forecast 2025-2030 ($ million)
Data Table on North America - Market size and forecast 2025-2030 ($ million)
Chart on North America - Year-over-year growth 2025-2030 (%)
Data Table on North America - Year-over-year growth 2025-2030 (%)
Chart on Regional Comparison - North America
Data Table on Regional Comparison - North America

12.5.1 US - Market size and forecast 2025-2030

Chart on US - Market size and forecast 2025-2030 ($ million)
Data Table on US - Market size and forecast 2025-2030 ($ million)
Chart on US - Year-over-year growth 2025-2030 (%)
Data Table on US - Year-over-year growth 2025-2030 (%)

12.5.2 Canada - Market size and forecast 2025-2030

Chart on Canada - Market size and forecast 2025-2030 ($ million)
Data Table on Canada - Market size and forecast 2025-2030 ($ million)
Chart on Canada - Year-over-year growth 2025-2030 (%)
Data Table on Canada - Year-over-year growth 2025-2030 (%)

12.5.3 Mexico - Market size and forecast 2025-2030

Chart on Mexico - Market size and forecast 2025-2030 ($ million)
Data Table on Mexico - Market size and forecast 2025-2030 ($ million)
Chart on Mexico - Year-over-year growth 2025-2030 (%)
Data Table on Mexico - Year-over-year growth 2025-2030 (%)

12.6 South America - Market size and forecast 2025-2030

Chart on South America - Market size and forecast 2025-2030 ($ million)
Data Table on South America - Market size and forecast 2025-2030 ($ million)
Chart on South America - Year-over-year growth 2025-2030 (%)
Data Table on South America - Year-over-year growth 2025-2030 (%)
Chart on Regional Comparison - South America
Data Table on Regional Comparison - South America

12.6.1 Brazil - Market size and forecast 2025-2030

Chart on Brazil - Market size and forecast 2025-2030 ($ million)
Data Table on Brazil - Market size and forecast 2025-2030 ($ million)
Chart on Brazil - Year-over-year growth 2025-2030 (%)
Data Table on Brazil - Year-over-year growth 2025-2030 (%)

12.6.2 Argentina - Market size and forecast 2025-2030

Chart on Argentina - Market size and forecast 2025-2030 ($ million)
Data Table on Argentina - Market size and forecast 2025-2030 ($ million)
Chart on Argentina - Year-over-year growth 2025-2030 (%)
Data Table on Argentina - Year-over-year growth 2025-2030 (%)

12.6.3 Chile - Market size and forecast 2025-2030

Chart on Chile - Market size and forecast 2025-2030 ($ million)
Data Table on Chile - Market size and forecast 2025-2030 ($ million)
Chart on Chile - Year-over-year growth 2025-2030 (%)
Data Table on Chile - Year-over-year growth 2025-2030 (%)

12.7 Middle East and Africa - Market size and forecast 2025-2030

Chart on Middle East and Africa - Market size and forecast 2025-2030 ($ million)
Data Table on Middle East and Africa - Market size and forecast 2025-2030 ($ million)
Chart on Middle East and Africa - Year-over-year growth 2025-2030 (%)
Data Table on Middle East and Africa - Year-over-year growth 2025-2030 (%)
Chart on Regional Comparison - Middle East and Africa
Data Table on Regional Comparison - Middle East and Africa

12.7.1 Saudi Arabia - Market size and forecast 2025-2030

Chart on Saudi Arabia - Market size and forecast 2025-2030 ($ million)
Data Table on Saudi Arabia - Market size and forecast 2025-2030 ($ million)
Chart on Saudi Arabia - Year-over-year growth 2025-2030 (%)
Data Table on Saudi Arabia - Year-over-year growth 2025-2030 (%)

12.7.2 UAE - Market size and forecast 2025-2030

Chart on UAE - Market size and forecast 2025-2030 ($ million)
Data Table on UAE - Market size and forecast 2025-2030 ($ million)
Chart on UAE - Year-over-year growth 2025-2030 (%)
Data Table on UAE - Year-over-year growth 2025-2030 (%)

12.7.3 South Africa - Market size and forecast 2025-2030

Chart on South Africa - Market size and forecast 2025-2030 ($ million)
Data Table on South Africa - Market size and forecast 2025-2030 ($ million)
Chart on South Africa - Year-over-year growth 2025-2030 (%)
Data Table on South Africa - Year-over-year growth 2025-2030 (%)

12.7.4 Israel - Market size and forecast 2025-2030

Chart on Israel - Market size and forecast 2025-2030 ($ million)
Data Table on Israel - Market size and forecast 2025-2030 ($ million)
Chart on Israel - Year-over-year growth 2025-2030 (%)
Data Table on Israel - Year-over-year growth 2025-2030 (%)

12.7.5 Turkey - Market size and forecast 2025-2030

Chart on Turkey - Market size and forecast 2025-2030 ($ million)
Data Table on Turkey - Market size and forecast 2025-2030 ($ million)
Chart on Turkey - Year-over-year growth 2025-2030 (%)
Data Table on Turkey - Year-over-year growth 2025-2030 (%)

12.8 Market opportunity by geography

Market opportunity by geography ($ million)
Data Tables on Market opportunity by geography ($ million)

13. Drivers, Challenges, and Opportunity

13.1 Market drivers

Shifting consumer sentiment and corporate sustainability pledges
Technological innovation in high performance barrier coatings
Expansion of functional molded fiber

13.2 Market challenges

Raw material volatility and supply chain constraints
Regulatory compliance and recyclability standardization
Technical functional gaps and infrastructure deficiencies

13.3 Impact of drivers and challenges

Impact of drivers and challenges in 2025 and 2030

13.4 Market opportunities

Accelerated plastic-to-paper conversion
Increasing demand for packaging in food and beverages industry
Increased demand for sustainable packaging solutions in e-commerce sector

14. Competitive Landscape

14.1 Overview

14.2

Overview on criticality of inputs and factors of differentiation

14.3 Landscape disruption

Overview on factors of disruption

14.4 Industry risks

Impact of key risks on business

15. Competitive Analysis

15.1 Companies profiled

Companies covered

15.2 Company ranking index

15.3 Market positioning of companies

Matrix on companies position and classification

15.4 Ahlstrom Oyj

Ahlstrom Oyj - Overview
Ahlstrom Oyj - Product / Service
Ahlstrom Oyj - Key news
Ahlstrom Oyj - Key offerings
SWOT

15.5 Brodrene Hartmann AS

Brodrene Hartmann AS - Overview
Brodrene Hartmann AS - Business segments
Brodrene Hartmann AS - Key offerings
Brodrene Hartmann AS - Segment focus
SWOT

15.6 Graphic Packaging Holding Co.

Graphic Packaging Holding Co. - Overview
Graphic Packaging Holding Co. - Business segments
Graphic Packaging Holding Co. - Key news
Graphic Packaging Holding Co. - Key offerings
Graphic Packaging Holding Co. - Segment focus
SWOT

15.7 Huhtamaki Oyj

Huhtamaki Oyj - Overview
Huhtamaki Oyj - Business segments
Huhtamaki Oyj - Key news
Huhtamaki Oyj - Key offerings
Huhtamaki Oyj - Segment focus
SWOT

15.8 International Paper Co.

International Paper Co. - Overview
International Paper Co. - Business segments
International Paper Co. - Key news
International Paper Co. - Key offerings
International Paper Co. - Segment focus
SWOT

15.9 Mayr Melnhof Karton AG

Mayr Melnhof Karton AG - Overview
Mayr Melnhof Karton AG - Business segments
Mayr Melnhof Karton AG - Key offerings
Mayr Melnhof Karton AG - Segment focus
SWOT

15.10 Mondi Plc

Mondi Plc - Overview
Mondi Plc - Business segments
Mondi Plc - Key news
Mondi Plc - Key offerings
Mondi Plc - Segment focus
SWOT

15.11 Nine Dragons Paper Holdings Ltd.

Nine Dragons Paper Holdings Ltd. - Overview
Nine Dragons Paper Holdings Ltd. - Business segments
Nine Dragons Paper Holdings Ltd. - Key offerings
Nine Dragons Paper Holdings Ltd. - Segment focus
SWOT

15.12 Oji Fiber Solutions

Oji Fiber Solutions - Overview
Oji Fiber Solutions - Product / Service
Oji Fiber Solutions - Key offerings
SWOT

15.13 Packaging Corp. of America

Packaging Corp. of America - Overview
Packaging Corp. of America - Business segments
Packaging Corp. of America - Key offerings
Packaging Corp. of America - Segment focus
SWOT

15.14 ProAmpac Holdings Inc.

ProAmpac Holdings Inc. - Overview
ProAmpac Holdings Inc. - Product / Service
ProAmpac Holdings Inc. - Key offerings
SWOT

15.15 Smurfit Westrock plc

Smurfit Westrock plc - Overview
Smurfit Westrock plc - Business segments
Smurfit Westrock plc - Key offerings
Smurfit Westrock plc - Segment focus
SWOT

15.16 Sonoco Products Co.

Sonoco Products Co. - Overview
Sonoco Products Co. - Business segments
Sonoco Products Co. - Key news
Sonoco Products Co. - Key offerings
Sonoco Products Co. - Segment focus
SWOT

15.17 Stora Enso Oyj

Stora Enso Oyj - Overview
Stora Enso Oyj - Business segments
Stora Enso Oyj - Key offerings
Stora Enso Oyj - Segment focus
SWOT

15.18 UFP Technologies Inc.

UFP Technologies Inc. - Overview
UFP Technologies Inc. - Business segments
UFP Technologies Inc. - Key offerings
UFP Technologies Inc. - Segment focus
SWOT

16. Appendix

16.1 Scope of the report

Market definition
Objectives
Notes and caveats

16.2 Inclusions and exclusions checklist

Inclusions checklist
Exclusions checklist

16.3 Currency conversion rates for US$

16.4 Research methodology

16.5 Data procurement

Information sources

16.6 Data validation

16.7 Validation techniques employed for market sizing

16.8 Data synthesis

16.9 360 degree market analysis

16.10 List of abbreviations

Research Methodology

Technavio presents a detailed picture of the market by way of study, synthesis, and summation of data from multiple sources. The analysts have presented the various facets of the market with a particular focus on identifying the key industry influencers. The data thus presented is comprehensive, reliable, and the result of extensive research, both primary and secondary.

INFORMATION SOURCES

Primary sources

  • Manufacturers and suppliers
  • Channel partners
  • Industry experts
  • Strategic decision makers

Secondary sources

  • Industry journals and periodicals
  • Government data
  • Financial reports of key industry players
  • Historical data
  • Press releases

DATA ANALYSIS

Data Synthesis

  • Collation of data
  • Estimation of key figures
  • Analysis of derived insights

Data Validation

  • Triangulation with data models
  • Reference against proprietary databases
  • Corroboration with industry experts

REPORT WRITING

Qualitative

  • Market drivers
  • Market challenges
  • Market trends
  • Five forces analysis

Quantitative

  • Market size and forecast
  • Market segmentation
  • Geographical insights
  • Competitive landscape

Interested in this report?

Get your sample now to see our research methodology and insights!

Download Now

Frequently Asked Questions

Fiber Based Packaging market growth will increase by USD 53461.7 million during 2026-2030.

The Fiber Based Packaging market is expected to grow at a CAGR of 3% during 2026-2030.

Fiber Based Packaging market is segmented by End-user (Chemical, Food and beverage, Consumer electronics, Construction, Others) Product (Corrugated boxes, Folding cartons, Paper bags and sacks, Others) Source (Recycled fiber, Virgin fiber, Others)

Ahlstrom Oyj, Brodrene Hartmann AS, Genpak LLC, Graphic Packaging Holding Co., Huhtamaki Oyj, International Paper Co., Mayr Melnhof Karton AG, Mondi Plc, Nine Dragons Paper Holdings Ltd., Oji Fiber Solutions, Packaging Corp. of America, Pactiv Evergreen Inc., Papacks Sales GmbH, Pratt Industries Inc., ProAmpac Holdings Inc., Smurfit Westrock plc, Sonoco Products Co., Stora Enso Oyj, UFP Technologies Inc. are a few of the key vendors in the Fiber Based Packaging market.

APAC will register the highest growth rate of 49.8% among the other regions. Therefore, the Fiber Based Packaging market in APAC is expected to garner significant business opportunities for the vendors during the forecast period.

China, Japan, India, South Korea, Australia, Indonesia, Germany, UK, France, Italy, Spain, The Netherlands, US, Canada, Mexico, Brazil, Argentina, Chile, Saudi Arabia, UAE, South Africa, Israel, Turkey

  • Shifting consumer sentiment and corporate sustainability pledges is the driving factor this market.

The Fiber Based Packaging market vendors should focus on grabbing business opportunities from the End-user segment as it accounted for the largest market share in the base year.
RIA - Research AI Assistant
Ask RIA