Fiber Optic Test Equipment Market Analysis, Size, and Forecast 2026-2030: APAC (China, India, and Japan), North America (US, Canada, and Mexico), Europe (Germany, UK, and France), Middle East and Africa (Saudi Arabia, UAE, and South Africa), South America (Brazil, Argentina, and Colombia), and Rest of World (ROW)

Fiber Optic Test Equipment Market Analysis, Size, and Forecast 2026-2030:
APAC (China, India, and Japan), North America (US, Canada, and Mexico), Europe (Germany, UK, and France), Middle East and Africa (Saudi Arabia, UAE, and South Africa), South America (Brazil, Argentina, and Colombia), and Rest of World (ROW)

Published: Dec 2025 300 Pages SKU: IRTNTR81207

Market Overview at a Glance

$396.2 Mn
Market Opportunity
6.2%
CAGR 2025 - 2030
45.2%
APAC Growth
$923.4 Mn
Portable test equipment segment 2024

Fiber Optic Test Equipment Market Size 2026-2030

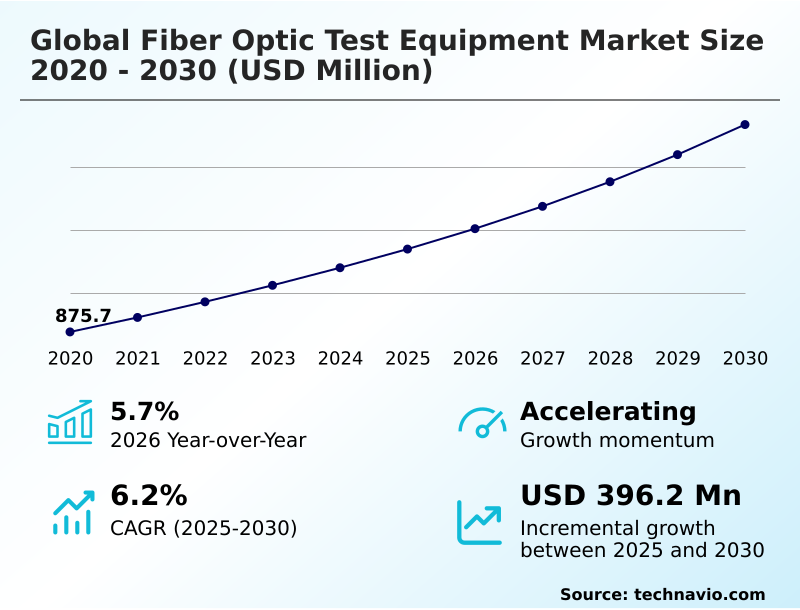
The fiber optic test equipment market size is valued to increase by USD 396.2 million, at a CAGR of 6.2% from 2025 to 2030. Escalation of 5G network deployments will drive the fiber optic test equipment market.

Major Market Trends & Insights

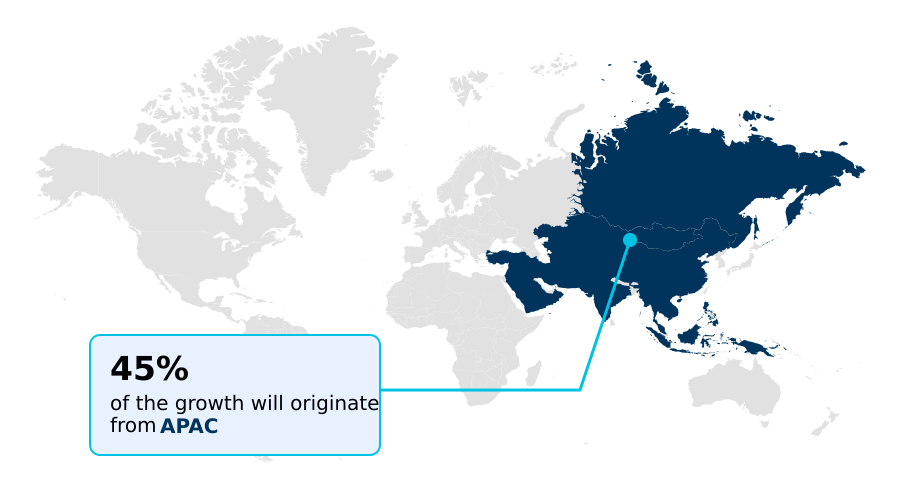
  • APAC dominated the market and accounted for a 45.2% growth during the forecast period.
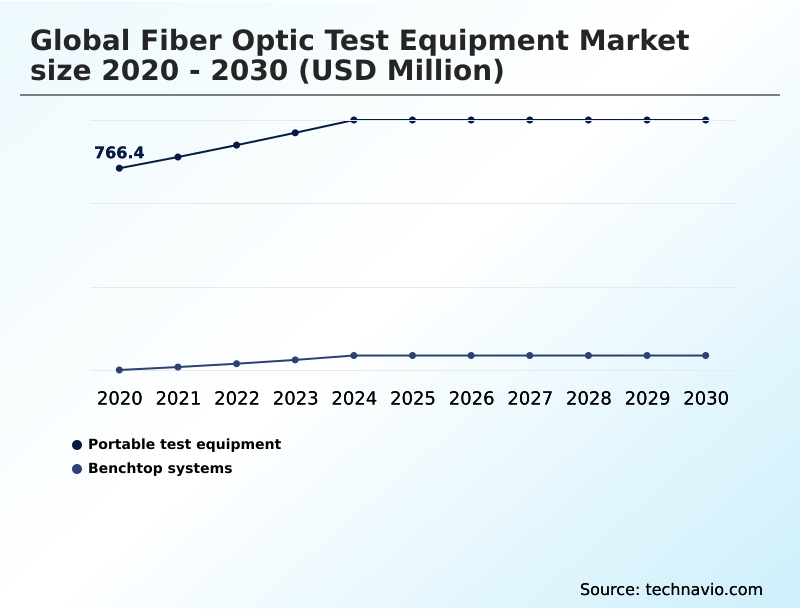
  • By Product - Portable test equipment segment was valued at USD 923.4 million in 2024
  • By Type - OTDR segment accounted for the largest market revenue share in 2024

Market Size & Forecast

  • Market Opportunities: USD 659.8 million
  • Market Future Opportunities: USD 396.2 million
  • CAGR from 2025 to 2030 : 6.2%

Market Summary

  • The Fiber Optic Test Equipment Market is undergoing a significant transformation, driven by the relentless expansion of digital infrastructure. Escalating deployments of 5G, the proliferation of hyperscale data centers for AI, and government-led broadband initiatives are creating an insatiable demand for higher bandwidth and lower latency.
  • This necessitates a shift from basic connectivity verification to sophisticated network certification and performance monitoring. For instance, a telecommunications provider deploying a new metropolitan 400G ethernet network must utilize advanced tools to measure parameters like chromatic dispersion and polarization mode dispersion to guarantee service level agreements. This ensures network reliability and prevents costly outages.
  • However, the increasing complexity of these networks, characterized by technologies such as dense wavelength division multiplexing (DWDM) and passive optical network (PON), presents significant challenges. Compounding this issue is a persistent shortage of skilled technicians capable of operating advanced test equipment, alongside the high capital investment required for these sophisticated tools.
  • Consequently, the industry is moving towards more automated, AI-driven solutions to improve efficiency and mitigate human error.

What will be the Size of the Fiber Optic Test Equipment Market during the forecast period?

Get Key Insights on Market Forecast (PDF) Request Free Sample

How is the Fiber Optic Test Equipment Market Segmented?

The fiber optic test equipment industry research report provides comprehensive data (region-wise segment analysis), with forecasts and estimates in "USD million" for the period 2026-2030, as well as historical data from 2020-2024 for the following segments.

  • Product
    • Portable test equipment
    • Benchtop systems
  • Type
    • OTDR
    • Optical light source
    • Optical power meter
    • Optical loss test set
    • Others
  • End-user
    • Telecommunications
    • Data centers
    • Industrial
    • Others
  • Geography
    • APAC
      • China
      • India
      • Japan
    • North America
      • US
      • Canada
      • Mexico
    • Europe
      • Germany
      • UK
      • France
    • Middle East and Africa
      • Saudi Arabia
      • UAE
      • South Africa
    • South America
      • Brazil
      • Argentina
      • Colombia
    • Rest of World (ROW)

By Product Insights

The portable test equipment segment is estimated to witness significant growth during the forecast period.

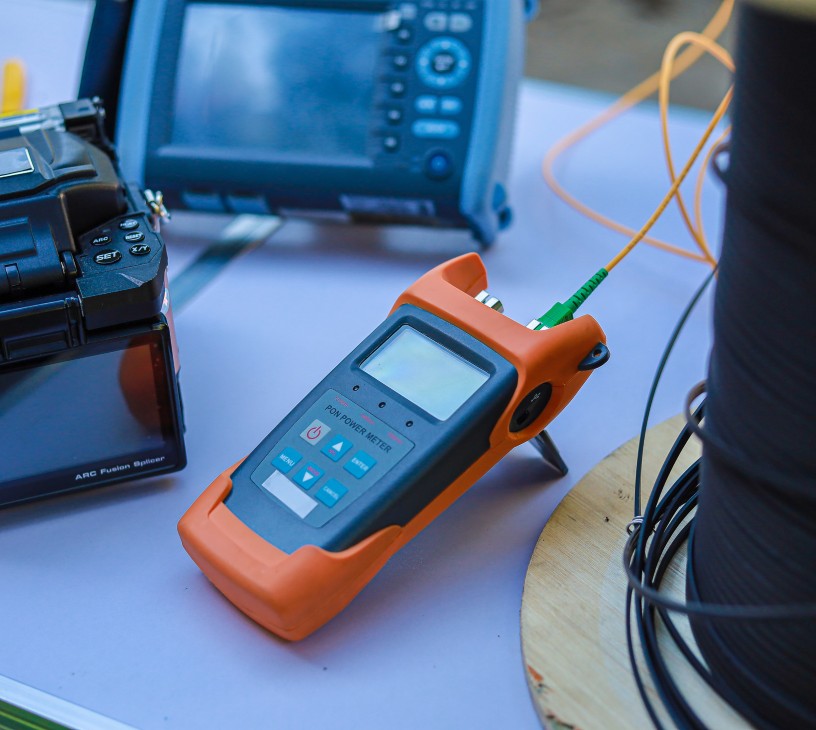
The portable test equipment segment is shaped by extensive fieldwork for network installation, maintenance, and troubleshooting. Field service test equipment is essential for on-the-spot verification of network integrity and performance optimization.

Demand is driven by the need for rugged, multifunctional, and user-friendly devices, with portable optical testing holding a notable 56% share of deployments. Recent developments focus on integrating cloud connectivity for real-time data sharing and remote analysis.

Advanced capabilities like optical channel monitoring, traditionally found in a benchtop system, are now being integrated into handheld tester models to meet the demands of next-generation passive optical network (PON) deployments.

This evolution is critical as simplifying field testing and managing network complexity become top priorities for operators.

Request Free Sample

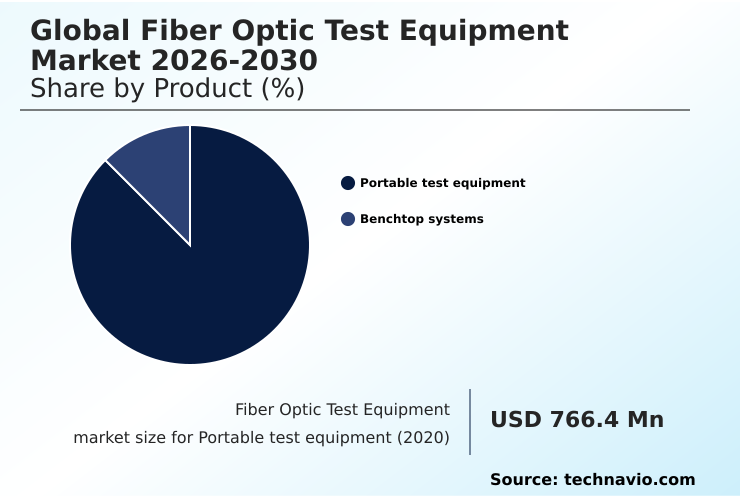
The Portable test equipment segment was valued at USD 923.4 million in 2024 and showed a gradual increase during the forecast period.

Request Free Sample

Regional Analysis

APAC is estimated to contribute 45.2% to the growth of the global market during the forecast period.Technavio’s analysts have elaborately explained the regional trends and drivers that shape the market during the forecast period.

See How Fiber Optic Test Equipment Market Demand is Rising in APAC Request Free Sample

The geographic landscape is led by APAC, which exhibits the market's highest growth at 6.9%, driven by massive infrastructure projects in China and India.

This region's focus on widespread 5G and FTTH rollouts creates substantial demand for tools supporting backhaul and fronthaul installations.

North America follows with a solid 5.9% growth, propelled by government-funded broadband initiatives and the continuous expansion of data center interconnect infrastructure. In this region, validating service level agreements and ensuring network uptime are primary concerns.

Europe, growing at 5.3%, is concentrating on upgrading existing networks and ensuring compliance with stringent performance standards, requiring sophisticated fiber optic network audit tools. Manufacturing test solutions are also crucial as the continent builds out its domestic supply chain.

These regional dynamics underscore a global need for effective troubleshooting fiber links and advanced network performance monitoring capabilities.

Market Dynamics

Our researchers analyzed the data with 2025 as the base year, along with the key drivers, trends, and challenges. A holistic analysis of drivers will help companies refine their marketing strategies to gain a competitive advantage.

  • Strategic network management is evolving beyond basic fault detection to encompass a holistic approach to asset performance and longevity. Operators are now leveraging advanced dwdm channel analysis techniques to maximize the capacity of existing fiber, a critical step for deferring costly new builds.
  • The process of certifying data center fiber links for 800g ethernet compliance testing has become a mission-critical task, as minor physical-layer impairments can cause significant performance degradation in AI workloads.
  • Although the initial cost of fiber optic test equipment can be a barrier, the return on investment is realized through reduced opex with automated testing, which minimizes truck rolls and shortens repair times. For instance, a proactive approach using remote fiber monitoring for security and integrity can reduce service-disrupting incidents by a significant margin compared to reactive maintenance.
  • Key challenges in hollow core fiber testing and the complexities of automating pic wafer-level testing are driving innovation. Best practices for fiber connector cleaning are being standardized to prevent common failure points, especially for mpo connectors. As networks grow, comparing otdr and olts for certification becomes crucial for balancing speed and accuracy.
  • This shift requires training technicians for advanced testing to effectively troubleshoot passive optical network issues and validate latency for 5g fronthaul, ensuring reliability in industrial ethernet and readiness for test solutions for co-packaged optics.
  • Moreover, the demand for portable otdr for ftth installation continues to grow, while otdr testing for long-haul networks and measuring polarization mode dispersion in 400g remain specialized, high-value activities for handheld testers for network maintenance.

What are the key market drivers leading to the rise in the adoption of Fiber Optic Test Equipment Industry?

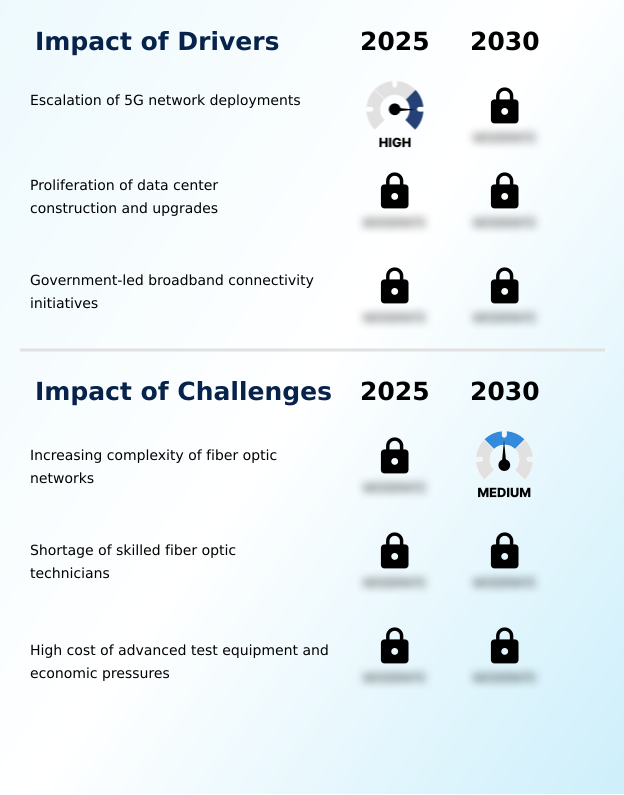
  • The escalating deployment of 5G networks serves as a primary driver for market growth.

  • Market growth is propelled by foundational investments in next-generation infrastructure. The escalation of 5G network deployments globally is a primary driver, as the technology relies on a dense fiber optic backhaul and fronthaul to deliver its low-latency, high-bandwidth promise.
  • This expansion mandates rigorous end-to-end link testing. Another key driver is the unprecedented boom in data center construction, where the fiber density for AI-centric facilities is up to ten times greater than in traditional data centers.
  • Government-led broadband initiatives, which aim to extend high-speed connectivity to underserved areas, also provide significant momentum, often increasing network access by over 40% in targeted regions.
  • These drivers create sustained demand for advanced R&D lab instrumentation and installation and commissioning tools, ensuring network performance monitoring meets high standards.

What are the market trends shaping the Fiber Optic Test Equipment Industry?

  • The proliferation of 5G networks and expansive Internet of Things ecosystems is a significant trend. This development is fundamentally reshaping connectivity demands and infrastructure requirements.

  • Key market trends are centered on enabling higher speeds and greater automation. The surge in hyperscale data center construction, driven by AI workloads, necessitates advanced test solutions that can validate thousands of high-density fiber links with extreme precision.
  • The integration of artificial intelligence into test equipment is a transformational shift, with AI-driven test automation capable of improving diagnostic accuracy by over 25% compared to manual methods. This allows operators to move from reactive troubleshooting to proactive network maintenance. The proliferation of 5G and IoT ecosystems continues to fuel demand for robust FTTH and backhaul networks.
  • This expansion requires efficient field service test equipment and portable optical testing solutions that can accelerate network rollouts; automated fiber inspection tools reduce connector-related failures by up to 60%, significantly improving network uptime.

What challenges does the Fiber Optic Test Equipment Industry face during its growth?

  • The increasing complexity of fiber optic network architectures presents a significant challenge to industry growth.

  • The market faces significant operational and economic challenges. The increasing complexity of fiber optic networks, incorporating technologies like DWDM and high-speed Ethernet, demands highly sophisticated and expensive manufacturing test solutions. This high cost of advanced equipment presents a considerable hurdle for smaller contractors.
  • Furthermore, a persistent shortage of skilled technicians capable of performing advanced fiber characterization services leads to project delays, with some reports indicating an increase in deployment timelines of up to 25% in fast-growing markets.
  • This skills gap makes it difficult to effectively utilize advanced equipment for tasks like troubleshooting fiber links, creating a strong impetus for developing more intuitive and automated testing platforms. The meticulous nature of high-density fiber testing also means that failure to adhere to best practices can increase fault rates by over 50%.

Exclusive Technavio Analysis on Customer Landscape

The fiber optic test equipment market forecasting report includes the adoption lifecycle of the market, covering from the innovator’s stage to the laggard’s stage. It focuses on adoption rates in different regions based on penetration. Furthermore, the fiber optic test equipment market report also includes key purchase criteria and drivers of price sensitivity to help companies evaluate and develop their market growth analysis strategies.

Customer Landscape of Fiber Optic Test Equipment Industry

Competitive Landscape

Companies are implementing various strategies, such as strategic alliances, fiber optic test equipment market forecast, partnerships, mergers and acquisitions, geographical expansion, and product/service launches, to enhance their presence in the industry.

Advantest Corp. - Providers offer advanced test, measurement, and analytics solutions for certifying and managing next-generation communication network infrastructures.

The industry research and growth report includes detailed analyses of the competitive landscape of the market and information about key companies, including:

  • Advantest Corp.
  • AFL
  • Anritsu Corp.
  • AP Sensing GmbH
  • Kingfisher International Pty Ltd.
  • Corning Inc.
  • EXFO Inc.
  • Fluke Corp.
  • Keysight Technologies Inc.
  • Santec Corp.
  • OZ Optics Ltd.
  • Photon Kinetics
  • Thorlabs Inc.
  • VeEX Inc.
  • Viavi Solutions Inc.
  • Landa Pharmacy
  • Yokogawa Electric Corp.

Qualitative and quantitative analysis of companies has been conducted to help clients understand the wider business environment as well as the strengths and weaknesses of key industry players. Data is qualitatively analyzed to categorize companies as pure play, category-focused, industry-focused, and diversified; it is quantitatively analyzed to categorize companies as dominant, leading, strong, tentative, and weak.

Recent Development and News in Fiber optic test equipment market

  • In October, 2024, Vodafone Germany inaugurated its nationwide 5G Standalone network, covering over 92% of the population, a move that requires extensive fiber backhaul testing and validation.
  • In January, 2025, Microsoft announced an investment of approximately $80 billion in AI-enabled data centers for its fiscal year, driving massive demand for high-speed fiber interconnect testing solutions.
  • In February, 2025, a major UK telecom provider launched a large-scale apprenticeship program to cultivate a new generation of fiber technicians, directly addressing the industry-wide shortage of skilled personnel.
  • In March, 2025, VIAVI Solutions showcased a new suite of test solutions specifically designed for AI infrastructure, including advanced connector microscopes and an 800G transport module for field testing platforms.

Dive into Technavio’s robust research methodology, blending expert interviews, extensive data synthesis, and validated models for unparalleled Fiber Optic Test Equipment Market insights. See full methodology.

Market Scope
Page number 300
Base year 2025
Historic period 2020-2024
Forecast period 2026-2030
Growth momentum & CAGR Accelerate at a CAGR of 6.2%
Market growth 2026-2030 USD 396.2 million
Market structure Fragmented
YoY growth 2025-2026(%) 5.7%
Key countries China, India, Japan, South Korea, Australia, Indonesia, US, Canada, Mexico, Germany, UK, France, Italy, Spain, The Netherlands, Saudi Arabia, UAE, South Africa, Israel, Turkey, Brazil, Argentina and Colombia
Competitive landscape Leading Companies, Market Positioning of Companies, Competitive Strategies, and Industry Risks

Request Free Sample

Research Analyst Overview

  • The Fiber Optic Test Equipment Market is fundamentally shaped by the need to validate increasingly complex network infrastructures. Boardroom decisions on capital expenditure are now directly influenced by the technical requirements of deploying 400g ethernet and 800g ethernet, where improper network certification can lead to catastrophic service failures.
  • The transition to coherent optics and dense wavelength division multiplexing (dwdm) demands a higher level of signal integrity, making tools like an optical spectrum analyzer and bit error rate tester (bert) indispensable.
  • The shortage of skilled technicians, which increases project deployment times by an estimated 20% in some high-growth areas, is forcing a strategic shift towards automated solutions for fault detection and analysis. Key measurement parameters such as chromatic dispersion, polarization mode dispersion, insertion loss, return loss, and latency measurement are critical for ensuring network reliability.
  • Equipment ranging from a handheld tester to a full benchtop system is essential. The focus extends to components like the multi-fiber push on connector and emerging technologies like hollow core fiber and the photonic integrated circuit (pic).
  • Tools such as the otdr module, optical power meter, optical light source, optical loss test set, visual fault locator, and fiber inspection probe are vital for ftth, data center interconnect, fronthaul, and backhaul applications.
  • The ultimate goal is to maintain a low optical signal-to-noise ratio and minimal signal attenuation, with remote fiber test system (rfts) platforms enabling proactive optical channel monitoring.

What are the Key Data Covered in this Fiber Optic Test Equipment Market Research and Growth Report?

  • What is the expected growth of the Fiber Optic Test Equipment Market between 2026 and 2030?

    • USD 396.2 million, at a CAGR of 6.2%

  • What segmentation does the market report cover?

    • The report is segmented by Product (Portable test equipment, and Benchtop systems), Type (OTDR, Optical light source, Optical power meter, Optical loss test set, and Others), End-user (Telecommunications, Data centers, Industrial, and Others) and Geography (APAC, North America, Europe, Middle East and Africa, South America)

  • Which regions are analyzed in the report?

    • APAC, North America, Europe, Middle East and Africa and South America

  • What are the key growth drivers and market challenges?

    • Escalation of 5G network deployments, Increasing complexity of fiber optic networks

  • Who are the major players in the Fiber Optic Test Equipment Market?

    • Advantest Corp., AFL, Anritsu Corp., AP Sensing GmbH, Kingfisher International Pty Ltd., Corning Inc., EXFO Inc., Fluke Corp., Keysight Technologies Inc., Santec Corp., OZ Optics Ltd., Photon Kinetics, Thorlabs Inc., VeEX Inc., Viavi Solutions Inc., Landa Pharmacy and Yokogawa Electric Corp.

Market Research Insights

  • The market is defined by a strategic push toward improving operational efficiencies and ensuring network uptime. Advanced test process automation delivers tangible benefits, with some deployments achieving a 40% reduction in certification time. This is critical for managing network complexity and validating service level agreements in high-stakes environments.
  • Furthermore, AI-driven test automation enhances diagnostic precision, with proactive network maintenance capabilities reducing fault-related operational expenditure by up to 30%. End-to-end link testing and real-time network visibility are now standard requirements. Operators are adopting comprehensive fiber characterization services and remote network troubleshooting to maintain performance. Key activities include PON network activation, submarine cable testing, and certifying structured cabling.
  • The focus is on simplifying field testing through advanced installation and commissioning tools while performing thorough fiber optic network audits. This ensures that next-generation network testing meets stringent fiber optic testing standards for optical transport network testing, optical component testing, and high-density fiber testing, ultimately supporting a transition to automated fiber inspection and R&D lab instrumentation.

We can help! Our analysts can customize this fiber optic test equipment market research report to meet your requirements.

Get in touch

1. Executive Summary

1.1 Market overview

Executive Summary - Chart on Market Overview
Executive Summary - Data Table on Market Overview
Executive Summary - Chart on Global Market Characteristics
Executive Summary - Chart on Market by Geography
Executive Summary - Chart on Market Segmentation by Product
Executive Summary - Chart on Market Segmentation by Type
Executive Summary - Chart on Market Segmentation by End-user
Executive Summary - Chart on Incremental Growth
Executive Summary - Data Table on Incremental Growth
Executive Summary - Chart on Company Market Positioning

2. Technavio Analysis

2.1 Analysis of price sensitivity, lifecycle, customer purchase basket, adoption rates, and purchase criteria

2.2 Criticality of inputs and Factors of differentiation

Chart on Overview on criticality of inputs and factors of differentiation

2.3 Factors of disruption

Chart on Overview on factors of disruption

2.4 Impact of drivers and challenges

Chart on Impact of drivers and challenges in 2025 and 2030

3. Market Landscape

3.1 Market ecosystem

Chart on Parent Market
Data Table on - Parent Market

3.2 Market characteristics

Chart on Market characteristics analysis

3.3 Value chain analysis

Chart on Value chain analysis

4. Market Sizing

4.1 Market definition

Data Table on Offerings of companies included in the market definition

4.2 Market segment analysis

Market segments

4.3 Market size 2025

4.4 Market outlook: Forecast for 2025-2030

Chart on Global - Market size and forecast 2025-2030 ($ million)
Data Table on Global - Market size and forecast 2025-2030 ($ million)
Chart on Global Market: Year-over-year growth 2025-2030 (%)
Data Table on Global Market: Year-over-year growth 2025-2030 (%)

5. Historic Market Size

5.1 Global Fiber Optic Test Equipment Market 2020 - 2024

Historic Market Size - Data Table on Global Fiber Optic Test Equipment Market 2020 - 2024 ($ million)

5.2 Product segment analysis 2020 - 2024

Historic Market Size - Product Segment 2020 - 2024 ($ million)

5.3 Type segment analysis 2020 - 2024

Historic Market Size - Type Segment 2020 - 2024 ($ million)

5.4 End-user segment analysis 2020 - 2024

Historic Market Size - End-user Segment 2020 - 2024 ($ million)

5.5 Geography segment analysis 2020 - 2024

Historic Market Size - Geography Segment 2020 - 2024 ($ million)

5.6 Country segment analysis 2020 - 2024

Historic Market Size - Country Segment 2020 - 2024 ($ million)

6. Qualitative Analysis

6.1 The AI impact on global fiber optic test equipment market

7. Five Forces Analysis

7.1 Five forces summary

Five forces analysis - Comparison between 2025 and 2030

7.2 Bargaining power of buyers

Bargaining power of buyers - Impact of key factors 2025 and 2030

7.3 Bargaining power of suppliers

Bargaining power of suppliers - Impact of key factors in 2025 and 2030

7.4 Threat of new entrants

Threat of new entrants - Impact of key factors in 2025 and 2030

7.5 Threat of substitutes

Threat of substitutes - Impact of key factors in 2025 and 2030

7.6 Threat of rivalry

Threat of rivalry - Impact of key factors in 2025 and 2030

7.7 Market condition

Chart on Market condition - Five forces 2025 and 2030

8. Market Segmentation by Product

8.1 Market segments

Chart on Product - Market share 2025-2030 (%)
Data Table on Product - Market share 2025-2030 (%)

8.2 Comparison by Product

Chart on Comparison by Product
Data Table on Comparison by Product

8.3 Portable test equipment - Market size and forecast 2025-2030

Chart on Portable test equipment - Market size and forecast 2025-2030 ($ million)
Data Table on Portable test equipment - Market size and forecast 2025-2030 ($ million)
Chart on Portable test equipment - Year-over-year growth 2025-2030 (%)
Data Table on Portable test equipment - Year-over-year growth 2025-2030 (%)

8.4 Benchtop systems - Market size and forecast 2025-2030

Chart on Benchtop systems - Market size and forecast 2025-2030 ($ million)
Data Table on Benchtop systems - Market size and forecast 2025-2030 ($ million)
Chart on Benchtop systems - Year-over-year growth 2025-2030 (%)
Data Table on Benchtop systems - Year-over-year growth 2025-2030 (%)

8.5 Market opportunity by Product

Market opportunity by Product ($ million)
Data Table on Market opportunity by Product ($ million)

9. Market Segmentation by Type

9.1 Market segments

Chart on Type - Market share 2025-2030 (%)
Data Table on Type - Market share 2025-2030 (%)

9.2 Comparison by Type

Chart on Comparison by Type
Data Table on Comparison by Type

9.3 OTDR - Market size and forecast 2025-2030

Chart on OTDR - Market size and forecast 2025-2030 ($ million)
Data Table on OTDR - Market size and forecast 2025-2030 ($ million)
Chart on OTDR - Year-over-year growth 2025-2030 (%)
Data Table on OTDR - Year-over-year growth 2025-2030 (%)

9.4 Optical light source - Market size and forecast 2025-2030

Chart on Optical light source - Market size and forecast 2025-2030 ($ million)
Data Table on Optical light source - Market size and forecast 2025-2030 ($ million)
Chart on Optical light source - Year-over-year growth 2025-2030 (%)
Data Table on Optical light source - Year-over-year growth 2025-2030 (%)

9.5 Optical power meter - Market size and forecast 2025-2030

Chart on Optical power meter - Market size and forecast 2025-2030 ($ million)
Data Table on Optical power meter - Market size and forecast 2025-2030 ($ million)
Chart on Optical power meter - Year-over-year growth 2025-2030 (%)
Data Table on Optical power meter - Year-over-year growth 2025-2030 (%)

9.6 Optical loss test set - Market size and forecast 2025-2030

Chart on Optical loss test set - Market size and forecast 2025-2030 ($ million)
Data Table on Optical loss test set - Market size and forecast 2025-2030 ($ million)
Chart on Optical loss test set - Year-over-year growth 2025-2030 (%)
Data Table on Optical loss test set - Year-over-year growth 2025-2030 (%)

9.7 Others - Market size and forecast 2025-2030

Chart on Others - Market size and forecast 2025-2030 ($ million)
Data Table on Others - Market size and forecast 2025-2030 ($ million)
Chart on Others - Year-over-year growth 2025-2030 (%)
Data Table on Others - Year-over-year growth 2025-2030 (%)

9.8 Market opportunity by Type

Market opportunity by Type ($ million)
Data Table on Market opportunity by Type ($ million)

10. Market Segmentation by End-user

10.1 Market segments

Chart on End-user - Market share 2025-2030 (%)
Data Table on End-user - Market share 2025-2030 (%)

10.2 Comparison by End-user

Chart on Comparison by End-user
Data Table on Comparison by End-user

10.3 Telecommunications - Market size and forecast 2025-2030

Chart on Telecommunications - Market size and forecast 2025-2030 ($ million)
Data Table on Telecommunications - Market size and forecast 2025-2030 ($ million)
Chart on Telecommunications - Year-over-year growth 2025-2030 (%)
Data Table on Telecommunications - Year-over-year growth 2025-2030 (%)

10.4 Data centers - Market size and forecast 2025-2030

Chart on Data centers - Market size and forecast 2025-2030 ($ million)
Data Table on Data centers - Market size and forecast 2025-2030 ($ million)
Chart on Data centers - Year-over-year growth 2025-2030 (%)
Data Table on Data centers - Year-over-year growth 2025-2030 (%)

10.5 Industrial - Market size and forecast 2025-2030

Chart on Industrial - Market size and forecast 2025-2030 ($ million)
Data Table on Industrial - Market size and forecast 2025-2030 ($ million)
Chart on Industrial - Year-over-year growth 2025-2030 (%)
Data Table on Industrial - Year-over-year growth 2025-2030 (%)

10.6 Others - Market size and forecast 2025-2030

Chart on Others - Market size and forecast 2025-2030 ($ million)
Data Table on Others - Market size and forecast 2025-2030 ($ million)
Chart on Others - Year-over-year growth 2025-2030 (%)
Data Table on Others - Year-over-year growth 2025-2030 (%)

10.7 Market opportunity by End-user

Market opportunity by End-user ($ million)
Data Table on Market opportunity by End-user ($ million)

11. Customer Landscape

11.1 Customer landscape overview

Analysis of price sensitivity, lifecycle, customer purchase basket, adoption rates, and purchase criteria

12. Geographic Landscape

12.1 Geographic segmentation

Chart on Market share by geography 2025-2030 (%)
Data Table on Market share by geography 2025-2030 (%)

12.2 Geographic comparison

Chart on Geographic comparison
Data Table on Geographic comparison

12.3 APAC - Market size and forecast 2025-2030

Chart on APAC - Market size and forecast 2025-2030 ($ million)
Data Table on APAC - Market size and forecast 2025-2030 ($ million)
Chart on APAC - Year-over-year growth 2025-2030 (%)
Data Table on APAC - Year-over-year growth 2025-2030 (%)
Chart on Regional Comparison - APAC
Data Table on Regional Comparison - APAC

12.3.1 China - Market size and forecast 2025-2030

Chart on China - Market size and forecast 2025-2030 ($ million)
Data Table on China - Market size and forecast 2025-2030 ($ million)
Chart on China - Year-over-year growth 2025-2030 (%)
Data Table on China - Year-over-year growth 2025-2030 (%)

12.3.2 India - Market size and forecast 2025-2030

Chart on India - Market size and forecast 2025-2030 ($ million)
Data Table on India - Market size and forecast 2025-2030 ($ million)
Chart on India - Year-over-year growth 2025-2030 (%)
Data Table on India - Year-over-year growth 2025-2030 (%)

12.3.3 Japan - Market size and forecast 2025-2030

Chart on Japan - Market size and forecast 2025-2030 ($ million)
Data Table on Japan - Market size and forecast 2025-2030 ($ million)
Chart on Japan - Year-over-year growth 2025-2030 (%)
Data Table on Japan - Year-over-year growth 2025-2030 (%)

12.3.4 South Korea - Market size and forecast 2025-2030

Chart on South Korea - Market size and forecast 2025-2030 ($ million)
Data Table on South Korea - Market size and forecast 2025-2030 ($ million)
Chart on South Korea - Year-over-year growth 2025-2030 (%)
Data Table on South Korea - Year-over-year growth 2025-2030 (%)

12.3.5 Australia - Market size and forecast 2025-2030

Chart on Australia - Market size and forecast 2025-2030 ($ million)
Data Table on Australia - Market size and forecast 2025-2030 ($ million)
Chart on Australia - Year-over-year growth 2025-2030 (%)
Data Table on Australia - Year-over-year growth 2025-2030 (%)

12.3.6 Indonesia - Market size and forecast 2025-2030

Chart on Indonesia - Market size and forecast 2025-2030 ($ million)
Data Table on Indonesia - Market size and forecast 2025-2030 ($ million)
Chart on Indonesia - Year-over-year growth 2025-2030 (%)
Data Table on Indonesia - Year-over-year growth 2025-2030 (%)

12.4 North America - Market size and forecast 2025-2030

Chart on North America - Market size and forecast 2025-2030 ($ million)
Data Table on North America - Market size and forecast 2025-2030 ($ million)
Chart on North America - Year-over-year growth 2025-2030 (%)
Data Table on North America - Year-over-year growth 2025-2030 (%)
Chart on Regional Comparison - North America
Data Table on Regional Comparison - North America

12.4.1 US - Market size and forecast 2025-2030

Chart on US - Market size and forecast 2025-2030 ($ million)
Data Table on US - Market size and forecast 2025-2030 ($ million)
Chart on US - Year-over-year growth 2025-2030 (%)
Data Table on US - Year-over-year growth 2025-2030 (%)

12.4.2 Canada - Market size and forecast 2025-2030

Chart on Canada - Market size and forecast 2025-2030 ($ million)
Data Table on Canada - Market size and forecast 2025-2030 ($ million)
Chart on Canada - Year-over-year growth 2025-2030 (%)
Data Table on Canada - Year-over-year growth 2025-2030 (%)

12.4.3 Mexico - Market size and forecast 2025-2030

Chart on Mexico - Market size and forecast 2025-2030 ($ million)
Data Table on Mexico - Market size and forecast 2025-2030 ($ million)
Chart on Mexico - Year-over-year growth 2025-2030 (%)
Data Table on Mexico - Year-over-year growth 2025-2030 (%)

12.5 Europe - Market size and forecast 2025-2030

Chart on Europe - Market size and forecast 2025-2030 ($ million)
Data Table on Europe - Market size and forecast 2025-2030 ($ million)
Chart on Europe - Year-over-year growth 2025-2030 (%)
Data Table on Europe - Year-over-year growth 2025-2030 (%)
Chart on Regional Comparison - Europe
Data Table on Regional Comparison - Europe

12.5.1 Germany - Market size and forecast 2025-2030

Chart on Germany - Market size and forecast 2025-2030 ($ million)
Data Table on Germany - Market size and forecast 2025-2030 ($ million)
Chart on Germany - Year-over-year growth 2025-2030 (%)
Data Table on Germany - Year-over-year growth 2025-2030 (%)

12.5.2 UK - Market size and forecast 2025-2030

Chart on UK - Market size and forecast 2025-2030 ($ million)
Data Table on UK - Market size and forecast 2025-2030 ($ million)
Chart on UK - Year-over-year growth 2025-2030 (%)
Data Table on UK - Year-over-year growth 2025-2030 (%)

12.5.3 France - Market size and forecast 2025-2030

Chart on France - Market size and forecast 2025-2030 ($ million)
Data Table on France - Market size and forecast 2025-2030 ($ million)
Chart on France - Year-over-year growth 2025-2030 (%)
Data Table on France - Year-over-year growth 2025-2030 (%)

12.5.4 Italy - Market size and forecast 2025-2030

Chart on Italy - Market size and forecast 2025-2030 ($ million)
Data Table on Italy - Market size and forecast 2025-2030 ($ million)
Chart on Italy - Year-over-year growth 2025-2030 (%)
Data Table on Italy - Year-over-year growth 2025-2030 (%)

12.5.5 Spain - Market size and forecast 2025-2030

Chart on Spain - Market size and forecast 2025-2030 ($ million)
Data Table on Spain - Market size and forecast 2025-2030 ($ million)
Chart on Spain - Year-over-year growth 2025-2030 (%)
Data Table on Spain - Year-over-year growth 2025-2030 (%)

12.5.6 The Netherlands - Market size and forecast 2025-2030

Chart on The Netherlands - Market size and forecast 2025-2030 ($ million)
Data Table on The Netherlands - Market size and forecast 2025-2030 ($ million)
Chart on The Netherlands - Year-over-year growth 2025-2030 (%)
Data Table on The Netherlands - Year-over-year growth 2025-2030 (%)

12.6 Middle East and Africa - Market size and forecast 2025-2030

Chart on Middle East and Africa - Market size and forecast 2025-2030 ($ million)
Data Table on Middle East and Africa - Market size and forecast 2025-2030 ($ million)
Chart on Middle East and Africa - Year-over-year growth 2025-2030 (%)
Data Table on Middle East and Africa - Year-over-year growth 2025-2030 (%)
Chart on Regional Comparison - Middle East and Africa
Data Table on Regional Comparison - Middle East and Africa

12.6.1 Saudi Arabia - Market size and forecast 2025-2030

Chart on Saudi Arabia - Market size and forecast 2025-2030 ($ million)
Data Table on Saudi Arabia - Market size and forecast 2025-2030 ($ million)
Chart on Saudi Arabia - Year-over-year growth 2025-2030 (%)
Data Table on Saudi Arabia - Year-over-year growth 2025-2030 (%)

12.6.2 UAE - Market size and forecast 2025-2030

Chart on UAE - Market size and forecast 2025-2030 ($ million)
Data Table on UAE - Market size and forecast 2025-2030 ($ million)
Chart on UAE - Year-over-year growth 2025-2030 (%)
Data Table on UAE - Year-over-year growth 2025-2030 (%)

12.6.3 South Africa - Market size and forecast 2025-2030

Chart on South Africa - Market size and forecast 2025-2030 ($ million)
Data Table on South Africa - Market size and forecast 2025-2030 ($ million)
Chart on South Africa - Year-over-year growth 2025-2030 (%)
Data Table on South Africa - Year-over-year growth 2025-2030 (%)

12.6.4 Israel - Market size and forecast 2025-2030

Chart on Israel - Market size and forecast 2025-2030 ($ million)
Data Table on Israel - Market size and forecast 2025-2030 ($ million)
Chart on Israel - Year-over-year growth 2025-2030 (%)
Data Table on Israel - Year-over-year growth 2025-2030 (%)

12.6.5 Turkey - Market size and forecast 2025-2030

Chart on Turkey - Market size and forecast 2025-2030 ($ million)
Data Table on Turkey - Market size and forecast 2025-2030 ($ million)
Chart on Turkey - Year-over-year growth 2025-2030 (%)
Data Table on Turkey - Year-over-year growth 2025-2030 (%)

12.7 South America - Market size and forecast 2025-2030

Chart on South America - Market size and forecast 2025-2030 ($ million)
Data Table on South America - Market size and forecast 2025-2030 ($ million)
Chart on South America - Year-over-year growth 2025-2030 (%)
Data Table on South America - Year-over-year growth 2025-2030 (%)
Chart on Regional Comparison - South America
Data Table on Regional Comparison - South America

12.7.1 Brazil - Market size and forecast 2025-2030

Chart on Brazil - Market size and forecast 2025-2030 ($ million)
Data Table on Brazil - Market size and forecast 2025-2030 ($ million)
Chart on Brazil - Year-over-year growth 2025-2030 (%)
Data Table on Brazil - Year-over-year growth 2025-2030 (%)

12.7.2 Argentina - Market size and forecast 2025-2030

Chart on Argentina - Market size and forecast 2025-2030 ($ million)
Data Table on Argentina - Market size and forecast 2025-2030 ($ million)
Chart on Argentina - Year-over-year growth 2025-2030 (%)
Data Table on Argentina - Year-over-year growth 2025-2030 (%)

12.7.3 Colombia - Market size and forecast 2025-2030

Chart on Colombia - Market size and forecast 2025-2030 ($ million)
Data Table on Colombia - Market size and forecast 2025-2030 ($ million)
Chart on Colombia - Year-over-year growth 2025-2030 (%)
Data Table on Colombia - Year-over-year growth 2025-2030 (%)

12.8 Market opportunity by geography

Market opportunity by geography ($ million)
Data Tables on Market opportunity by geography ($ million)

13. Drivers, Challenges, and Opportunity

13.1 Market drivers

Escalation of 5G network deployments
Proliferation of data center construction and upgrades
Government-led broadband connectivity initiatives

13.2 Market challenges

Increasing complexity of fiber optic networks
Shortage of skilled fiber optic technicians
High cost of advanced test equipment and economic pressures

13.3 Impact of drivers and challenges

Impact of drivers and challenges in 2025 and 2030

13.4 Market opportunities

Proliferation of 5G networks and internet of things ecosystems
Integration of AI and automation in network testing
Surge in hyperscale data center construction and high speed upgrades

14. Competitive Landscape

14.1 Overview

14.2

Overview on criticality of inputs and factors of differentiation

14.3 Landscape disruption

Overview on factors of disruption

14.4 Industry risks

Impact of key risks on business

15. Competitive Analysis

15.1 Companies profiled

Companies covered

15.2 Company ranking index

15.3 Market positioning of companies

Matrix on companies position and classification

15.4 AFL

AFL - Overview
AFL - Product / Service
AFL - Key offerings
SWOT

15.5 Anritsu Corp.

Anritsu Corp. - Overview
Anritsu Corp. - Business segments
Anritsu Corp. - Key offerings
Anritsu Corp. - Segment focus
SWOT

15.6 Kingfisher International Pty Ltd.

Kingfisher International Pty Ltd. - Overview
Kingfisher International Pty Ltd. - Product / Service
Kingfisher International Pty Ltd. - Key offerings
SWOT

15.7 Corning Inc.

Corning Inc. - Overview
Corning Inc. - Business segments
Corning Inc. - Key offerings
Corning Inc. - Segment focus
SWOT

15.8 EXFO Inc.

EXFO Inc. - Overview
EXFO Inc. - Product / Service
EXFO Inc. - Key offerings
SWOT

15.9 Fluke Corp.

Fluke Corp. - Overview
Fluke Corp. - Product / Service
Fluke Corp. - Key offerings
SWOT

15.10 Keysight Technologies Inc.

Keysight Technologies Inc. - Overview
Keysight Technologies Inc. - Business segments
Keysight Technologies Inc. - Key news
Keysight Technologies Inc. - Key offerings
Keysight Technologies Inc. - Segment focus
SWOT

15.11 Santec Corp.

Santec Corp. - Overview
Santec Corp. - Product / Service
Santec Corp. - Key offerings
SWOT

15.12 OZ Optics Ltd.

OZ Optics Ltd. - Overview
OZ Optics Ltd. - Product / Service
OZ Optics Ltd. - Key offerings
SWOT

15.13 Photon Kinetics

Photon Kinetics - Overview
Photon Kinetics - Product / Service
Photon Kinetics - Key offerings
SWOT

15.14 Thorlabs Inc.

Thorlabs Inc. - Overview
Thorlabs Inc. - Product / Service
Thorlabs Inc. - Key offerings
SWOT

15.15 VeEX Inc.

VeEX Inc. - Overview
VeEX Inc. - Product / Service
VeEX Inc. - Key offerings
SWOT

15.16 Viavi Solutions Inc.

Viavi Solutions Inc. - Overview
Viavi Solutions Inc. - Business segments
Viavi Solutions Inc. - Key news
Viavi Solutions Inc. - Key offerings
Viavi Solutions Inc. - Segment focus
SWOT

15.17 Landa Pharmacy

Landa Pharmacy - Overview
Landa Pharmacy - Product / Service
Landa Pharmacy - Key offerings
SWOT

15.18 Yokogawa Electric Corp.

Yokogawa Electric Corp. - Overview
Yokogawa Electric Corp. - Business segments
Yokogawa Electric Corp. - Key news
Yokogawa Electric Corp. - Key offerings
Yokogawa Electric Corp. - Segment focus
SWOT

16. Appendix

16.1 Scope of the report

Market definition
Objectives
Notes and caveats

16.2 Inclusions and exclusions checklist

Inclusions checklist
Exclusions checklist

16.3 Currency conversion rates for US$

16.4 Research methodology

16.5 Data procurement

Information sources

16.6 Data validation

16.7 Validation techniques employed for market sizing

16.8 Data synthesis

16.9 360 degree market analysis

16.10 List of abbreviations

Research Methodology

Technavio presents a detailed picture of the market by way of study, synthesis, and summation of data from multiple sources. The analysts have presented the various facets of the market with a particular focus on identifying the key industry influencers. The data thus presented is comprehensive, reliable, and the result of extensive research, both primary and secondary.

INFORMATION SOURCES

Primary sources

  • Manufacturers and suppliers
  • Channel partners
  • Industry experts
  • Strategic decision makers

Secondary sources

  • Industry journals and periodicals
  • Government data
  • Financial reports of key industry players
  • Historical data
  • Press releases

DATA ANALYSIS

Data Synthesis

  • Collation of data
  • Estimation of key figures
  • Analysis of derived insights

Data Validation

  • Triangulation with data models
  • Reference against proprietary databases
  • Corroboration with industry experts

REPORT WRITING

Qualitative

  • Market drivers
  • Market challenges
  • Market trends
  • Five forces analysis

Quantitative

  • Market size and forecast
  • Market segmentation
  • Geographical insights
  • Competitive landscape

Interested in this report?

Get your sample now to see our research methodology and insights!

Download Now

Frequently Asked Questions

Fiber Optic Test Equipment market growth will increase by USD 396.2 million during 2026-2030 .

The Fiber Optic Test Equipment market is expected to grow at a CAGR of 6.2% during 2026-2030 .

Fiber Optic Test Equipment market is segmented by Product (Portable test equipment, Benchtop systems) Type (OTDR, Optical light source, Optical power meter, Optical loss test set, Others) End-user (Telecommunications, Data centers, Industrial, Others)

Advantest Corp., AFL, Anritsu Corp., AP Sensing GmbH, Kingfisher International Pty Ltd., Corning Inc., EXFO Inc., Fluke Corp., Keysight Technologies Inc., Santec Corp., OZ Optics Ltd., Photon Kinetics, Thorlabs Inc., VeEX Inc., Viavi Solutions Inc., Landa Pharmacy, Yokogawa Electric Corp. are a few of the key vendors in the Fiber Optic Test Equipment market.

APAC will register the highest growth rate of 45.2% among the other regions. Therefore, the Fiber Optic Test Equipment market in APAC is expected to garner significant business opportunities for the vendors during the forecast period.

China, India, Japan, South Korea, Australia, Indonesia, US, Canada, Mexico, Germany, UK, France, Italy, Spain, The Netherlands, Saudi Arabia, UAE, South Africa, Israel, Turkey, Brazil, Argentina, Colombia

  • Escalation of 5G network deployments is the driving factor this market.

The Fiber Optic Test Equipment market vendors should focus on grabbing business opportunities from the Product segment as it accounted for the largest market share in the base year.