Submarine Cable Market Size 2025-2029
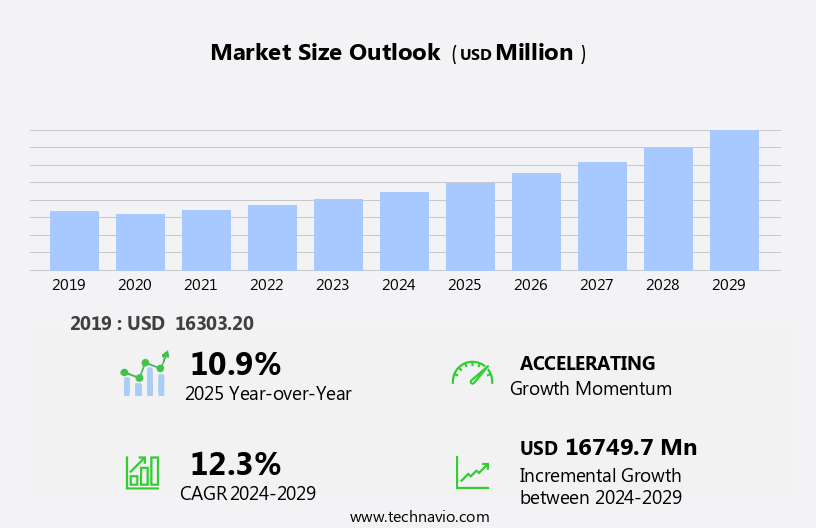
The submarine cable market size is forecast to increase by USD 16.75 billion at a CAGR of 12.3% between 2024 and 2029.
- The market is witnessing significant growth, driven by the expansion of cloud computing and data centers. Tech giants are investing in private submarine cable projects to ensure uninterrupted connectivity and reduce reliance on third-party providers. This trend is expected to continue as the demand for low-latency, high-bandwidth data transmission increases. However, the market faces challenges from security and cyber threats. Submarine cables are critical infrastructure, and their vulnerability to sabotage and cyber attacks poses a significant risk to data security.
- As the volume of data transmitted through these cables continues to grow, securing them against potential threats becomes increasingly important. Companies must invest in advanced security measures and collaborate with industry partners to mitigate risks and protect their valuable data assets.
What will be the Size of the Submarine Cable Market during the forecast period?

Request Free Sample
- The market continues to evolve, driven by the increasing demand for international connectivity and the digital transformation of various sectors. Subsea cables play a crucial role in data transmission, with ongoing advancements in fiber optic technology leading to higher capacity and faster transmission speeds. Cable installation and maintenance remain key activities, with cable trenching and cable protection essential for ensuring the longevity of these systems. Regulatory compliance and cable routing are also significant factors, with undersea cables traversing diverse environments and requiring careful planning and adherence to regulations. Industry consolidation and ownership changes continue to shape the market, with players investing in infrastructure and innovation to stay competitive.
- Submarine cable systems are increasingly being used for subsea power and deep-sea exploration, as well as for network resilience and data center connectivity. Technology innovation, such as repeater systems, cable integrity monitoring, and fault detection, are essential for maintaining network reliability and ensuring the long lifespan of these complex systems. The market is further influenced by the deployment of transpacific and transatlantic cables, as well as the integration of underwater connectors and cable landing stations. The ongoing unfolding of market activities and evolving patterns in the market reflect the dynamic nature of this essential communications infrastructure.
- Network capacity expansion and infrastructure investment are key trends, with the potential for subsea cables to contribute to big data and cloud computing, as well as to oceanographic research and subsea power. The market remains competitive, with ongoing innovation and regulatory compliance essential for success.
How is this Submarine Cable Industry segmented?
The submarine cable industry research report provides comprehensive data (region-wise segment analysis), with forecasts and estimates in "USD million" for the period 2025-2029, as well as historical data from 2019-2023 for the following segments.
- Type
- Power cable
- Communication cable
- Component
- Voltage
- Medium Voltage
- High Voltage
- Extra High Voltage
- End-User
- Telecom Operators
- Internet Service Providers
- Government
- Energy Sector
- Geography
- North America
- Europe
- France
- Germany
- Italy
- Spain
- UK
- Middle East and Africa
- APAC
- Australia
- China
- India
- Japan
- South Korea
- South America
- Rest of World (ROW)
By Type Insights
The power cable segment is estimated to witness significant growth during the forecast period. Submarine cable systems play a pivotal role in international connectivity by transmitting data and power between continents and regions. The demand for these underwater cables is driven by the increasing need for network resilience, data transmission, and digital transformation. Cable laying and installation are crucial processes in deploying submarine cable systems, with advanced fiber optic technology enabling high-capacity data transmission and long cable lifespans. Regulatory compliance and cable protection are essential considerations for cable ownership and industry consolidation. Deep-sea exploration and scientific data collection have expanded the applications of submarine cables, including seismic data transmission and oceanographic research. Subsea robotics and cable maintenance are vital for ensuring network reliability and cable integrity monitoring.
Cable burial and cable trenching are important for protecting cables from external damage. Transpacific and transatlantic cables are critical infrastructure investments for global communications, with capacity expansion a constant priority. Technology innovation, such as optical amplifiers and repeater systems, is essential for maintaining network performance and extending cable lifespan. Cable repair and cable landing stations are crucial for maintaining network connectivity and data center connectivity. Submarine power cables are increasingly important for integrating renewable energy sources, such as offshore wind farms, into power grids. These cables enable the transmission of electrical power from offshore platforms and wind farms to onshore grids, enhancing energy security and optimizing electricity distribution.
The growing investment in renewable energy projects, particularly in Europe, North America, and the Asia-Pacific region, is driving the demand for submarine power cables. Market competition is fierce, with various players focusing on cable deployment, capacity expansion, and network reliability. Big data and cloud computing are transforming the industry, with cable licensing and underwater connectors playing a crucial role in facilitating these developments. Network connectivity and infrastructure investment are essential for driving the growth of the market.

Request Free Sample
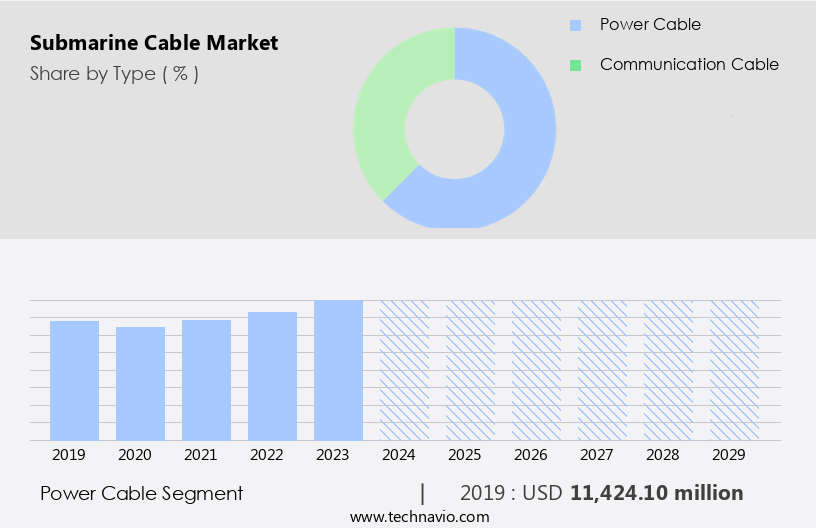
The Power cable segment was valued at USD 11.42 billion in 2019 and showed a gradual increase during the forecast period.
Regional Analysis
APAC is estimated to contribute 49% to the growth of the global market during the forecast period.Technavio's analysts have elaborately explained the regional trends and drivers that shape the market during the forecast period.

Request Free Sample
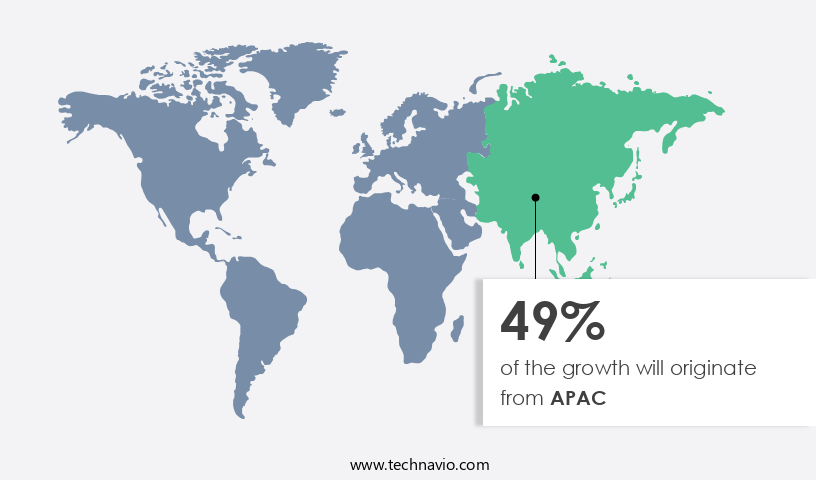
The market in the Asia-Pacific (APAC) region is experiencing significant growth due to the expanding digital economies, increasing adoption of cloud services, and rising internet penetration. Key players, including China, Japan, India, and South Korea, are driving this growth, fueled by escalating data traffic and substantial investments in undersea cable infrastructure. Hyperscale cloud providers and telecom operators in APAC are responding to the surge in demand for high-speed internet and data storage by investing heavily in new cable projects to meet both regional and international connectivity needs. In November 2022, a consortium led by Singtel and China Telecom Global Limited (CTG) secured a USD 300 million contract to construct the Asia Link Cable (ALC) system.
This project, along with others, underscores the commitment of industry players to enhance international connectivity and support the digital transfofrmation sweeping the region. Submarine cable systems, including transpacific and transatlantic cables, are being deployed to expand capacity and ensure network resilience. Deep-sea exploration, marine surveys, and cable trenching are crucial elements of cable installation, while cable protection, regulatory compliance, and cable maintenance are essential for ensuring cable longevity. Subsea robotics, repeater systems, and optical amplifiers play vital roles in cable functionality and performance. Additionally, subsea power cables are gaining traction for their ability to transmit electricity underwater, contributing to the growth of the market.
The market competition is intensifying, with players focusing on technology innovation, infrastructure investment, and capacity expansion to stay ahead. Cable ownership and industry consolidation are also shaping the market landscape. Despite the challenges, the market is poised for growth, with data transmission and network reliability remaining key priorities.
Market Dynamics
Our researchers analyzed the data with 2024 as the base year, along with the key drivers, trends, and challenges. A holistic analysis of drivers will help companies refine their marketing strategies to gain a competitive advantage.
The Global Submarine Cable Market expands with high-capacity submarine fiber cables and submarine cables for 5G connectivity. Submarine cable market trends 2025 emphasize undersea cables for cloud computing and submarine cables for data centers. Fiber optic cable for submarine and submarine cables for global internet ensure connectivity, per submarine cable market forecast. Subsea cables for renewable energy leverage smart submarine cable monitoring, while submarine cables for telecom networks enhance speed. Submarine cable cybersecurity solutions and undersea cables for IoT connectivity drive security. Submarine cables for digital infrastructure, high-speed submarine cable systems, and submarine cables for AI (artificial intelligence) networks support eco-friendly submarine cables. Submarine cable installation technologies, subsea cables for cross-border trade, submarine cables for smart cities, advanced submarine cable materials, and global submarine cable supply chain fuel growth through forecast year.
What are the key market drivers leading to the rise in the adoption of Submarine Cable Industry?
- The expansion of cloud computing and data centers is a primary factor fueling market growth, as businesses increasingly adopt cloud solutions to streamline operations and enhance data processing capabilities.
- The market is experiencing significant growth due to the increasing demand for data transmission and network reliability. With the ongoing digital transformation, cloud computing and data centers have become essential components of modern business infrastructure. Submarine cables play a crucial role in providing network connectivity and data center connectivity for these services, enabling organizations to store, process, and access data over the internet. Oceanographic research and subsea power cables are also contributing to the expansion of the market. Fault detection and cable repair technologies have improved network reliability, making submarine cables a preferred choice for long-distance data transmission.
- Cable landing stations are essential infrastructure components for cable maintenance and repair, ensuring minimal disruption to network connectivity. Capacity expansion is another factor driving the growth of the market. As businesses and consumers continue to generate and consume more data, the need for increased capacity is inevitable. Submarine cables offer a cost-effective and efficient solution for meeting this demand, making them an indispensable part of the communications infrastructure. In conclusion, The market is witnessing robust growth due to the increasing demand for data transmission, network reliability, and digital transformation. The expansion of cloud computing and data centers, as well as advancements in cable technology, are key factors fueling this growth.
- Submarine cables provide a reliable and cost-effective solution for meeting the growing need for high-performance computing resources and network connectivity.
What are the market trends shaping the Submarine Cable Industry?
- Tech giants are increasingly investing in private submarine cable projects, marking a significant trend in the telecommunications market. This undertaking reflects their commitment to enhancing global connectivity and data transfer capabilities.
- Submarine cables play a crucial role in international connectivity, with major tech companies like Google and Amazon investing heavily to meet their expanding data transmission needs. These investments focus on reducing reliance on third-party providers and ensuring secure, high-bandwidth, and low-latency connectivity for cloud services and data centers. In January 2025, Amazon filed an application with the Irish Maritime Area Regulatory Authority to deploy a subsea cable connecting Ireland and the US. The proposed cable would land in County Cork, with potential sites near Castlefreke, Rosscarbery, and Long Strand, before traversing the Celtic Sea and Atlantic Ocean to an undisclosed US East Coast location.
- Marine surveys are essential for cable laying and ensuring the integrity of these systems. Deep-sea exploration and advanced technologies like subsea power, subsea robotics, ocean bottom cables, repeater systems, and cable maintenance contribute to the success of these projects. Seismic data is also crucial for cable route planning and ensuring the safety of these underwater infrastructure projects. Fiber optic cables are the backbone of these systems, providing high-speed data transmission. In conclusion, the increasing demand for reliable and secure international connectivity is driving the growth of the market, with companies investing in advanced technologies and infrastructure to meet these needs.
What challenges does the Submarine Cable Industry face during its growth?
- The growth of the industry is significantly impacted by the pressing issue of security and cyber threats. These risks pose a substantial challenge that requires the attention and expertise of professionals to mitigate and safeguard against potential damages.
- The market plays a crucial role in facilitating international data traffic, carrying approximately 99% of all communications between continents. These undersea cables are essential for various sectors, including internet connectivity, financial transactions, and government communications. However, their significance also makes them attractive targets for hostile states and cybercriminals, posing significant security challenges. Recently, the UK Joint Committee on the National Security Strategy (JCNSS) launched an inquiry on January 28, 2025, to assess the vulnerabilities of undersea cables and evaluate the country's resilience against potential disruptions. This investigation aims to strengthen the UK's ability to defend critical subsea infrastructure, including shore-based connections.
- Submarine cables rely on advanced fiber optic technology for transmitting data. Cable installation involves cable trenching, regulatory compliance, and cable routing. Cable protection is another essential aspect, ensuring the cables' longevity against natural hazards and human activities. Industry consolidation and cable ownership have been key trends in the market. Regulatory compliance and cable regulation play a significant role in shaping the market dynamics. As the demand for high-speed data transmission continues to grow, the market is expected to witness further advancements in technology, including optical amplifiers and other innovative solutions.
Exclusive Customer Landscape
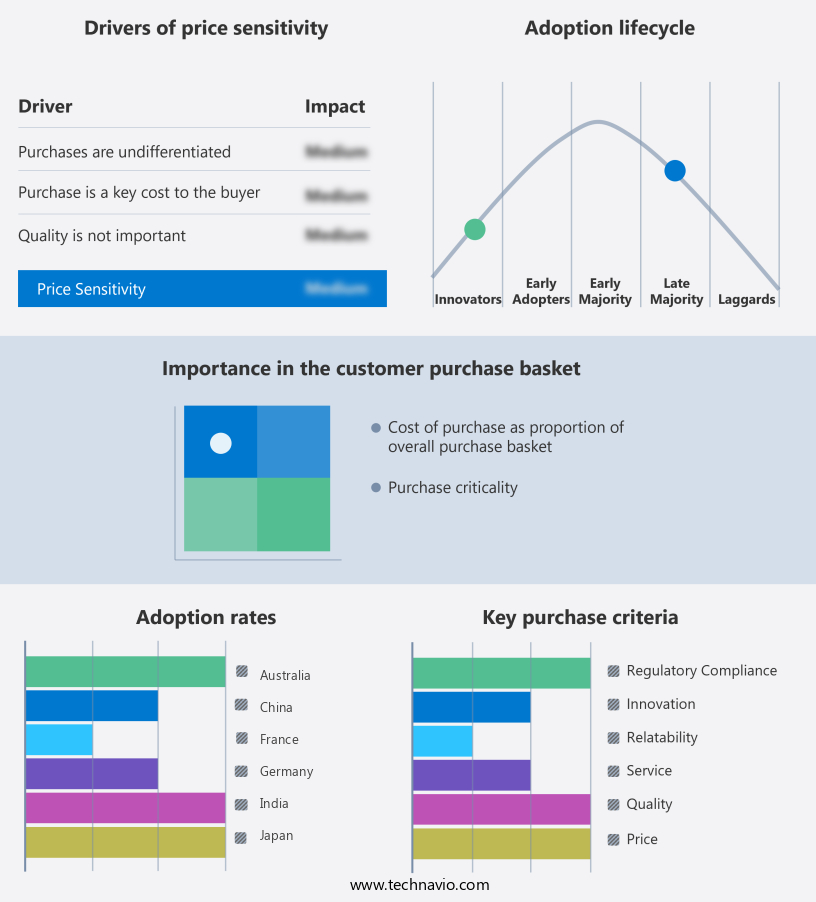
The submarine cable market forecasting report includes the adoption lifecycle of the market, covering from the innovator's stage to the laggard's stage. It focuses on adoption rates in different regions based on penetration. Furthermore, the submarine cable market report also includes key purchase criteria and drivers of price sensitivity to help companies evaluate and develop their market growth analysis strategies.

Customer Landscape
Key Companies & Market Insights
Companies are implementing various strategies, such as strategic alliances, submarine cable market forecast, partnerships, mergers and acquisitions, geographical expansion, and product/service launches, to enhance their presence in the industry.
The industry research and growth report includes detailed analyses of the competitive landscape of the market and information about key companies, including:
- SubCom
- NEC Corporation
- Alcatel Submarine Networks
- Prysmian Group
- Nexans
- Google
- Amazon
- Microsoft
- Facebook
- Huawei Marine
- Sumitomo Electric
- Ciena
- TE Connectivity
- Xtera Communications
- Global Marine
- Kokusal Cable Ship
- Orange Marine
- Hengtong Group
- Norddeutsche Seekabelwerke
- Cable & Wireless Communications
- ZTT
Qualitative and quantitative analysis of companies has been conducted to help clients understand the wider business environment as well as the strengths and weaknesses of key industry players. Data is qualitatively analyzed to categorize companies as pure play, category-focused, industry-focused, and diversified; it is quantitatively analyzed to categorize companies as dominant, leading, strong, tentative, and weak.
Recent Development and News in Submarine Cable Market
- In March 2023, TE SubCom, a leading submarine cable systems provider, announced the successful deployment of the INDEX Submarine Cable System, connecting Singapore and Jakarta with a record-breaking capacity of 60 Terabits per second (Tbps) . This technological advancement sets a new standard for high-speed international connectivity in the Asia-Pacific region.
- In July 2024, Nokia and Google formed a strategic partnership to develop and manufacture subsea fiber-optic cables for Google's undersea networks. This collaboration is expected to strengthen Nokia's position in the market and enhance Google's network infrastructure.
- In November 2024, the European Union approved the â¬1.3 billion (USD1.47 billion) Horizon Europe project, which includes the development and deployment of several new submarine cables to enhance Europe's digital infrastructure and reduce its dependence on third-party providers. This significant investment marks a key regulatory approval and policy change driving the growth of the European the market.
- In February 2025, Huawei Marine Networks and Angola Cables signed a Memorandum of Understanding (MoU) to collaborate on the development of the SACS-1 submarine cable system, connecting South America, Europe, and Africa . This strategic partnership represents an important geographic expansion for both companies and is expected to significantly improve connectivity between these continents.
Research Analyst Overview
The market encompasses various aspects of design, manufacturing, and maintenance to ensure optimal cable performance and network security. Cable termination plays a crucial role in ensuring reliable connections, while marine cable coating protects against external damage. Cable latency, a key performance metric, is continually improving to enhance communication efficiency. Cable fault localization and cable interoperability are essential for minimizing downtime and maintaining network reliability. Network security measures are increasingly integrated into cable systems to safeguard against cyber threats. Cable manufacturing and cable deployment timeframes are critical factors influencing market dynamics. Subsea cable lifespan is extended through cable protection measures, including burial depth optimization and route survey for hazard assessment.
The submarine cable market is growing rapidly, driven by rising demand from Internet of Things (IoT) and Content Delivery Networks (CDNs). Technologies like Wavelength Division Multiplexing (WDM) enhance data capacity, while Remotely Operated Vehicles (ROVs) and Autonomous Underwater Vehicles (AUVs) support deep-sea cable operations. Transpacific cables remain critical for connectivity. Cable material science advances contribute to improved cable bandwidth capacity and environmental impact assessment. Subsea cable testing and performance monitoring are ongoing processes to maintain cable integrity and ensure optimal network functionality. Cable route optimization and cable performance metrics are essential for minimizing cable cost and maximizing network efficiency. Environmental impact assessments are crucial for sustainable cable deployment and operation. Submarine cable cost is influenced by factors such as manufacturing, deployment, and maintenance expenses. Cable security measures, including cable coating and burial depth, are vital for safeguarding against potential threats. Cable integrity assessment is an ongoing process to ensure cable reliability and prevent cable faults. Subsea cable testing is crucial for verifying cable functionality and identifying potential issues before they cause network disruptions.
Dive into Technavio's robust research methodology, blending expert interviews, extensive data synthesis, and validated models for unparalleled Submarine Cable Market insights. See full methodology.
Market Scope
|
Report Coverage
|
Details
|
Page number
|
203
|
Base year
|
2024
|
Historic period
|
2019-2023 |
Forecast period
|
2025-2029
|
Growth momentum & CAGR
|
Accelerate at a CAGR of 12.3%
|
Market growth 2025-2029
|
USD 16749.7 million
|
Market structure
|
Fragmented
|
YoY growth 2024-2025(%)
|
10.9
|
Key countries
|
US, China, Germany, Japan, UK, Australia, India, France, Brazil, UAE, Rest of World (ROW), Saudi Arabia, France, South Korea, Mexico, Italy, and Spain
|
Competitive landscape
|
Leading Companies, Market Positioning of Companies, Competitive Strategies, and Industry Risks
|
Request Free Sample
What are the Key Data Covered in this Submarine Cable Market Research and Growth Report?
- CAGR of the Submarine Cable industry during the forecast period
- Detailed information on factors that will drive the growth and forecasting between 2025 and 2029
- Precise estimation of the size of the market and its contribution of the industry in focus to the parent market
- Accurate predictions about upcoming growth and trends and changes in consumer behaviour
- Growth of the market across APAC, Europe, North America, Middle East and Africa, and South America
- Thorough analysis of the market's competitive landscape and detailed information about companies
- Comprehensive analysis of factors that will challenge the submarine cable market growth of industry companies
We can help! Our analysts can customize this submarine cable market research report to meet your requirements.
Get in touch
1 Executive Summary
- 1.1 Market overview
- Executive Summary - Chart on Market Overview
- Executive Summary - Data Table on Market Overview
- Executive Summary - Chart on Global Market Characteristics
- Executive Summary - Chart on Market by Geography
- Executive Summary - Chart on Market Segmentation by Type
- Executive Summary - Chart on Market Segmentation by Component
- Executive Summary - Chart on Incremental Growth
- Executive Summary - Data Table on Incremental Growth
- Executive Summary - Chart on Company Market Positioning
2 Technavio Analysis
- 2.1 Analysis of price sensitivity, lifecycle, customer purchase basket, adoption rates, and purchase criteria
- Analysis of price sensitivity, lifecycle, customer purchase basket, adoption rates, and purchase criteria
- 2.2 Criticality of inputs and Factors of differentiation
- Overview on criticality of inputs and factors of differentiation
- 2.3 Factors of disruption
- Overview on factors of disruption
- 2.4 Impact of drivers and challenges
- Impact of drivers and challenges in 2024 and 2029
3 Market Landscape
- 3.1 Market ecosystem
- Parent Market
- Data Table on - Parent Market
- 3.2 Market characteristics
- Market characteristics analysis
4 Market Sizing
- 4.1 Market definition
- Offerings of companies included in the market definition
- 4.2 Market segment analysis
- 4.4 Market outlook: Forecast for 2024-2029
- Chart on Global - Market size and forecast 2024-2029 ($ million)
- Data Table on Global - Market size and forecast 2024-2029 ($ million)
- Chart on Global Market: Year-over-year growth 2024-2029 (%)
- Data Table on Global Market: Year-over-year growth 2024-2029 (%)
5 Historic Market Size
- 5.1 Global Submarine Cable Market 2019 - 2023
- Historic Market Size - Data Table on Global Submarine Cable Market 2019 - 2023 ($ million)
- 5.2 Type segment analysis 2019 - 2023
- Historic Market Size - Type Segment 2019 - 2023 ($ million)
- 5.3 Component segment analysis 2019 - 2023
- Historic Market Size - Component Segment 2019 - 2023 ($ million)
- 5.4 Geography segment analysis 2019 - 2023
- Historic Market Size - Geography Segment 2019 - 2023 ($ million)
- 5.5 Country segment analysis 2019 - 2023
- Historic Market Size - Country Segment 2019 - 2023 ($ million)
6 Qualitative Analysis
- 6.1 Impact of AI on Global Submarine Cable Market
7 Five Forces Analysis
- 7.1 Five forces summary
- Five forces analysis - Comparison between 2024 and 2029
- 7.2 Bargaining power of buyers
- Bargaining power of buyers - Impact of key factors 2024 and 2029
- 7.3 Bargaining power of suppliers
- Bargaining power of suppliers - Impact of key factors in 2024 and 2029
- 7.4 Threat of new entrants
- Threat of new entrants - Impact of key factors in 2024 and 2029
- 7.5 Threat of substitutes
- Threat of substitutes - Impact of key factors in 2024 and 2029
- 7.6 Threat of rivalry
- Threat of rivalry - Impact of key factors in 2024 and 2029
- 7.7 Market condition
- Chart on Market condition - Five forces 2024 and 2029
8 Market Segmentation by Type
- 8.1 Market segments
- Chart on Type - Market share (2024-2029) (%)
- Data Table on Type - Market share (2024-2029) (%)
- 8.2 Comparison by Type
- Chart on Comparison by Type
- Data Table on Comparison by Type
- 8.3 Power cable - Market size and forecast (2024-2029)
- Chart on Power cable - Market size and forecast (2024-2029) ($ million)
- Data Table on Power cable - Market size and forecast (2024-2029) ($ million)
- Chart on Power cable - Year-over-year growth (2024-2029) (%)
- Data Table on Power cable - Year-over-year growth (2024-2029) (%)
- 8.4 Communication cable - Market size and forecast (2024-2029)
- Chart on Communication cable - Market size and forecast (2024-2029) ($ million)
- Data Table on Communication cable - Market size and forecast (2024-2029) ($ million)
- Chart on Communication cable - Year-over-year growth (2024-2029) (%)
- Data Table on Communication cable - Year-over-year growth (2024-2029) (%)
- 8.5 Market opportunity by Type
- Market opportunity by Type ($ million)
- Data Table on Market opportunity by Type ($ million)
9 Market Segmentation by Component
- 9.1 Market segments
- Chart on Component - Market share (2024-2029) (%)
- Data Table on Component - Market share (2024-2029) (%)
- 9.2 Comparison by Component
- Chart on Comparison by Component
- Data Table on Comparison by Component
- 9.3 Dry plant - Market size and forecast (2024-2029)
- Chart on Dry plant - Market size and forecast (2024-2029) ($ million)
- Data Table on Dry plant - Market size and forecast (2024-2029) ($ million)
- Chart on Dry plant - Year-over-year growth (2024-2029) (%)
- Data Table on Dry plant - Year-over-year growth (2024-2029) (%)
- 9.4 Wet plant - Market size and forecast (2024-2029)
- Chart on Wet plant - Market size and forecast (2024-2029) ($ million)
- Data Table on Wet plant - Market size and forecast (2024-2029) ($ million)
- Chart on Wet plant - Year-over-year growth (2024-2029) (%)
- Data Table on Wet plant - Year-over-year growth (2024-2029) (%)
- 9.5 Market opportunity by Component
- Market opportunity by Component ($ million)
- Data Table on Market opportunity by Component ($ million)
10 Market Segmentation by Voltage
- 10.1 Market segments
- Chart on Voltage - Market share (2024-2029) (%)
- Data Table on Voltage - Market share (2024-2029) (%)
- 10.2 Comparison by Voltage
- Chart on Comparison by Voltage
- Data Table on Comparison by Voltage
- 10.3 Medium Voltage - Market size and forecast (2024-2029)
- Chart on Medium Voltage - Market size and forecast (2024-2029) ($ million)
- Data Table on Medium Voltage - Market size and forecast (2024-2029) ($ million)
- Chart on Medium Voltage - Year-over-year growth (2024-2029) (%)
- Data Table on Medium Voltage - Year-over-year growth (2024-2029) (%)
- 10.4 High Voltage - Market size and forecast (2024-2029)
- Chart on High Voltage - Market size and forecast (2024-2029) ($ million)
- Data Table on High Voltage - Market size and forecast (2024-2029) ($ million)
- Chart on High Voltage - Year-over-year growth (2024-2029) (%)
- Data Table on High Voltage - Year-over-year growth (2024-2029) (%)
- 10.5 Extra High Voltage - Market size and forecast (2024-2029)
- Chart on Extra High Voltage - Market size and forecast (2024-2029) ($ million)
- Data Table on Extra High Voltage - Market size and forecast (2024-2029) ($ million)
- Chart on Extra High Voltage - Year-over-year growth (2024-2029) (%)
- Data Table on Extra High Voltage - Year-over-year growth (2024-2029) (%)
- 10.6 Market opportunity by Voltage
- Market opportunity by Voltage ($ million)
- Data Table on Market opportunity by Voltage ($ million)
11 Market Segmentation by End-User
- 11.1 Market segments
- Chart on End-User - Market share (2024-2029) (%)
- Data Table on End-User - Market share (2024-2029) (%)
- 11.2 Comparison by End-User
- Chart on Comparison by End-User
- Data Table on Comparison by End-User
- 11.3 Telecom Operators - Market size and forecast (2024-2029)
- Chart on Telecom Operators - Market size and forecast (2024-2029) ($ million)
- Data Table on Telecom Operators - Market size and forecast (2024-2029) ($ million)
- Chart on Telecom Operators - Year-over-year growth (2024-2029) (%)
- Data Table on Telecom Operators - Year-over-year growth (2024-2029) (%)
- 11.4 Internet Service Providers - Market size and forecast (2024-2029)
- Chart on Internet Service Providers - Market size and forecast (2024-2029) ($ million)
- Data Table on Internet Service Providers - Market size and forecast (2024-2029) ($ million)
- Chart on Internet Service Providers - Year-over-year growth (2024-2029) (%)
- Data Table on Internet Service Providers - Year-over-year growth (2024-2029) (%)
- 11.5 Government - Market size and forecast (2024-2029)
- Chart on Government - Market size and forecast (2024-2029) ($ million)
- Data Table on Government - Market size and forecast (2024-2029) ($ million)
- Chart on Government - Year-over-year growth (2024-2029) (%)
- Data Table on Government - Year-over-year growth (2024-2029) (%)
- 11.6 Energy Sector - Market size and forecast (2024-2029)
- Chart on Energy Sector - Market size and forecast (2024-2029) ($ million)
- Data Table on Energy Sector - Market size and forecast (2024-2029) ($ million)
- Chart on Energy Sector - Year-over-year growth (2024-2029) (%)
- Data Table on Energy Sector - Year-over-year growth (2024-2029) (%)
- 11.7 Market opportunity by End-User
- Market opportunity by End-User ($ million)
- Data Table on Market opportunity by End-User ($ million)
12 Customer Landscape
- 12.1 Customer landscape overview
- Analysis of price sensitivity, lifecycle, customer purchase basket, adoption rates, and purchase criteria
13 Geographic Landscape
- 13.1 Geographic segmentation
- Chart on Market share by geography 2024-2029 (%)
- Data Table on Market share by geography 2024-2029 (%)
- 13.2 Geographic comparison
- Chart on Geographic comparison
- Data Table on Geographic comparison
- 13.3 APAC - Market size and forecast 2024-2029
- Chart on APAC - Market size and forecast 2024-2029 ($ million)
- Data Table on APAC - Market size and forecast 2024-2029 ($ million)
- Chart on APAC - Year-over-year growth 2024-2029 (%)
- Data Table on APAC - Year-over-year growth 2024-2029 (%)
- 13.4 Europe - Market size and forecast 2024-2029
- Chart on Europe - Market size and forecast 2024-2029 ($ million)
- Data Table on Europe - Market size and forecast 2024-2029 ($ million)
- Chart on Europe - Year-over-year growth 2024-2029 (%)
- Data Table on Europe - Year-over-year growth 2024-2029 (%)
- 13.5 North America - Market size and forecast 2024-2029
- Chart on North America - Market size and forecast 2024-2029 ($ million)
- Data Table on North America - Market size and forecast 2024-2029 ($ million)
- Chart on North America - Year-over-year growth 2024-2029 (%)
- Data Table on North America - Year-over-year growth 2024-2029 (%)
- 13.6 Middle East and Africa - Market size and forecast 2024-2029
- Chart on Middle East and Africa - Market size and forecast 2024-2029 ($ million)
- Data Table on Middle East and Africa - Market size and forecast 2024-2029 ($ million)
- Chart on Middle East and Africa - Year-over-year growth 2024-2029 (%)
- Data Table on Middle East and Africa - Year-over-year growth 2024-2029 (%)
- 13.7 South America - Market size and forecast 2024-2029
- Chart on South America - Market size and forecast 2024-2029 ($ million)
- Data Table on South America - Market size and forecast 2024-2029 ($ million)
- Chart on South America - Year-over-year growth 2024-2029 (%)
- Data Table on South America - Year-over-year growth 2024-2029 (%)
- 13.8 US - Market size and forecast 2024-2029
- Chart on US - Market size and forecast 2024-2029 ($ million)
- Data Table on US - Market size and forecast 2024-2029 ($ million)
- Chart on US - Year-over-year growth 2024-2029 (%)
- Data Table on US - Year-over-year growth 2024-2029 (%)
- 13.9 China - Market size and forecast 2024-2029
- Chart on China - Market size and forecast 2024-2029 ($ million)
- Data Table on China - Market size and forecast 2024-2029 ($ million)
- Chart on China - Year-over-year growth 2024-2029 (%)
- Data Table on China - Year-over-year growth 2024-2029 (%)
- 13.10 Japan - Market size and forecast 2024-2029
- Chart on Japan - Market size and forecast 2024-2029 ($ million)
- Data Table on Japan - Market size and forecast 2024-2029 ($ million)
- Chart on Japan - Year-over-year growth 2024-2029 (%)
- Data Table on Japan - Year-over-year growth 2024-2029 (%)
- 13.11 India - Market size and forecast 2024-2029
- Chart on India - Market size and forecast 2024-2029 ($ million)
- Data Table on India - Market size and forecast 2024-2029 ($ million)
- Chart on India - Year-over-year growth 2024-2029 (%)
- Data Table on India - Year-over-year growth 2024-2029 (%)
- 13.12 Australia - Market size and forecast 2024-2029
- Chart on Australia - Market size and forecast 2024-2029 ($ million)
- Data Table on Australia - Market size and forecast 2024-2029 ($ million)
- Chart on Australia - Year-over-year growth 2024-2029 (%)
- Data Table on Australia - Year-over-year growth 2024-2029 (%)
- 13.13 UK - Market size and forecast 2024-2029
- Chart on UK - Market size and forecast 2024-2029 ($ million)
- Data Table on UK - Market size and forecast 2024-2029 ($ million)
- Chart on UK - Year-over-year growth 2024-2029 (%)
- Data Table on UK - Year-over-year growth 2024-2029 (%)
- 13.14 France - Market size and forecast 2024-2029
- Chart on France - Market size and forecast 2024-2029 ($ million)
- Data Table on France - Market size and forecast 2024-2029 ($ million)
- Chart on France - Year-over-year growth 2024-2029 (%)
- Data Table on France - Year-over-year growth 2024-2029 (%)
- 13.15 Singapore - Market size and forecast 2024-2029
- Chart on Singapore - Market size and forecast 2024-2029 ($ million)
- Data Table on Singapore - Market size and forecast 2024-2029 ($ million)
- Chart on Singapore - Year-over-year growth 2024-2029 (%)
- Data Table on Singapore - Year-over-year growth 2024-2029 (%)
- 13.16 Germany - Market size and forecast 2024-2029
- Chart on Germany - Market size and forecast 2024-2029 ($ million)
- Data Table on Germany - Market size and forecast 2024-2029 ($ million)
- Chart on Germany - Year-over-year growth 2024-2029 (%)
- Data Table on Germany - Year-over-year growth 2024-2029 (%)
- 13.17 South Korea - Market size and forecast 2024-2029
- Chart on South Korea - Market size and forecast 2024-2029 ($ million)
- Data Table on South Korea - Market size and forecast 2024-2029 ($ million)
- Chart on South Korea - Year-over-year growth 2024-2029 (%)
- Data Table on South Korea - Year-over-year growth 2024-2029 (%)
- 13.18 Market opportunity by geography
- Market opportunity by geography ($ million)
- Data Tables on Market opportunity by geography ($ million)
- 13.19 US - Market size and forecast (2024-2029)
- Chart on US - Market size and forecast (2024-2029) ($ million)
- Data Table on US - Market size and forecast (2024-2029) ($ million)
- Chart on US - Year-over-year growth (2024-2029) (%)
- Data Table on US - Year-over-year growth (2024-2029) (%)
- 13.20 Brazil - Market size and forecast (2024-2029)
- Chart on Brazil - Market size and forecast (2024-2029) ($ million)
- Data Table on Brazil - Market size and forecast (2024-2029) ($ million)
- Chart on Brazil - Year-over-year growth (2024-2029) (%)
- Data Table on Brazil - Year-over-year growth (2024-2029) (%)
- 13.21 UAE - Market size and forecast (2024-2029)
- Chart on UAE - Market size and forecast (2024-2029) ($ million)
- Data Table on UAE - Market size and forecast (2024-2029) ($ million)
- Chart on UAE - Year-over-year growth (2024-2029) (%)
- Data Table on UAE - Year-over-year growth (2024-2029) (%)
- 13.22 Rest of World (ROW) - Market size and forecast (2024-2029)
- Chart on Rest of World (ROW) - Market size and forecast (2024-2029) ($ million)
- Data Table on Rest of World (ROW) - Market size and forecast (2024-2029) ($ million)
- Chart on Rest of World (ROW) - Year-over-year growth (2024-2029) (%)
- Data Table on Rest of World (ROW) - Year-over-year growth (2024-2029) (%)
- 13.23 Saudi Arabia - Market size and forecast (2024-2029)
- Chart on Saudi Arabia - Market size and forecast (2024-2029) ($ million)
- Data Table on Saudi Arabia - Market size and forecast (2024-2029) ($ million)
- Chart on Saudi Arabia - Year-over-year growth (2024-2029) (%)
- Data Table on Saudi Arabia - Year-over-year growth (2024-2029) (%)
- 13.24 Mexico - Market size and forecast (2024-2029)
- Chart on Mexico - Market size and forecast (2024-2029) ($ million)
- Data Table on Mexico - Market size and forecast (2024-2029) ($ million)
- Chart on Mexico - Year-over-year growth (2024-2029) (%)
- Data Table on Mexico - Year-over-year growth (2024-2029) (%)
- 13.25 Italy - Market size and forecast (2024-2029)
- Chart on Italy - Market size and forecast (2024-2029) ($ million)
- Data Table on Italy - Market size and forecast (2024-2029) ($ million)
- Chart on Italy - Year-over-year growth (2024-2029) (%)
- Data Table on Italy - Year-over-year growth (2024-2029) (%)
- 13.26 Spain - Market size and forecast (2024-2029)
- Chart on Spain - Market size and forecast (2024-2029) ($ million)
- Data Table on Spain - Market size and forecast (2024-2029) ($ million)
- Chart on Spain - Year-over-year growth (2024-2029) (%)
- Data Table on Spain - Year-over-year growth (2024-2029) (%)
14 Drivers, Challenges, and Opportunity/Restraints
- 14.3 Impact of drivers and challenges
- Impact of drivers and challenges in 2024 and 2029
- 14.4 Market opportunities/restraints
15 Competitive Landscape
- 15.2 Competitive Landscape
- Overview on criticality of inputs and factors of differentiation
- 15.3 Landscape disruption
- Overview on factors of disruption
- 15.4 Industry risks
- Impact of key risks on business
16 Competitive Analysis
- 16.2 Market positioning of companies
- Matrix on companies position and classification
- 16.3 SubCom
- SubCom - Overview
- SubCom - Product / Service
- SubCom - Key offerings
- 16.4 NEC Corporation
- NEC Corporation - Overview
- NEC Corporation - Product / Service
- NEC Corporation - Key offerings
- 16.5 Alcatel Submarine Networks
- Alcatel Submarine Networks - Overview
- Alcatel Submarine Networks - Product / Service
- Alcatel Submarine Networks - Key offerings
- 16.6 Prysmian Group
- Prysmian Group - Overview
- Prysmian Group - Product / Service
- Prysmian Group - Key offerings
- 16.7 Nexans
- Nexans - Overview
- Nexans - Product / Service
- Nexans - Key offerings
- 16.8 Google
- Google - Overview
- Google - Product / Service
- Google - Key offerings
- 16.9 Amazon
- Amazon - Overview
- Amazon - Product / Service
- Amazon - Key offerings
- 16.10 Microsoft
- Microsoft - Overview
- Microsoft - Product / Service
- Microsoft - Key offerings
- 16.11 Facebook
- Facebook - Overview
- Facebook - Product / Service
- Facebook - Key offerings
- 16.12 Huawei Marine
- Huawei Marine - Overview
- Huawei Marine - Product / Service
- Huawei Marine - Key offerings
- 16.13 Sumitomo Electric
- Sumitomo Electric - Overview
- Sumitomo Electric - Product / Service
- Sumitomo Electric - Key offerings
- 16.14 Ciena
- Ciena - Overview
- Ciena - Product / Service
- Ciena - Key offerings
- 16.15 TE Connectivity
- TE Connectivity - Overview
- TE Connectivity - Product / Service
- TE Connectivity - Key offerings
- 16.16 Xtera Communications
- Xtera Communications - Overview
- Xtera Communications - Product / Service
- Xtera Communications - Key offerings
- 16.17 Global Marine
- Global Marine - Overview
- Global Marine - Product / Service
- Global Marine - Key offerings
- 16.18 Kokusal Cable Ship
- Kokusal Cable Ship - Overview
- Kokusal Cable Ship - Product / Service
- Kokusal Cable Ship - Key offerings
- 16.19 Orange Marine
- Orange Marine - Overview
- Orange Marine - Product / Service
- Orange Marine - Key offerings
- 16.20 Hengtong Group
- Hengtong Group - Overview
- Hengtong Group - Product / Service
- Hengtong Group - Key offerings
- 16.21 Norddeutsche Seekabelwerke
- Norddeutsche Seekabelwerke - Overview
- Norddeutsche Seekabelwerke - Product / Service
- Norddeutsche Seekabelwerke - Key offerings
- 16.22 Cable & Wireless Communications
- Cable & Wireless Communications - Overview
- Cable & Wireless Communications - Product / Service
- Cable & Wireless Communications - Key offerings
- 16.23 ZTT
- ZTT - Overview
- ZTT - Product / Service
- ZTT - Key offerings
- 16.24 AFL
- AFL - Overview
- AFL - Product / Service
- AFL - Key offerings
- 16.25 Alcatel Submarine Networks
- Alcatel Submarine Networks - Overview
- Alcatel Submarine Networks - Product / Service
- Alcatel Submarine Networks - Key offerings
- 16.26 Apar Industries Ltd.
- Apar Industries Ltd. - Overview
- Apar Industries Ltd. - Product / Service
- Apar Industries Ltd. - Key offerings
- 16.27 Corning Inc.
- Corning Inc. - Overview
- Corning Inc. - Product / Service
- Corning Inc. - Key offerings
- 16.28 Furukawa Electric Co. Ltd.
- Furukawa Electric Co. Ltd. - Overview
- Furukawa Electric Co. Ltd. - Product / Service
- Furukawa Electric Co. Ltd. - Key offerings
- 16.29 Hengtong Group Co. Ltd.
- Hengtong Group Co. Ltd. - Overview
- Hengtong Group Co. Ltd. - Product / Service
- Hengtong Group Co. Ltd. - Key offerings
- 16.30 Hexatronic Group AB
- Hexatronic Group AB - Overview
- Hexatronic Group AB - Product / Service
- Hexatronic Group AB - Key offerings
- 16.31 Jiangsu Zhongtian Technology Co. Ltd.
- Jiangsu Zhongtian Technology Co. Ltd. - Overview
- Jiangsu Zhongtian Technology Co. Ltd. - Product / Service
- Jiangsu Zhongtian Technology Co. Ltd. - Key offerings
- 16.32 LS Cable and System Ltd.
- LS Cable and System Ltd. - Overview
- LS Cable and System Ltd. - Product / Service
- LS Cable and System Ltd. - Key offerings
- 16.33 NEC Corp.
- NEC Corp. - Overview
- NEC Corp. - Product / Service
- NEC Corp. - Key offerings
- 16.34 Nexans SA
- Nexans SA - Overview
- Nexans SA - Product / Service
- Nexans SA - Key offerings
- 16.35 Ningbo Orient Wires and Cables Co. Ltd.
- Ningbo Orient Wires and Cables Co. Ltd. - Overview
- Ningbo Orient Wires and Cables Co. Ltd. - Product / Service
- Ningbo Orient Wires and Cables Co. Ltd. - Key offerings
- 16.36 NKT AS
- NKT AS - Overview
- NKT AS - Product / Service
- NKT AS - Key offerings
- 16.37 Prysmian S.p.A
- Prysmian S.p.A - Overview
- Prysmian S.p.A - Product / Service
- Prysmian S.p.A - Key offerings
- 16.38 SSG cable group
- SSG cable group - Overview
- SSG cable group - Product / Service
- SSG cable group - Key offerings
- 16.39 SubCom LLC
- SubCom LLC - Overview
- SubCom LLC - Product / Service
- SubCom LLC - Key offerings
- 16.40 Sumitomo Electric Industries Ltd.
- Sumitomo Electric Industries Ltd. - Overview
- Sumitomo Electric Industries Ltd. - Product / Service
- Sumitomo Electric Industries Ltd. - Key offerings
- 16.41 Taihan Cable and Solution Co. Ltd.
- Taihan Cable and Solution Co. Ltd. - Overview
- Taihan Cable and Solution Co. Ltd. - Product / Service
- Taihan Cable and Solution Co. Ltd. - Key offerings
- 16.42 Tratos Cavi S.p.A.
- Tratos Cavi S.p.A. - Overview
- Tratos Cavi S.p.A. - Product / Service
- Tratos Cavi S.p.A. - Key offerings
17 Appendix
- 17.2 Inclusions and exclusions checklist
- Inclusions checklist
- Exclusions checklist
- 17.3 Currency conversion rates for US$
- Currency conversion rates for US$
- 17.4 Research methodology
- 17.7 Validation techniques employed for market sizing
- Validation techniques employed for market sizing
- 17.9 360 degree market analysis
- 360 degree market analysis
- 17.10 List of abbreviations