Flare Blowers Market Analysis, Size, and Forecast 2026-2030: North America (US, Canada, and Mexico), APAC (China, India, and Australia), Europe (Germany, UK, and The Netherlands), Middle East and Africa (Saudi Arabia and UAE), South America (Brazil and Argentina), and Rest of World (ROW)

Flare Blowers Market Analysis, Size, and Forecast 2026-2030:
North America (US, Canada, and Mexico), APAC (China, India, and Australia), Europe (Germany, UK, and The Netherlands), Middle East and Africa (Saudi Arabia and UAE), South America (Brazil and Argentina), and Rest of World (ROW)

Published: May 2026 307 Pages SKU: IRTNTR81483

Market Overview at a Glance

$95.5 Mn
Market Opportunity
5.8%
CAGR 2025 - 2030
34.1%
APAC Growth
$94.7 Mn
Centrifugal blowers segment 2024

Flare Blowers Market Size 2026-2030

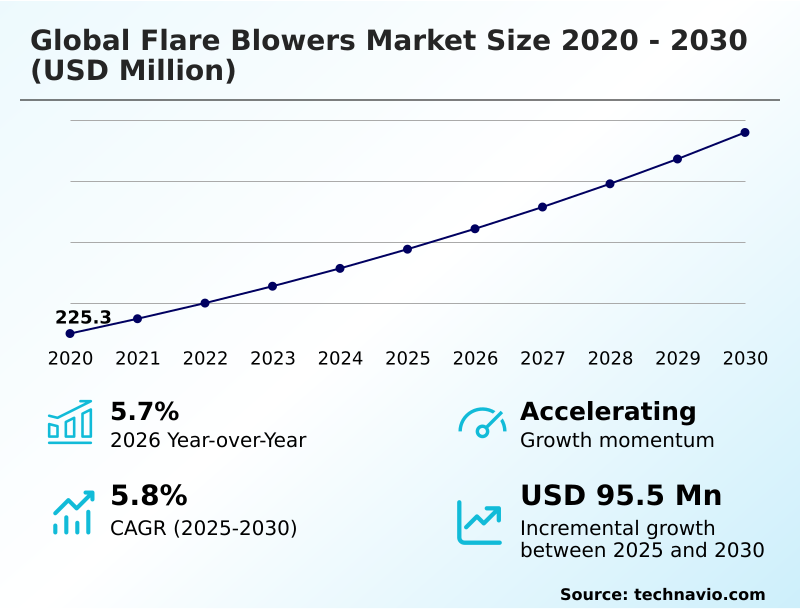
The flare blowers market size is valued to increase by USD 95.5 million, at a CAGR of 5.8% from 2025 to 2030. Stringency in environmental mandates and global emission standards will drive the flare blowers market.

Major Market Trends & Insights

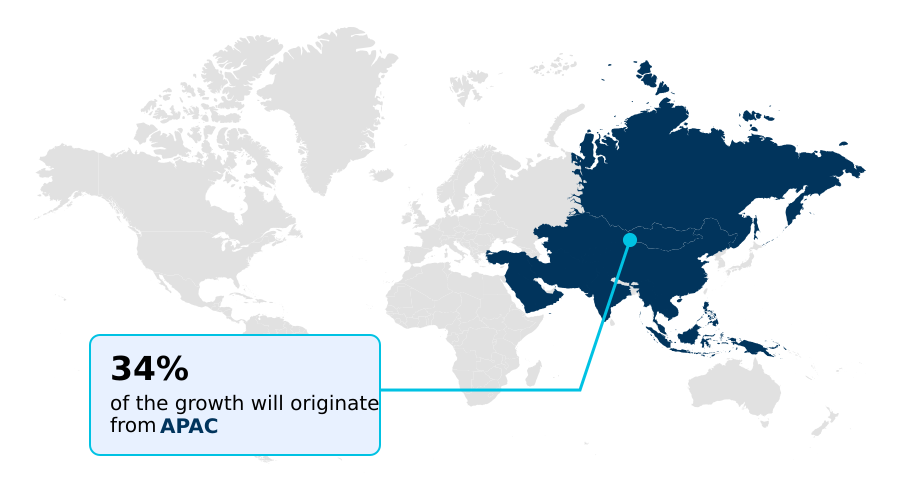
  • APAC dominated the market and accounted for a 34.1% growth during the forecast period.
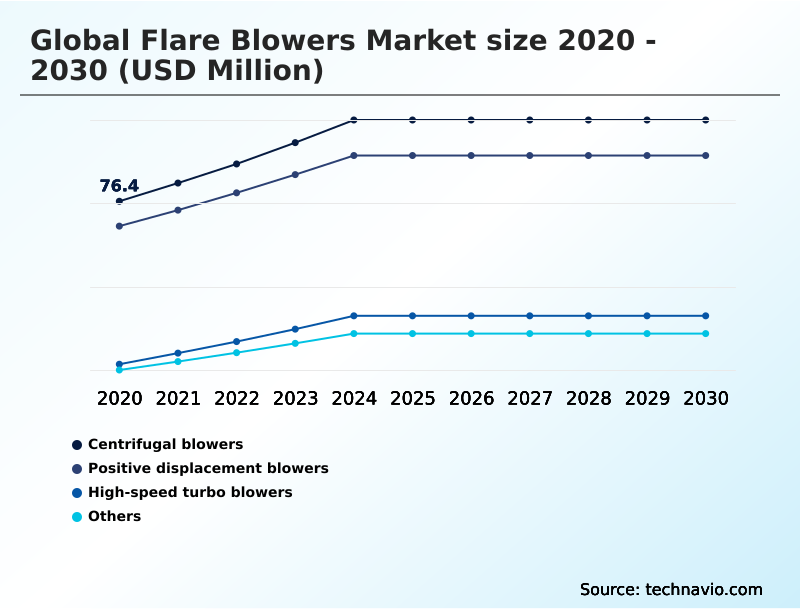
  • By Type - Centrifugal blowers segment was valued at USD 94.7 million in 2024
  • By Application - Flare gas recovery segment accounted for the largest market revenue share in 2024

Market Size & Forecast

  • Market Opportunities: USD 164.5 million
  • Market Future Opportunities: USD 95.5 million
  • CAGR from 2025 to 2030 : 5.8%

Market Summary

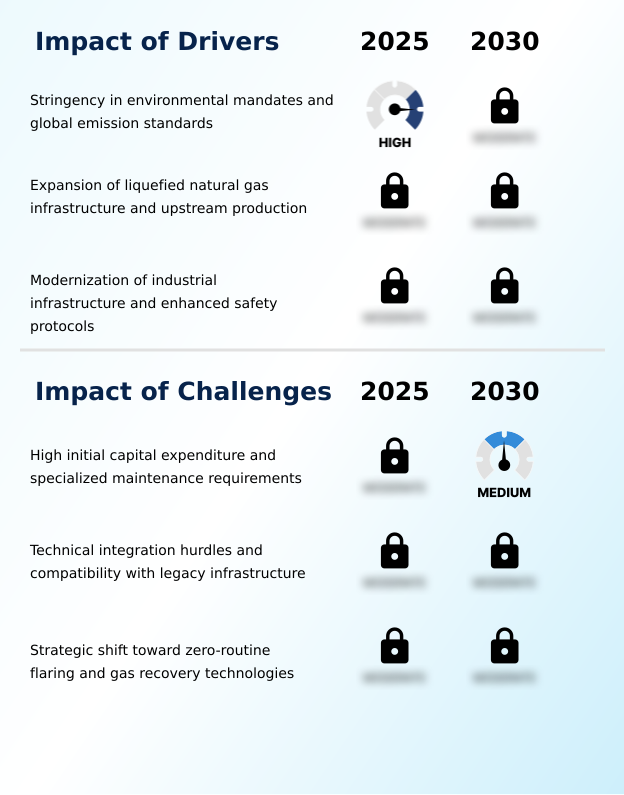
  • The Flare Blowers Market is driven by the critical need for smokeless combustion and high destruction removal efficiency in industrial settings. As environmental regulations tighten, operators are compelled to upgrade legacy systems to advanced air-assist smokeless flaring configurations that rely on high-performance blowers.
  • These systems, incorporating technologies like variable frequency drives and predictive diagnostics, are essential for minimizing the release of volatile organic compounds and reducing an operation's carbon footprint. The expansion of liquefied natural gas infrastructure and upstream production further fuels demand, especially for modular blower assemblies that can be rapidly deployed.
  • For example, an operator expanding a midstream processing facility must choose between different blower types—such as centrifugal blowers or positive displacement blowers—based on gas composition and flow rate to ensure compliance with emission standards from day one. However, the high capital expenditure for these engineered-to-order systems and the technical challenges of legacy infrastructure integration remain significant hurdles.
  • The industry also faces a long-term strategic shift toward gas recovery technologies and zero-routine flaring, which could reshape future demand for combustion-centric solutions.

What will be the Size of the Flare Blowers Market during the forecast period?

Get Key Insights on Market Forecast (PDF) Get Free Sample

How is the Flare Blowers Market Segmented?

The flare blowers industry research report provides comprehensive data (region-wise segment analysis), with forecasts and estimates in "USD million" for the period 2026-2030, as well as historical data from 2020-2024 for the following segments.

  • Type
    • Centrifugal blowers
    • Positive displacement blowers
    • High-speed turbo blowers
    • Others
  • Application
    • Flare gas recovery
    • Air-assist smokeless flaring
    • Gas boosting
    • Others
  • Capacity
    • Medium
    • Large
    • Small
  • Geography
    • North America
      • US
      • Canada
      • Mexico
    • APAC
      • China
      • India
      • Australia
    • Europe
      • Germany
      • UK
      • The Netherlands
    • Middle East and Africa
      • Saudi Arabia
      • UAE
    • South America
      • Brazil
      • Argentina
    • Rest of World (ROW)

By Type Insights

The centrifugal blowers segment is estimated to witness significant growth during the forecast period.

Centrifugal blowers maintain a dominant role due to their ability to handle high-volume air displacement, essential for flare gas recovery and achieving smokeless combustion.

This segment is evolving with the integration of variable frequency drives, which can reduce energy use by up to 37% compared to older technologies. Innovations like radial blade design and air-foil bearings improve aerodynamic efficiency.

While positive displacement blowers serve constant volume needs, specialized units like liquid ring blowers are critical for wet gas streams, common in biogas flaring and anaerobic digestion processes, where managing moisture and ensuring thermal radiation reduction are key operational goals.

Get Free Sample

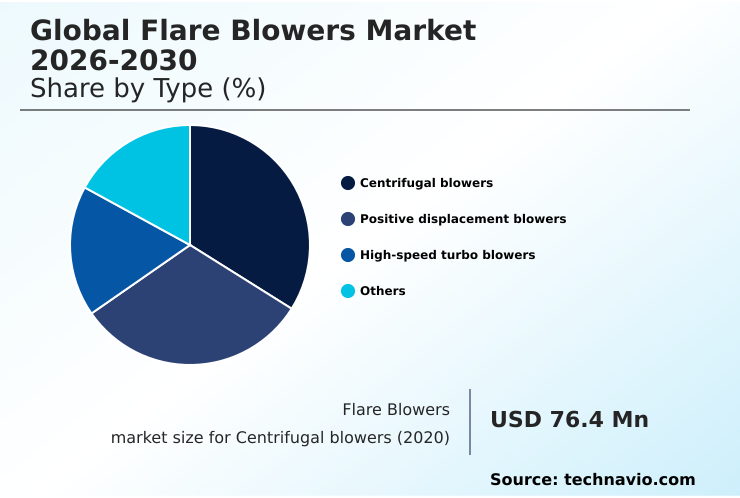
The Centrifugal blowers segment was valued at USD 94.7 million in 2024 and showed a gradual increase during the forecast period.

Get Free Sample

Regional Analysis

APAC is estimated to contribute 34.1% to the growth of the global market during the forecast period.Technavio’s analysts have elaborately explained the regional trends and drivers that shape the market during the forecast period.

See How Flare Blowers Market Demand is Rising in APAC Get Free Sample

The market's geographic landscape is varied, with North America representing a mature segment focused on retrofitting, while APAC is the fastest-growing region, contributing over 34% of incremental growth.

In North America and Europe, stringent regulations at petrochemical facilities drive demand for high-speed turbo blowers and multistage centrifugal blowers to manage volatile organic compounds. Offshore oil platforms globally require robust centrifugal blowers that meet strict industrial safety protocols.

In contrast, developing regions in APAC and the Middle East are focused on new infrastructure, prioritizing systems with high destruction removal efficiency for smokeless combustion.

Emerging applications for regenerative blowers in biogas are also gaining traction in regions with strong green energy policies.

Market Dynamics

Our researchers analyzed the data with 2025 as the base year, along with the key drivers, trends, and challenges. A holistic analysis of drivers will help companies refine their marketing strategies to gain a competitive advantage.

  • Navigating the complexities of flare management requires a deep understanding of specific operational needs. The initial decision often centers on a comparison of centrifugal vs positive displacement blowers, where flow rate variability and pressure requirements are key determinants.
  • For facilities handling aggressive gas streams, selecting the right flare blower for high-sulfur gas is critical to prevent corrosion and ensure long-term reliability. Beyond hardware selection, integrating blowers with legacy flare systems presents a significant engineering challenge, often demanding bespoke solutions that can increase project timelines.
  • The benefits of modular flare blower skids, which can reduce on-site installation time by over 40% compared to traditional builds, are increasingly compelling for fast-track projects. However, the total cost of ownership must account for flare blower maintenance requirements and the need for specialized technicians.
  • As regulations push the industry toward improving flare combustion efficiency, the adoption of variable frequency drive integration benefits becomes undeniable, offering both optimized performance and reduced energy consumption. This holistic approach, from initial design to long-term operation, is essential for balancing safety, compliance, and cost-effectiveness in modern industrial environments.

What are the key market drivers leading to the rise in the adoption of Flare Blowers Industry?

  • The primary market driver is the increasing stringency of environmental mandates and global emission standards, compelling industrial operators to adopt more efficient combustion technologies.

  • Strict environmental regulations and emission standards are the primary market drivers, mandating high combustion efficiency in midstream processing facilities.
  • This regulatory pressure accelerates the adoption of air-assist smokeless flaring technologies, which rely on high-performance vaneaxial blowers and direct-drive blowers to meet compliance, often requiring a destruction efficiency of 99.5%.
  • The expansion of liquefied natural gas infrastructure and upstream production activities further fuels demand, particularly for pre-tested, skid-mounted units that can be rapidly deployed in new facilities.
  • This ensures that new energy projects are built with modern environmental controls from the outset, supporting global energy supply diversification.

What are the market trends shaping the Flare Blowers Industry?

  • A key market trend involves integrating artificial intelligence and digital twin technology. This shift enables predictive diagnostics to optimize combustion system performance and minimize operational downtime.

  • The market is rapidly adopting digital twin technology for predictive diagnostics, allowing operators to anticipate failures in industrial combustion systems and reduce downtime by over 30%. This digital shift is complemented by a move toward modular blower assemblies and systems with advanced acoustic mitigation.
  • In parallel, the integration of variable frequency drives and magnetic levitation bearings has become standard for new installations, particularly in the hydrogen production sector, as they significantly contribute to carbon footprint reduction. This dual focus on intelligent monitoring and energy-efficient hardware helps companies move closer to their net-zero emissions targets while improving operational reliability.

What challenges does the Flare Blowers Industry face during its growth?

  • High initial capital expenditure coupled with specialized maintenance requirements presents a key challenge affecting widespread market adoption and industry growth.

  • A significant challenge is the high capital expenditure required for advanced blower systems, compounded by the complexities of legacy infrastructure integration. Retrofitting older plants in the downstream sector with modern blowers can lead to schedule overruns in over 40% of projects. Furthermore, the strategic industry shift toward zero-routine flaring and gas recovery technologies creates market friction.
  • While technologies like vapor recovery units support methane emission reduction goals, they also reduce the total addressable market for flare-related equipment. This forces manufacturers of components like tri-lobe rotors and explosion-proof flare blower skids to navigate a landscape where demand for efficient combustion coexists with a long-term goal of flare eradication.

Exclusive Technavio Analysis on Customer Landscape

The flare blowers market forecasting report includes the adoption lifecycle of the market, covering from the innovator’s stage to the laggard’s stage. It focuses on adoption rates in different regions based on penetration. Furthermore, the flare blowers market report also includes key purchase criteria and drivers of price sensitivity to help companies evaluate and develop their market growth analysis strategies.

Customer Landscape of Flare Blowers Industry

Competitive Landscape

Companies are implementing various strategies, such as strategic alliances, flare blowers market forecast, partnerships, mergers and acquisitions, geographical expansion, and product/service launches, to enhance their presence in the industry.

Aerzener Maschinenfabrik GmbH - Key offerings include twin-shaft positive displacement machines and delta hybrid blowers engineered for demanding industrial gas handling and flare applications.

The industry research and growth report includes detailed analyses of the competitive landscape of the market and information about key companies, including:

  • Aerzener Maschinenfabrik GmbH
  • AMETEK Inc.
  • Atlas Copco AB
  • Chart Industries Inc.
  • Cimarron Energy Inc.
  • Continental Blower LLC
  • Gardner Denver
  • GBA Flare Systems
  • Hibon
  • Honeywell International Inc.
  • KAESER Kompressoren SE
  • Koch Inc.
  • Lone Star Turbo
  • Mapro International SpA
  • MD Kinney
  • NAO Inc.
  • Piller Group GmbH
  • PT. Kobar Combustindo
  • Republic Manufacturing
  • Zeeco Inc.

Qualitative and quantitative analysis of companies has been conducted to help clients understand the wider business environment as well as the strengths and weaknesses of key industry players. Data is qualitatively analyzed to categorize companies as pure play, category-focused, industry-focused, and diversified; it is quantitatively analyzed to categorize companies as dominant, leading, strong, tentative, and weak.

Recent Development and News in Flare blowers market

  • In April 2025, the Environmental Protection Agency introduced the Clean Air Initiative for Volatile Organic Compounds, mandating the integration of advanced air-assist flare blower systems in all midstream processing facilities to ensure a minimum 99.5% combustion efficiency.
  • In March 2025, Schneider Electric launched its EcoStruxure Flare Intelligence platform, a digital twin environment designed to monitor the mechanical health of high-capacity blowers in air-assisted flare systems.
  • In February 2025, Ingersoll Rand finalized its acquisition of SSI Aeration, a move aimed at expanding its portfolio of positive displacement technologies for gas handling and advanced aeration applications.
  • In October 2025, the World Bank Global Gas Flaring Reduction Partnership announced an agreement in which twenty-five additional nations committed to the Zero Routine Flaring by 2030 initiative, effectively banning the practice for all new oil field developments.

Dive into Technavio’s robust research methodology, blending expert interviews, extensive data synthesis, and validated models for unparalleled Flare Blowers Market insights. See full methodology.

Market Scope
Page number 307
Base year 2025
Historic period 2020-2024
Forecast period 2026-2030
Growth momentum & CAGR Accelerate at a CAGR of 5.8%
Market growth 2026-2030 USD 95.5 million
Market structure Fragmented
YoY growth 2025-2026(%) 5.7%
Key countries US, Canada, Mexico, China, India, Australia, Japan, South Korea, Indonesia, Germany, UK, Norway, Russia, The Netherlands, France, Saudi Arabia, UAE, Qatar, Iraq, Algeria, Brazil, Argentina and Venezuela
Competitive landscape Leading Companies, Market Positioning of Companies, Competitive Strategies, and Industry Risks

Request Free Sample

Research Analyst Overview

  • The market is fundamentally shaped by the need for advanced air-moving equipment designed for safe and efficient industrial combustion. Systems are engineered around specific technologies, including centrifugal blowers, positive displacement blowers, and high-speed turbo blowers, with specialized units like multistage centrifugal blowers, regenerative blowers, and liquid ring blowers serving niche applications.
  • The primary operational goal is achieving high combustion efficiency and destruction removal efficiency, often through air-assist smokeless flaring or comprehensive flare gas recovery systems. Key technological trends driving innovation include the adoption of digital twin technology for predictive diagnostics, the use of variable frequency drives, and advanced acoustic mitigation.
  • Hardware innovations such as direct-drive blowers, tri-lobe rotors, and specialized bearings—including magnetic levitation bearings and air-foil bearings—are enabling energy efficiency gains of up to 37%. Boardroom decisions are increasingly influenced by the long-term trend toward zero-routine flaring, which requires strategic capital allocation away from combustion toward vapor recovery units.
  • This shift impacts investment in modular blower assemblies, skid-mounted units, and explosion-proof flare blower skids, which are crucial for both new projects and retrofits focused on gas boosting and safety compliance.

What are the Key Data Covered in this Flare Blowers Market Research and Growth Report?

  • What is the expected growth of the Flare Blowers Market between 2026 and 2030?

    • USD 95.5 million, at a CAGR of 5.8%

  • What segmentation does the market report cover?

    • The report is segmented by Type (Centrifugal blowers, Positive displacement blowers, High-speed turbo blowers, and Others), Application (Flare gas recovery, Air-assist smokeless flaring, Gas boosting, and Others), Capacity (Medium, Large, and Small) and Geography (North America, APAC, Europe, Middle East and Africa, South America)

  • Which regions are analyzed in the report?

    • North America, APAC, Europe, Middle East and Africa and South America

  • What are the key growth drivers and market challenges?

    • Stringency in environmental mandates and global emission standards, High initial capital expenditure and specialized maintenance requirements

  • Who are the major players in the Flare Blowers Market?

    • Aerzener Maschinenfabrik GmbH, AMETEK Inc., Atlas Copco AB, Chart Industries Inc., Cimarron Energy Inc., Continental Blower LLC, Gardner Denver, GBA Flare Systems, Hibon, Honeywell International Inc., KAESER Kompressoren SE, Koch Inc., Lone Star Turbo, Mapro International SpA, MD Kinney, NAO Inc., Piller Group GmbH, PT. Kobar Combustindo, Republic Manufacturing and Zeeco Inc.

Market Research Insights

  • Market dynamics are shaped by stringent environmental regulations and the expansion of industrial infrastructure. The push for methane emission reduction and enhanced industrial safety protocols necessitates upgrades to industrial combustion systems. This drive for compliance has led to operational improvements, with modern systems achieving over 99.5% destruction efficiency for volatile organic compounds.
  • The growth of liquefied natural gas infrastructure is also a significant factor, with new facilities requiring advanced blowers to manage pressure and ensure smokeless combustion.
  • In the downstream sector, the modernization of aging petrochemical facilities and refineries is critical, where replacing legacy equipment can improve energy efficiency by up to 37%, directly impacting operational costs and contributing to carbon footprint reduction goals.

We can help! Our analysts can customize this flare blowers market research report to meet your requirements.

Get in touch

1. Executive Summary

1.1 Market overview

Executive Summary - Chart on Market Overview
Executive Summary - Data Table on Market Overview
Executive Summary - Chart on Global Market Characteristics
Executive Summary - Chart on Market by Geography
Executive Summary - Chart on Market Segmentation by Type
Executive Summary - Chart on Market Segmentation by Application
Executive Summary - Chart on Market Segmentation by Capacity
Executive Summary - Chart on Incremental Growth
Executive Summary - Data Table on Incremental Growth
Executive Summary - Chart on Company Market Positioning

2. Technavio Analysis

2.1 Analysis of price sensitivity, lifecycle, customer purchase basket, adoption rates, and purchase criteria

2.2 Criticality of inputs and Factors of differentiation

Chart on Overview on criticality of inputs and factors of differentiation

2.3 Factors of disruption

Chart on Overview on factors of disruption

2.4 Impact of drivers and challenges

Chart on Impact of drivers and challenges in 2025 and 2030

3. Market Landscape

3.1 Market ecosystem

Chart on Parent Market
Data Table on - Parent Market

3.2 Market characteristics

Chart on Market characteristics analysis

3.3 Value chain analysis

Chart on Value chain analysis

4. Market Sizing

4.1 Market definition

Data Table on Offerings of companies included in the market definition

4.2 Market segment analysis

Market segments

4.3 Market size 2025

4.4 Market outlook: Forecast for 2025-2030

Chart on Global - Market size and forecast 2025-2030 ($ million)
Data Table on Global - Market size and forecast 2025-2030 ($ million)
Chart on Global Market: Year-over-year growth 2025-2030 (%)
Data Table on Global Market: Year-over-year growth 2025-2030 (%)

5. Historic Market Size

5.1 Global Flare Blowers Market 2020 - 2024

Historic Market Size - Data Table on Global Flare Blowers Market 2020 - 2024 ($ million)

5.2 Type segment analysis 2020 - 2024

Historic Market Size - Type Segment 2020 - 2024 ($ million)

5.3 Application segment analysis 2020 - 2024

Historic Market Size - Application Segment 2020 - 2024 ($ million)

5.4 Capacity segment analysis 2020 - 2024

Historic Market Size - Capacity Segment 2020 - 2024 ($ million)

5.5 Geography segment analysis 2020 - 2024

Historic Market Size - Geography Segment 2020 - 2024 ($ million)

5.6 Country segment analysis 2020 - 2024

Historic Market Size - Country Segment 2020 - 2024 ($ million)

6. Qualitative Analysis

6.1 Impact of AI on Global Flare Blowers Market

6.2 Impact of geopolitical conflicts on Global Flare Blowers Market

7. Five Forces Analysis

7.1 Five forces summary

Five forces analysis - Comparison between 2025 and 2030

7.2 Bargaining power of buyers

Bargaining power of buyers - Impact of key factors 2025 and 2030

7.3 Bargaining power of suppliers

Bargaining power of suppliers - Impact of key factors in 2025 and 2030

7.4 Threat of new entrants

Threat of new entrants - Impact of key factors in 2025 and 2030

7.5 Threat of substitutes

Threat of substitutes - Impact of key factors in 2025 and 2030

7.6 Threat of rivalry

Threat of rivalry - Impact of key factors in 2025 and 2030

7.7 Market condition

Chart on Market condition - Five forces 2025 and 2030

8. Market Segmentation by Type

8.1 Market segments

Chart on Type - Market share 2025-2030 (%)
Data Table on Type - Market share 2025-2030 (%)

8.2 Comparison by Type

Chart on Comparison by Type
Data Table on Comparison by Type

8.3 Centrifugal blowers - Market size and forecast 2025-2030

Chart on Centrifugal blowers - Market size and forecast 2025-2030 ($ million)
Data Table on Centrifugal blowers - Market size and forecast 2025-2030 ($ million)
Chart on Centrifugal blowers - Year-over-year growth 2025-2030 (%)
Data Table on Centrifugal blowers - Year-over-year growth 2025-2030 (%)

8.4 Positive displacement blowers - Market size and forecast 2025-2030

Chart on Positive displacement blowers - Market size and forecast 2025-2030 ($ million)
Data Table on Positive displacement blowers - Market size and forecast 2025-2030 ($ million)
Chart on Positive displacement blowers - Year-over-year growth 2025-2030 (%)
Data Table on Positive displacement blowers - Year-over-year growth 2025-2030 (%)

8.5 High-speed turbo blowers - Market size and forecast 2025-2030

Chart on High-speed turbo blowers - Market size and forecast 2025-2030 ($ million)
Data Table on High-speed turbo blowers - Market size and forecast 2025-2030 ($ million)
Chart on High-speed turbo blowers - Year-over-year growth 2025-2030 (%)
Data Table on High-speed turbo blowers - Year-over-year growth 2025-2030 (%)

8.6 Others - Market size and forecast 2025-2030

Chart on Others - Market size and forecast 2025-2030 ($ million)
Data Table on Others - Market size and forecast 2025-2030 ($ million)
Chart on Others - Year-over-year growth 2025-2030 (%)
Data Table on Others - Year-over-year growth 2025-2030 (%)

8.7 Market opportunity by Type

Market opportunity by Type ($ million)
Data Table on Market opportunity by Type ($ million)

9. Market Segmentation by Application

9.1 Market segments

Chart on Application - Market share 2025-2030 (%)
Data Table on Application - Market share 2025-2030 (%)

9.2 Comparison by Application

Chart on Comparison by Application
Data Table on Comparison by Application

9.3 Flare gas recovery - Market size and forecast 2025-2030

Chart on Flare gas recovery - Market size and forecast 2025-2030 ($ million)
Data Table on Flare gas recovery - Market size and forecast 2025-2030 ($ million)
Chart on Flare gas recovery - Year-over-year growth 2025-2030 (%)
Data Table on Flare gas recovery - Year-over-year growth 2025-2030 (%)

9.4 Air-assist smokeless flaring - Market size and forecast 2025-2030

Chart on Air-assist smokeless flaring - Market size and forecast 2025-2030 ($ million)
Data Table on Air-assist smokeless flaring - Market size and forecast 2025-2030 ($ million)
Chart on Air-assist smokeless flaring - Year-over-year growth 2025-2030 (%)
Data Table on Air-assist smokeless flaring - Year-over-year growth 2025-2030 (%)

9.5 Gas boosting - Market size and forecast 2025-2030

Chart on Gas boosting - Market size and forecast 2025-2030 ($ million)
Data Table on Gas boosting - Market size and forecast 2025-2030 ($ million)
Chart on Gas boosting - Year-over-year growth 2025-2030 (%)
Data Table on Gas boosting - Year-over-year growth 2025-2030 (%)

9.6 Others - Market size and forecast 2025-2030

Chart on Others - Market size and forecast 2025-2030 ($ million)
Data Table on Others - Market size and forecast 2025-2030 ($ million)
Chart on Others - Year-over-year growth 2025-2030 (%)
Data Table on Others - Year-over-year growth 2025-2030 (%)

9.7 Market opportunity by Application

Market opportunity by Application ($ million)
Data Table on Market opportunity by Application ($ million)

10. Market Segmentation by Capacity

10.1 Market segments

Chart on Capacity - Market share 2025-2030 (%)
Data Table on Capacity - Market share 2025-2030 (%)

10.2 Comparison by Capacity

Chart on Comparison by Capacity
Data Table on Comparison by Capacity

10.3 Medium - Market size and forecast 2025-2030

Chart on Medium - Market size and forecast 2025-2030 ($ million)
Data Table on Medium - Market size and forecast 2025-2030 ($ million)
Chart on Medium - Year-over-year growth 2025-2030 (%)
Data Table on Medium - Year-over-year growth 2025-2030 (%)

10.4 Large - Market size and forecast 2025-2030

Chart on Large - Market size and forecast 2025-2030 ($ million)
Data Table on Large - Market size and forecast 2025-2030 ($ million)
Chart on Large - Year-over-year growth 2025-2030 (%)
Data Table on Large - Year-over-year growth 2025-2030 (%)

10.5 Small - Market size and forecast 2025-2030

Chart on Small - Market size and forecast 2025-2030 ($ million)
Data Table on Small - Market size and forecast 2025-2030 ($ million)
Chart on Small - Year-over-year growth 2025-2030 (%)
Data Table on Small - Year-over-year growth 2025-2030 (%)

10.6 Market opportunity by Capacity

Market opportunity by Capacity ($ million)
Data Table on Market opportunity by Capacity ($ million)

11. Customer Landscape

11.1 Customer landscape overview

Analysis of price sensitivity, lifecycle, customer purchase basket, adoption rates, and purchase criteria

12. Geographic Landscape

12.1 Geographic segmentation

Chart on Market share by geography 2025-2030 (%)
Data Table on Market share by geography 2025-2030 (%)

12.2 Geographic comparison

Chart on Geographic comparison
Data Table on Geographic comparison

12.3 North America - Market size and forecast 2025-2030

Chart on North America - Market size and forecast 2025-2030 ($ million)
Data Table on North America - Market size and forecast 2025-2030 ($ million)
Chart on North America - Year-over-year growth 2025-2030 (%)
Data Table on North America - Year-over-year growth 2025-2030 (%)
Chart on Regional Comparison - North America
Data Table on Regional Comparison - North America

12.3.1 US - Market size and forecast 2025-2030

Chart on US - Market size and forecast 2025-2030 ($ million)
Data Table on US - Market size and forecast 2025-2030 ($ million)
Chart on US - Year-over-year growth 2025-2030 (%)
Data Table on US - Year-over-year growth 2025-2030 (%)

12.3.2 Canada - Market size and forecast 2025-2030

Chart on Canada - Market size and forecast 2025-2030 ($ million)
Data Table on Canada - Market size and forecast 2025-2030 ($ million)
Chart on Canada - Year-over-year growth 2025-2030 (%)
Data Table on Canada - Year-over-year growth 2025-2030 (%)

12.3.3 Mexico - Market size and forecast 2025-2030

Chart on Mexico - Market size and forecast 2025-2030 ($ million)
Data Table on Mexico - Market size and forecast 2025-2030 ($ million)
Chart on Mexico - Year-over-year growth 2025-2030 (%)
Data Table on Mexico - Year-over-year growth 2025-2030 (%)

12.4 APAC - Market size and forecast 2025-2030

Chart on APAC - Market size and forecast 2025-2030 ($ million)
Data Table on APAC - Market size and forecast 2025-2030 ($ million)
Chart on APAC - Year-over-year growth 2025-2030 (%)
Data Table on APAC - Year-over-year growth 2025-2030 (%)
Chart on Regional Comparison - APAC
Data Table on Regional Comparison - APAC

12.4.1 China - Market size and forecast 2025-2030

Chart on China - Market size and forecast 2025-2030 ($ million)
Data Table on China - Market size and forecast 2025-2030 ($ million)
Chart on China - Year-over-year growth 2025-2030 (%)
Data Table on China - Year-over-year growth 2025-2030 (%)

12.4.2 India - Market size and forecast 2025-2030

Chart on India - Market size and forecast 2025-2030 ($ million)
Data Table on India - Market size and forecast 2025-2030 ($ million)
Chart on India - Year-over-year growth 2025-2030 (%)
Data Table on India - Year-over-year growth 2025-2030 (%)

12.4.3 Australia - Market size and forecast 2025-2030

Chart on Australia - Market size and forecast 2025-2030 ($ million)
Data Table on Australia - Market size and forecast 2025-2030 ($ million)
Chart on Australia - Year-over-year growth 2025-2030 (%)
Data Table on Australia - Year-over-year growth 2025-2030 (%)

12.4.4 Japan - Market size and forecast 2025-2030

Chart on Japan - Market size and forecast 2025-2030 ($ million)
Data Table on Japan - Market size and forecast 2025-2030 ($ million)
Chart on Japan - Year-over-year growth 2025-2030 (%)
Data Table on Japan - Year-over-year growth 2025-2030 (%)

12.4.5 South Korea - Market size and forecast 2025-2030

Chart on South Korea - Market size and forecast 2025-2030 ($ million)
Data Table on South Korea - Market size and forecast 2025-2030 ($ million)
Chart on South Korea - Year-over-year growth 2025-2030 (%)
Data Table on South Korea - Year-over-year growth 2025-2030 (%)

12.4.6 Indonesia - Market size and forecast 2025-2030

Chart on Indonesia - Market size and forecast 2025-2030 ($ million)
Data Table on Indonesia - Market size and forecast 2025-2030 ($ million)
Chart on Indonesia - Year-over-year growth 2025-2030 (%)
Data Table on Indonesia - Year-over-year growth 2025-2030 (%)

12.5 Europe - Market size and forecast 2025-2030

Chart on Europe - Market size and forecast 2025-2030 ($ million)
Data Table on Europe - Market size and forecast 2025-2030 ($ million)
Chart on Europe - Year-over-year growth 2025-2030 (%)
Data Table on Europe - Year-over-year growth 2025-2030 (%)
Chart on Regional Comparison - Europe
Data Table on Regional Comparison - Europe

12.5.1 Germany - Market size and forecast 2025-2030

Chart on Germany - Market size and forecast 2025-2030 ($ million)
Data Table on Germany - Market size and forecast 2025-2030 ($ million)
Chart on Germany - Year-over-year growth 2025-2030 (%)
Data Table on Germany - Year-over-year growth 2025-2030 (%)

12.5.2 UK - Market size and forecast 2025-2030

Chart on UK - Market size and forecast 2025-2030 ($ million)
Data Table on UK - Market size and forecast 2025-2030 ($ million)
Chart on UK - Year-over-year growth 2025-2030 (%)
Data Table on UK - Year-over-year growth 2025-2030 (%)

12.5.3 Norway - Market size and forecast 2025-2030

Chart on Norway - Market size and forecast 2025-2030 ($ million)
Data Table on Norway - Market size and forecast 2025-2030 ($ million)
Chart on Norway - Year-over-year growth 2025-2030 (%)
Data Table on Norway - Year-over-year growth 2025-2030 (%)

12.5.4 Russia - Market size and forecast 2025-2030

Chart on Russia - Market size and forecast 2025-2030 ($ million)
Data Table on Russia - Market size and forecast 2025-2030 ($ million)
Chart on Russia - Year-over-year growth 2025-2030 (%)
Data Table on Russia - Year-over-year growth 2025-2030 (%)

12.5.5 The Netherlands - Market size and forecast 2025-2030

Chart on The Netherlands - Market size and forecast 2025-2030 ($ million)
Data Table on The Netherlands - Market size and forecast 2025-2030 ($ million)
Chart on The Netherlands - Year-over-year growth 2025-2030 (%)
Data Table on The Netherlands - Year-over-year growth 2025-2030 (%)

12.5.6 France - Market size and forecast 2025-2030

Chart on France - Market size and forecast 2025-2030 ($ million)
Data Table on France - Market size and forecast 2025-2030 ($ million)
Chart on France - Year-over-year growth 2025-2030 (%)
Data Table on France - Year-over-year growth 2025-2030 (%)

12.6 Middle East and Africa - Market size and forecast 2025-2030

Chart on Middle East and Africa - Market size and forecast 2025-2030 ($ million)
Data Table on Middle East and Africa - Market size and forecast 2025-2030 ($ million)
Chart on Middle East and Africa - Year-over-year growth 2025-2030 (%)
Data Table on Middle East and Africa - Year-over-year growth 2025-2030 (%)
Chart on Regional Comparison - Middle East and Africa
Data Table on Regional Comparison - Middle East and Africa

12.6.1 Saudi Arabia - Market size and forecast 2025-2030

Chart on Saudi Arabia - Market size and forecast 2025-2030 ($ million)
Data Table on Saudi Arabia - Market size and forecast 2025-2030 ($ million)
Chart on Saudi Arabia - Year-over-year growth 2025-2030 (%)
Data Table on Saudi Arabia - Year-over-year growth 2025-2030 (%)

12.6.2 UAE - Market size and forecast 2025-2030

Chart on UAE - Market size and forecast 2025-2030 ($ million)
Data Table on UAE - Market size and forecast 2025-2030 ($ million)
Chart on UAE - Year-over-year growth 2025-2030 (%)
Data Table on UAE - Year-over-year growth 2025-2030 (%)

12.6.3 Qatar - Market size and forecast 2025-2030

Chart on Qatar - Market size and forecast 2025-2030 ($ million)
Data Table on Qatar - Market size and forecast 2025-2030 ($ million)
Chart on Qatar - Year-over-year growth 2025-2030 (%)
Data Table on Qatar - Year-over-year growth 2025-2030 (%)

12.6.4 Iraq - Market size and forecast 2025-2030

Chart on Iraq - Market size and forecast 2025-2030 ($ million)
Data Table on Iraq - Market size and forecast 2025-2030 ($ million)
Chart on Iraq - Year-over-year growth 2025-2030 (%)
Data Table on Iraq - Year-over-year growth 2025-2030 (%)

12.6.5 Algeria - Market size and forecast 2025-2030

Chart on Algeria - Market size and forecast 2025-2030 ($ million)
Data Table on Algeria - Market size and forecast 2025-2030 ($ million)
Chart on Algeria - Year-over-year growth 2025-2030 (%)
Data Table on Algeria - Year-over-year growth 2025-2030 (%)

12.7 South America - Market size and forecast 2025-2030

Chart on South America - Market size and forecast 2025-2030 ($ million)
Data Table on South America - Market size and forecast 2025-2030 ($ million)
Chart on South America - Year-over-year growth 2025-2030 (%)
Data Table on South America - Year-over-year growth 2025-2030 (%)
Chart on Regional Comparison - South America
Data Table on Regional Comparison - South America

12.7.1 Brazil - Market size and forecast 2025-2030

Chart on Brazil - Market size and forecast 2025-2030 ($ million)
Data Table on Brazil - Market size and forecast 2025-2030 ($ million)
Chart on Brazil - Year-over-year growth 2025-2030 (%)
Data Table on Brazil - Year-over-year growth 2025-2030 (%)

12.7.2 Argentina - Market size and forecast 2025-2030

Chart on Argentina - Market size and forecast 2025-2030 ($ million)
Data Table on Argentina - Market size and forecast 2025-2030 ($ million)
Chart on Argentina - Year-over-year growth 2025-2030 (%)
Data Table on Argentina - Year-over-year growth 2025-2030 (%)

12.7.3 Venezuela - Market size and forecast 2025-2030

Chart on Venezuela - Market size and forecast 2025-2030 ($ million)
Data Table on Venezuela - Market size and forecast 2025-2030 ($ million)
Chart on Venezuela - Year-over-year growth 2025-2030 (%)
Data Table on Venezuela - Year-over-year growth 2025-2030 (%)

12.8 Market opportunity by geography

Market opportunity by geography ($ million)
Data Tables on Market opportunity by geography ($ million)

13. Drivers, Challenges, and Opportunity

13.1 Market drivers

Stringency in environmental mandates and global emission standards
Expansion of liquefied natural gas infrastructure and upstream production
Modernization of industrial infrastructure and enhanced safety protocols

13.2 Market challenges

High initial capital expenditure and specialized maintenance requirements
Technical integration hurdles and compatibility with legacy infrastructure
Strategic shift toward zero-routine flaring and gas recovery technologies

13.3 Impact of drivers and challenges

Impact of drivers and challenges in 2025 and 2030

13.4 Market opportunities

Integration of AI and digital twin technology for predictive diagnostics
Strategic shift toward modular and skid-mounted blower assemblies
Focus on acoustic mitigation and energy-efficient variable frequency drive integration

14. Competitive Landscape

14.1 Overview

14.2

Overview on criticality of inputs and factors of differentiation

14.3 Landscape disruption

Overview on factors of disruption

14.4 Industry risks

Impact of key risks on business

15. Competitive Analysis

15.1 Companies profiled

Companies covered

15.2 Company ranking index

15.3 Market positioning of companies

Matrix on companies position and classification

15.4 Aerzener Maschinenfabrik GmbH

Aerzener Maschinenfabrik GmbH - Overview
Aerzener Maschinenfabrik GmbH - Product / Service
Aerzener Maschinenfabrik GmbH - Key offerings
SWOT

15.5 Atlas Copco AB

Atlas Copco AB - Overview
Atlas Copco AB - Business segments
Atlas Copco AB - Key offerings
Atlas Copco AB - Segment focus
SWOT

15.6 Continental Blower LLC

Continental Blower LLC - Overview
Continental Blower LLC - Product / Service
Continental Blower LLC - Key offerings
SWOT

15.7 Gardner Denver

Gardner Denver - Overview
Gardner Denver - Product / Service
Gardner Denver - Key offerings
SWOT

15.8 GBA Flare Systems

GBA Flare Systems - Overview
GBA Flare Systems - Product / Service
GBA Flare Systems - Key offerings
SWOT

15.9 Hibon

Hibon - Overview
Hibon - Product / Service
Hibon - Key offerings
SWOT

15.10 Honeywell International Inc.

Honeywell International Inc. - Overview
Honeywell International Inc. - Business segments
Honeywell International Inc. - Key news
Honeywell International Inc. - Key offerings
Honeywell International Inc. - Segment focus
SWOT

15.11 KAESER Kompressoren SE

KAESER Kompressoren SE - Overview
KAESER Kompressoren SE - Product / Service
KAESER Kompressoren SE - Key offerings
SWOT

15.12 Koch Inc.

Koch Inc. - Overview
Koch Inc. - Product / Service
Koch Inc. - Key offerings
SWOT

15.13 Mapro International SpA

Mapro International SpA - Overview
Mapro International SpA - Product / Service
Mapro International SpA - Key offerings
SWOT

15.14 MD Kinney

MD Kinney - Overview
MD Kinney - Product / Service
MD Kinney - Key offerings
SWOT

15.15 NAO Inc.

NAO Inc. - Overview
NAO Inc. - Product / Service
NAO Inc. - Key offerings
SWOT

15.16 Piller Group GmbH

Piller Group GmbH - Overview
Piller Group GmbH - Product / Service
Piller Group GmbH - Key offerings
SWOT

15.17 PT. Kobar Combustindo

PT. Kobar Combustindo - Overview
PT. Kobar Combustindo - Product / Service
PT. Kobar Combustindo - Key offerings
SWOT

15.18 Republic Manufacturing

Republic Manufacturing - Overview
Republic Manufacturing - Product / Service
Republic Manufacturing - Key offerings
SWOT

16. Appendix

16.1 Scope of the report

Market definition
Objectives
Notes and caveats

16.2 Inclusions and exclusions checklist

Inclusions checklist
Exclusions checklist

16.3 Currency conversion rates for US$

16.4 Research methodology

16.5 Data procurement

Information sources

16.6 Data validation

16.7 Validation techniques employed for market sizing

16.8 Data synthesis

16.9 360 degree market analysis

16.10 List of abbreviations

Research Methodology

Technavio presents a detailed picture of the market by way of study, synthesis, and summation of data from multiple sources. The analysts have presented the various facets of the market with a particular focus on identifying the key industry influencers. The data thus presented is comprehensive, reliable, and the result of extensive research, both primary and secondary.

INFORMATION SOURCES

Primary sources

  • Manufacturers and suppliers
  • Channel partners
  • Industry experts
  • Strategic decision makers

Secondary sources

  • Industry journals and periodicals
  • Government data
  • Financial reports of key industry players
  • Historical data
  • Press releases

DATA ANALYSIS

Data Synthesis

  • Collation of data
  • Estimation of key figures
  • Analysis of derived insights

Data Validation

  • Triangulation with data models
  • Reference against proprietary databases
  • Corroboration with industry experts

REPORT WRITING

Qualitative

  • Market drivers
  • Market challenges
  • Market trends
  • Five forces analysis

Quantitative

  • Market size and forecast
  • Market segmentation
  • Geographical insights
  • Competitive landscape

Interested in this report?

Get your sample now to see our research methodology and insights!

Download Now

Frequently Asked Questions

Flare Blowers market growth will increase by USD 95.5 million during 2026-2030.

The Flare Blowers market is expected to grow at a CAGR of 5.8% during 2026-2030.

Flare Blowers market is segmented by Type (Centrifugal blowers, Positive displacement blowers, High-speed turbo blowers, Others) Application (Flare gas recovery, Air-assist smokeless flaring, Gas boosting, Others) Capacity (Medium, Large, Small)

Aerzener Maschinenfabrik GmbH, AMETEK Inc., Atlas Copco AB, Chart Industries Inc., Cimarron Energy Inc., Continental Blower LLC, Gardner Denver, GBA Flare Systems, Hibon, Honeywell International Inc., KAESER Kompressoren SE, Koch Inc., Lone Star Turbo, Mapro International SpA, MD Kinney, NAO Inc., Piller Group GmbH, PT. Kobar Combustindo, Republic Manufacturing, Zeeco Inc. are a few of the key vendors in the Flare Blowers market.

APAC will register the highest growth rate of 34.1% among the other regions. Therefore, the Flare Blowers market in APAC is expected to garner significant business opportunities for the vendors during the forecast period.

US, Canada, Mexico, China, India, Australia, Japan, South Korea, Indonesia, Germany, UK, Norway, Russia, The Netherlands, France, Saudi Arabia, UAE, Qatar, Iraq, Algeria, Brazil, Argentina, Venezuela

  • Stringency in environmental mandates and global emission standards is the driving factor this market.

The Flare Blowers market vendors should focus on grabbing business opportunities from the Type segment as it accounted for the largest market share in the base year.
RIA - Research AI Assistant
Ask RIA