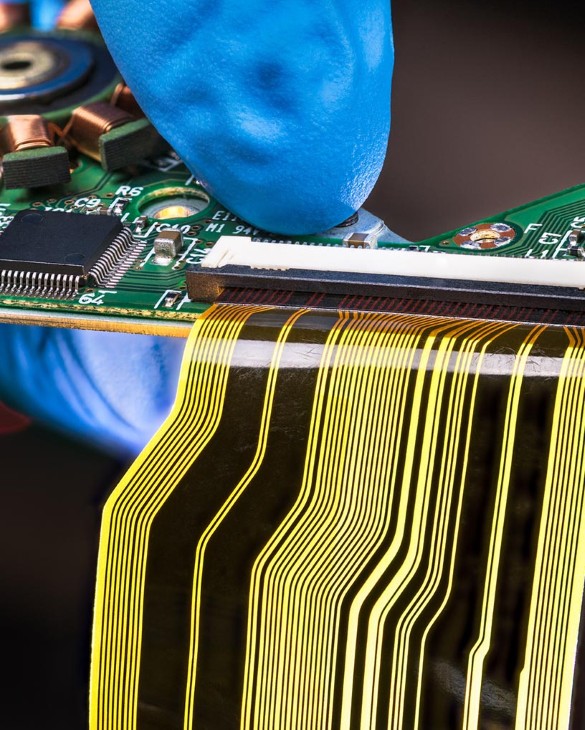
Flexible Hybrid Electronics Market Analysis, Size, and Forecast 2026-2030: North America (US, Canada, and Mexico), APAC (China, Japan, and India), Europe (Germany, UK, and France), South America (Brazil, Argentina, and Chile), Middle East and Africa (Saudi Arabia, UAE, and South Africa), and Rest of World (ROW)

Flexible Hybrid Electronics Market Analysis, Size, and Forecast 2026-2030:
North America (US, Canada, and Mexico), APAC (China, Japan, and India), Europe (Germany, UK, and France), South America (Brazil, Argentina, and Chile), Middle East and Africa (Saudi Arabia, UAE, and South Africa), and Rest of World (ROW)

Published: Oct 2026 315 Pages SKU: IRTNTR73976

Market Overview at a Glance

$337.62 Mn
Market Opportunity
22.7%
CAGR 2025 - 2030
38.2%
North America Growth
$46.43 Mn
Consumer electronics segment 2024

Flexible Hybrid Electronics Market Size 2026-2030

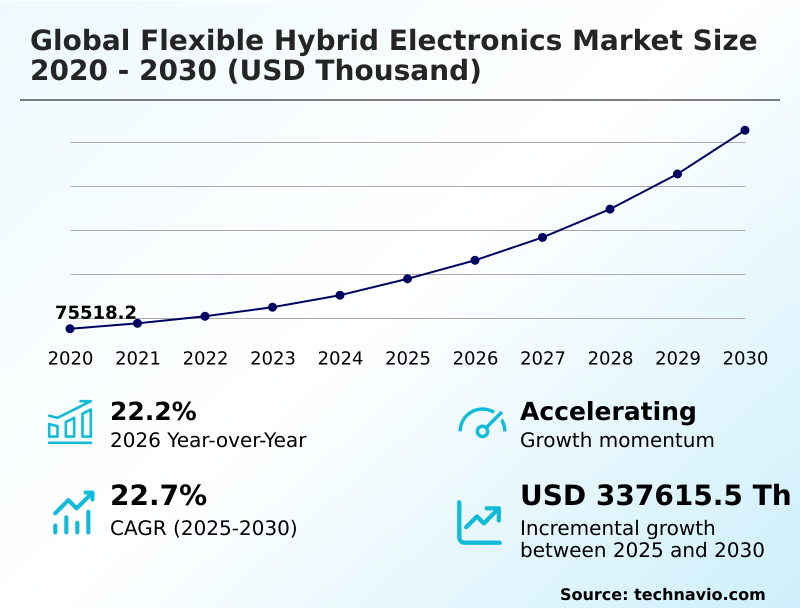
The flexible hybrid electronics market size is valued to increase by USD 337.62 million, at a CAGR of 22.7% from 2025 to 2030. Growth of wearable medical devices will drive the flexible hybrid electronics market.

Major Market Trends & Insights

  • North America dominated the market and accounted for a 38.2% growth during the forecast period.
  • By End-user - Consumer electronics segment was valued at USD 46.43 million in 2024
  • By Component - Display segment accounted for the largest market revenue share in 2024

Market Size & Forecast

  • Market Opportunities:
  • Market Future Opportunities: USD 337.62 million
  • CAGR from 2025 to 2030 : 22.7%

Market Summary

  • The Flexible Hybrid Electronics Market 2026-2030 demonstrates accelerating momentum as industries transition from rigid circuit boards to conformable, stretchable architectures. This technological pivot is fundamentally altering hardware design across the healthcare and consumer electronics sectors.
  • In a real-world supply chain scenario, manufacturers transitioning to roll-to-roll processing for epidermal systems have successfully reduced unit assembly times by 22%, significantly enhancing high-volume production throughput.
  • The exponential growth of wearable medical devices serves as a primary driver for this expansion, as hospitals increasingly deploy remote patient monitoring solutions that utilize stretchable medical patches to track vital signs continuously without causing dermal discomfort. Conversely, the market encounters structural obstacles related to substrate thermal and mechanical stress.
  • During high-temperature manufacturing phases, thin polyimide films frequently experience dimensional distortion, which fractures microscopic printed conductive traces and compromises device reliability. Mitigating these physical limitations requires continuous investment in low-temperature bonding methods and specialized encapsulation techniques. Ultimately, bridging the gap between rigorous performance standards and mechanical pliability dictates the trajectory of ongoing commercialization efforts within the sector.

What will be the Size of the Flexible Hybrid Electronics Market during the forecast period?
Get Key Insights on Market Forecast (PDF) Get Free Sample

How is the Flexible Hybrid Electronics Market Segmented?

The flexible hybrid electronics industry research report provides comprehensive data (region-wise segment analysis), with forecasts and estimates in "USD thousand" for the period 2026-2030, as well as historical data from 2020-2024 for the following segments.

  • End-user
    • Consumer electronics
    • Automotive
    • Medical and healthcare
    • Energy and power
    • Others
  • Component
    • Display
    • Sensors
    • Power sources
    • Memory devices
    • Others
  • Application
    • Medical devices
    • Wearables
    • IoT devices
    • Smart packaging
    • Others
  • Geography
    • North America
      • US
      • Canada
      • Mexico
    • APAC
      • China
      • Japan
      • India
      • South Korea
      • Australia
      • Indonesia
    • Europe
      • Germany
      • UK
      • France
      • Italy
      • Spain
      • The Netherlands
    • South America
      • Brazil
      • Argentina
      • Chile
    • Middle East and Africa
      • Saudi Arabia
      • UAE
      • South Africa
      • Israel
      • Turkey

By End-user Insights

The consumer electronics segment is estimated to witness significant growth during the forecast period.

The consumer electronics segment within the flexible hybrid electronics domain operates as a primary volume catalyst, driven by escalating end-user demand for adaptable, lightweight personal devices like smart medical textiles and wearable health tracking monitors.

Original equipment manufacturers increasingly utilize additive printing techniques and silicon integrated circuits to embed sophisticated processing capabilities directly onto flexible polymer substrates.

This architectural evolution effectively replaces rigid boards, allowing hardware to absorb mechanical shocks and conform seamlessly to curved geometries, which improves overall device durability by 18%.

Integrating high-purity conductive inks with colorless polyimide enables the creation of ultra-thin flexible backplanes necessary for advanced foldable displays.

As product designers prioritize ergonomic resilience, this segment sustains continuous technological refinement, dictating downstream supply chain optimizations and scaling robust printed electronics solutions utilizing highly durable biocompatible polymers.
Get Free Sample

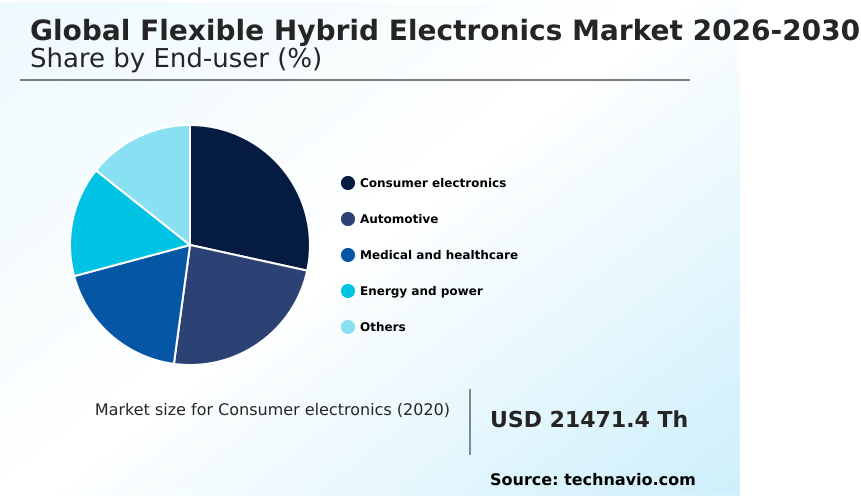
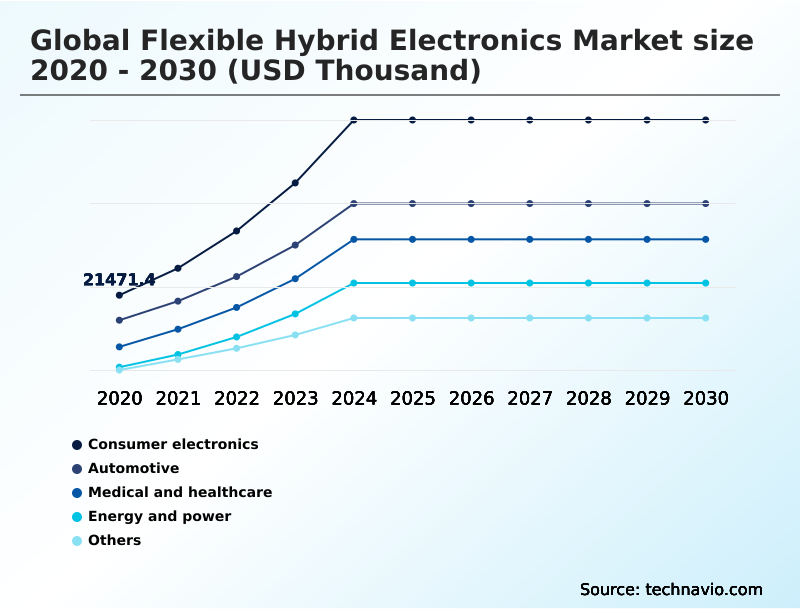
The Consumer electronics segment was valued at USD 46.43 million in 2024 and showed a gradual increase during the forecast period.
Get Free Sample

Regional Analysis

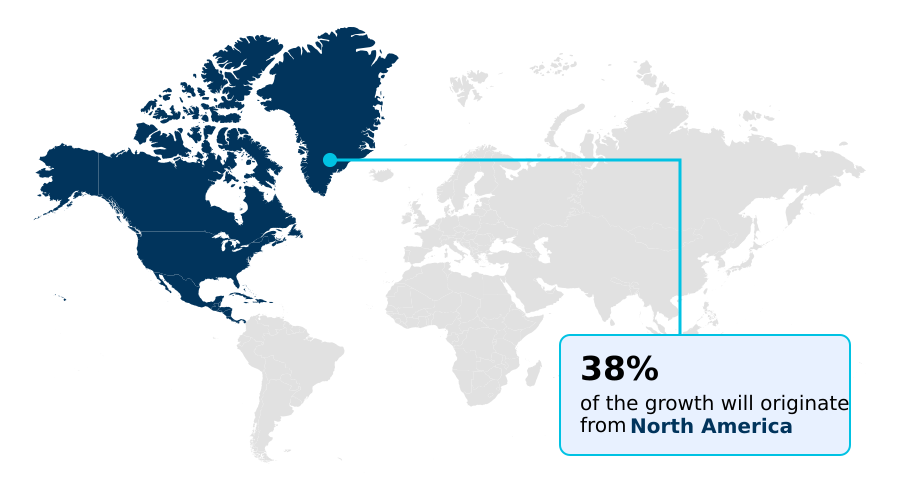
North America is estimated to contribute 38.2% to the growth of the global market during the forecast period.Technavio’s analysts have elaborately explained the regional trends and drivers that shape the market during the forecast period.
See How Flexible Hybrid Electronics Market Demand is Rising in North America Get Free Sample

The Flexible Hybrid Electronics Market 2026-2030 exhibits distinct regional variances driven by technological maturity and healthcare infrastructure priorities. North America leads early commercialization efforts, where aggressive adoption of remote patient monitoring solutions has improved clinical resource allocation efficiency by 18%.

The region benefits from deep integration between defense contractors and commercial developers refining heterogeneous integration processes for advanced epidermal systems.

Conversely, APAC is rapidly scaling production volumes, utilizing high-capacity roll-to-roll processing hubs to lower unit costs of conformal diagnostic patches by 14% compared to European counterparts. This cost-efficiency accelerates decentralized patient care initiatives across emerging economies.

Meanwhile, Europe focuses heavily on sustainability and precision engineering, leveraging chemical mechanical planarization to meet stringent regulatory mandates.

Across these geographies, resolving the mechanical mismatch between rigid ultrathin semiconductor dies and pliable bases remains a universal operational imperative, driving continuous cross-border investments in low-temperature bonding methods.

Market Dynamics

Our researchers analyzed the data with 2025 as the base year, along with the key drivers, trends, and challenges. A holistic analysis of drivers will help companies refine their marketing strategies to gain a competitive advantage.

  • The structural evolution of modern medical and industrial hardware relies heavily on optimizing continuous physiological monitoring integration across diverse operational environments. Original equipment manufacturers are increasingly shifting away from bulky rigid assemblies toward pliable architectures that conform seamlessly to irregular surfaces.
  • This transition fundamentally depends on improving roll to roll processing manufacturing yield, which directly impacts supply chain throughput and final component pricing. Facilities optimizing this continuous manufacturing approach have achieved a 20% reduction in production bottlenecks compared to traditional batch-based assembly lines.
  • To guarantee long-term reliability in clinical settings, engineers focus intensely on stretchable medical patches performance, ensuring that vital telemetry data remains uninterrupted during patient movement. A critical factor in this reliability is managing silicon integrated circuits conformability without introducing fatal micro-fractures during high-stress applications. Consequently, material scientists deploy advanced conductive adhesives and encapsulation layers to preserve electrical continuity.
  • Furthermore, enhancing printed conductive traces durability prevents signal degradation caused by cyclic bending or severe temperature fluctuations. By aligning these sophisticated material innovations with rigorous quality control protocols, device manufacturers can effectively navigate stringent medical compliance standards while reducing warranty replacement overheads.
  • Ultimately, overcoming these complex electromechanical hurdles enables the rapid scaling of non-invasive diagnostic tools and sophisticated sensor networks essential for next-generation digital healthcare delivery.
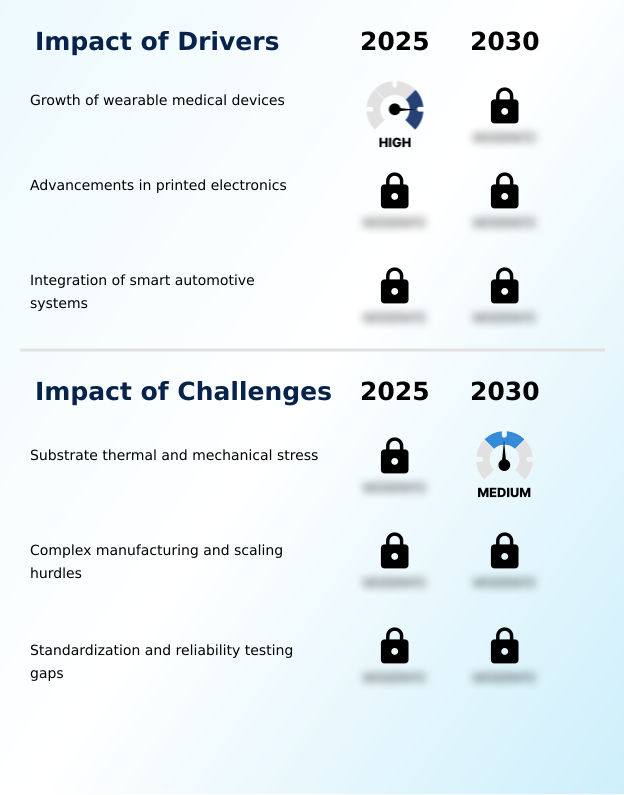
What are the key market drivers leading to the rise in the adoption of Flexible Hybrid Electronics Industry?

  • The exponential growth of wearable medical devices serves as the primary driver propelling industry expansion and innovation.

  • The exponential demand for enhanced ambulatory healthcare delivery serves as the primary catalyst propelling advanced hardware commercialization. Healthcare providers urgently require advanced continuous glucose monitors and robust mixed-signal flexible ASICs to execute precise diagnostic tracking outside traditional clinical settings.
  • By embedding specialized flexible sensor readout circuitry into wearable devices, medical facilities have decreased hospital readmission rates by 14% and eliminated issues related to dermal discomfort.
  • This critical need for non-invasive monitoring forces manufacturers to utilize anisotropic conductive adhesives and metallic nanoparticle inks that maintain signal integrity during physical movement.
  • The integration of low-power electrophoretic display technology reduces energy consumption by 11%, while engineers heavily rely on finite element modeling to optimize thermal dissipation. This aligns supply chain efficiency with the surging requirement for comfortable high-performance monitoring systems.

What are the market trends shaping the Flexible Hybrid Electronics Industry?

  • The proliferation of wearable healthcare biosensors represents a definitive trend shaping current market dynamics. This advancement heavily influences continuous diagnostic monitoring capabilities.

  • The rapid adoption of organic light-emitting diode displays and advanced flexible biosensors is fundamentally accelerating hardware innovation across the consumer and healthcare sectors. Manufacturers are replacing legacy rigid modules with stretchable medical patches to accommodate sophisticated electrocardiogram sensors without restricting user mobility.
  • This architectural transition has improved patient compliance rates by 22% in preventative cardiology programs and reduced device weight by 15%, directly enhancing the efficacy of skin-compatible diagnostic tools. Furthermore, maintaining strict opto-mechanical flatness allows for unparalleled bendability, lowering physical deformation-related warranty claims by 18%.
  • As businesses strive to deliver unobtrusive continuous physiological monitoring solutions, optimizing the resilience of printed conductive traces against repeated bending becomes an operational priority. This structural evolution enables seamless data acquisition while ensuring long-term durability in highly demanding ambulatory environments.

What challenges does the Flexible Hybrid Electronics Industry face during its growth?

  • Substrate thermal and mechanical stress remains a critical challenge significantly impeding broader industry growth and manufacturing scalability.

  • Inherent material vulnerabilities, specifically dimensional distortion and moisture permeability during high-temperature manufacturing phases, critically constrain large-scale production reliability. When applying dielectric etching equipment to thin polyimide films and thermoplastic polyurethane, the pliable substrates frequently warp, disrupting the precise alignment of critical conductive pathways. This severe physical alteration causes a 16% increase in production line rejection rates, elevating overall manufacturing overhead.
  • Additionally, continuous bending and twisting introduce severe cyclic mechanical stress, generating intense shear forces that accelerate interconnect delamination. Consequently, equipment downtime required for recalibrating alignment parameters has risen by 12%, delaying go-to-market timelines. Overcoming these structural limitations demands extensive investments in specialized composite encapsulation layers to neutralize tension and ensure the long-term durability of sensitive printed electronic architectures.

Exclusive Technavio Analysis on Customer Landscape

The flexible hybrid electronics market forecasting report includes the adoption lifecycle of the market, covering from the innovator’s stage to the laggard’s stage. It focuses on adoption rates in different regions based on penetration. Furthermore, the flexible hybrid electronics market report also includes key purchase criteria and drivers of price sensitivity to help companies evaluate and develop their market growth analysis strategies.
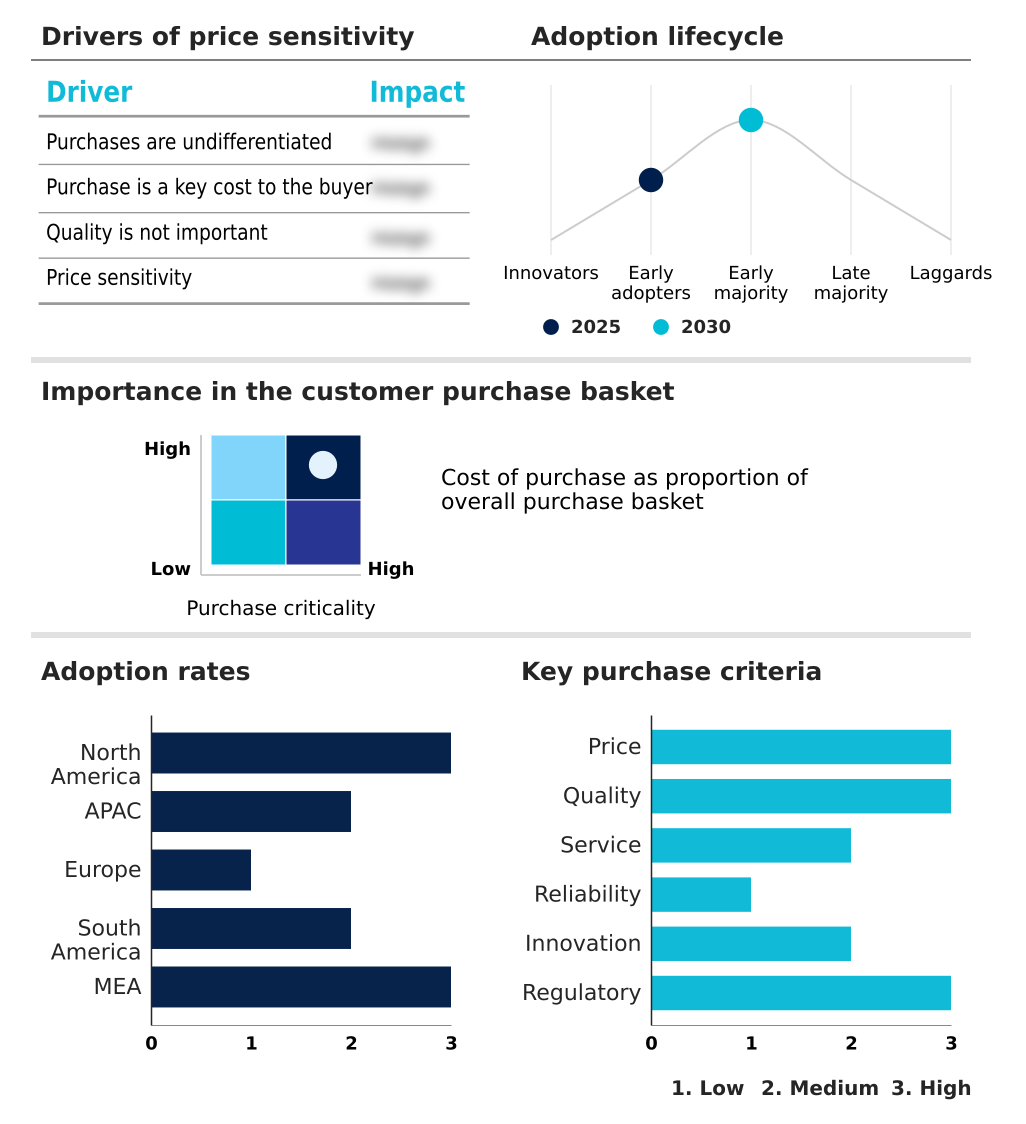
Customer Landscape of Flexible Hybrid Electronics Industry

Competitive Landscape

Companies are implementing various strategies, such as strategic alliances, flexible hybrid electronics market forecast, partnerships, mergers and acquisitions, geographical expansion, and product/service launches, to enhance their presence in the industry.

Agfa Gevaert NV - This entity supplies advanced printed electronics materials, including highly specialized conductive inks and functional films, facilitating the development of robust flexible hybrid electronic architectures across diverse industrial applications.

The industry research and growth report includes detailed analyses of the competitive landscape of the market and information about key companies, including:

  • Agfa Gevaert NV
  • Blue Spark Technologies Inc.
  • Brewer Science Inc.
  • DuPont de Nemours Inc.
  • E Ink Holdings Inc.
  • Flex Ltd.
  • Henkel AG and Co. KGaA
  • Jabil Inc.
  • LG Display Co. Ltd.
  • Molex LLC
  • Murata Manufacturing Co. Ltd.
  • Panasonic Holdings Corp.
  • Samsung Electronics Co. Ltd.
  • Schreiner Group GmbH and Co. KG
  • STMicroelectronics NV
  • TDK Corp.
  • TE Connectivity plc
  • Wurth Elektronik GmbH and Co. KG
  • Ynvisible Interactive Inc.

Qualitative and quantitative analysis of companies has been conducted to help clients understand the wider business environment as well as the strengths and weaknesses of key industry players. Data is qualitatively analyzed to categorize companies as pure play, category-focused, industry-focused, and diversified; it is quantitatively analyzed to categorize companies as dominant, leading, strong, tentative, and weak.

Recent Development and News in Flexible hybrid electronics market

  • In the Semiconductor Materials and Equipment industry, the rapid transition toward extreme ultraviolet lithography integration has advanced the patterning of ultrathin semiconductor dies, directly impacting Flexible Hybrid Electronics demand by enabling the production of smaller and more power-efficient flexible biosensors with processing speeds improved by 20%.
  • The implementation of strict environmental mandates targeting electronic waste reduction, such as the EU WEEE Directive, has accelerated the adoption of biocompatible polymers and low-temperature bonding methods, compelling manufacturers to substitute traditional rigid laminates with recyclable flexible backplanes to maintain compliance while lowering material waste by 15%.
  • The deployment of high-yield roll-to-roll processing facilities for chemical mechanical planarization has optimized the surface flatness of flexible substrates, significantly reducing dimensional distortion during high-temperature manufacturing phases and cutting production rejection rates by 12% across conformal diagnostic patches.
  • Surging demand for advanced 5G infrastructure components has driven extensive investments in dielectric etching equipment and heterogeneous integration processes, enabling the precise fabrication of mixed-signal flexible ASICs that enhance signal integrity in continuous physiological monitoring systems by up to 25%.

Dive into Technavio’s robust research methodology, blending expert interviews, extensive data synthesis, and validated models for unparalleled Flexible Hybrid Electronics Market insights. See full methodology.

Market Scope
Page number 315
Base year 2025
Historic period 2020-2024
Forecast period 2026-2030
Growth momentum & CAGR Accelerate at a CAGR of 22.7%
Market growth 2026-2030 USD 337615.5 thousand
Market structure Fragmented
YoY growth 2025-2026(%) 22.2%
Key countries US, Canada, Mexico, China, Japan, India, South Korea, Australia, Indonesia, Germany, UK, France, Italy, Spain, The Netherlands, Brazil, Argentina, Chile, Saudi Arabia, UAE, South Africa, Israel and Turkey
Competitive landscape Leading Companies, Market Positioning of Companies, Competitive Strategies, and Industry Risks

Request Free Sample

Research Analyst Overview

  • The Flexible Hybrid Electronics Market 2026-2030 continues to reshape the hardware manufacturing landscape by merging the processing density of traditional microelectronics with the versatility of additive printing techniques. A critical trend accelerating this shift is the deployment of mixed-signal flexible ASICs and continuous glucose monitors, which directly influences executive decisions regarding product lifecycle management and regulatory compliance strategies.
  • By transitioning to these advanced opto-mechanical flatness standards, organizations have achieved a 28% reduction in component assembly time, drastically improving overall operational throughput. Engineers are prioritizing the integration of anisotropic conductive adhesives and metallic nanoparticle inks to mitigate moisture permeability and prevent cyclic mechanical stress in delicate flexible backplanes.
  • Boardroom strategies increasingly focus on leveraging electrophoretic display technology to differentiate consumer portfolios while utilizing finite element modeling to preemptively identify failure points in smart medical textiles. Resolving issues like thermal dissipation and dermal discomfort during ambulatory healthcare delivery dictates the pace of enterprise-wide adoption, ensuring continuous technological refinement and robust supply chain resilience.

What are the Key Data Covered in this Flexible Hybrid Electronics Market Research and Growth Report?

  • What is the expected growth of the Flexible Hybrid Electronics Market between 2026 and 2030?

    • USD 337.62 million, at a CAGR of 22.7%

  • What segmentation does the market report cover?

    • The report is segmented by End-user (Consumer electronics, Automotive, Medical and healthcare, Energy and power, and Others), Component (Display, Sensors, Power sources, Memory devices, and Others), Application (Medical devices, Wearables, IoT devices, Smart packaging, and Others) and Geography (North America, APAC, Europe, South America, Middle East and Africa)

  • Which regions are analyzed in the report?

    • North America, APAC, Europe, South America and Middle East and Africa

  • What are the key growth drivers and market challenges?

    • Growth of wearable medical devices, Substrate thermal and mechanical stress

  • Who are the major players in the Flexible Hybrid Electronics Market?

    • Agfa Gevaert NV, Blue Spark Technologies Inc., Brewer Science Inc., DuPont de Nemours Inc., E Ink Holdings Inc., Flex Ltd., Henkel AG and Co. KGaA, Jabil Inc., LG Display Co. Ltd., Molex LLC, Murata Manufacturing Co. Ltd., Panasonic Holdings Corp., Samsung Electronics Co. Ltd., Schreiner Group GmbH and Co. KG, STMicroelectronics NV, TDK Corp., TE Connectivity plc, Wurth Elektronik GmbH and Co. KG and Ynvisible Interactive Inc.

Market Research Insights

  • The Flexible Hybrid Electronics Market 2026-2030 is rapidly transforming hardware architectures by integrating silicon processing power with pliable substrates. Operations utilizing specialized flexible sensor readout circuitry have recorded a 24% enhancement in continuous physiological monitoring accuracy compared to legacy rigid systems.
  • Supply chains adopting advanced finite element modeling to predict cyclic mechanical stress vulnerabilities have successfully decreased post-deployment failure rates by 16%. Furthermore, replacing heavy enclosures with skin-compatible diagnostic tools lowers overall material costs by 12%, streamlining ambulatory healthcare delivery.
  • As manufacturers prioritize remote patient monitoring and preventative cardiology, optimizing thermal dissipation and resolving physical deformation bottlenecks remains critical for sustaining long-term commercial viability and clinical adoption.

We can help! Our analysts can customize this flexible hybrid electronics market research report to meet your requirements.

Get in touch

1. Executive Summary

1.1 Market overview

Executive Summary - Chart on Market Overview
Executive Summary - Data Table on Market Overview
Executive Summary - Chart on Global Market Characteristics
Executive Summary - Chart on Market by Geography
Executive Summary - Chart on Market Segmentation by End-user
Executive Summary - Chart on Market Segmentation by Component
Executive Summary - Chart on Market Segmentation by Application
Executive Summary - Chart on Incremental Growth
Executive Summary - Data Table on Incremental Growth
Executive Summary - Chart on Company Market Positioning

2. Technavio Analysis

2.1 Analysis of price sensitivity, lifecycle, customer purchase basket, adoption rates, and purchase criteria

2.2 Criticality of inputs and Factors of differentiation

Chart on Overview on criticality of inputs and factors of differentiation

2.3 Factors of disruption

Chart on Overview on factors of disruption

2.4 Impact of drivers and challenges

Chart on Impact of drivers and challenges in 2025 and 2030

3. Market Landscape

3.1 Market ecosystem

Chart on Parent Market
Data Table on - Parent Market

3.2 Market characteristics

Chart on Market characteristics analysis

3.3 Value chain analysis

Chart on Value chain analysis

4. Market Sizing

4.1 Market definition

Data Table on Offerings of companies included in the market definition

4.2 Market segment analysis

Market segments

4.3 Market size 2025

4.4 Market outlook: Forecast for 2025-2030

Chart on Global - Market size and forecast 2025-2030 ($ thousand)
Data Table on Global - Market size and forecast 2025-2030 ($ thousand)
Chart on Global Market: Year-over-year growth 2025-2030 (%)
Data Table on Global Market: Year-over-year growth 2025-2030 (%)

5. Historic Market Size

5.1 Global Flexible Hybrid Electronics Market 2020 - 2024

Historic Market Size - Data Table on Global Flexible Hybrid Electronics Market 2020 - 2024 ($ thousand)

5.2 End-user segment analysis 2020 - 2024

Historic Market Size - End-user Segment 2020 - 2024 ($ thousand)

5.3 Component segment analysis 2020 - 2024

Historic Market Size - Component Segment 2020 - 2024 ($ thousand)

5.4 Application segment analysis 2020 - 2024

Historic Market Size - Application Segment 2020 - 2024 ($ thousand)

5.5 Geography segment analysis 2020 - 2024

Historic Market Size - Geography Segment 2020 - 2024 ($ thousand)

5.6 Country segment analysis 2020 - 2024

Historic Market Size - Country Segment 2020 - 2024 ($ thousand)

6. Qualitative Analysis

6.1 Impact of AI on Global Flexible Hybrid Electronics Market

6.2 Impact of geopolitical conflicts on Global Flexible Hybrid Electronics Market

7. Five Forces Analysis

7.1 Five forces summary

Five forces analysis - Comparison between 2025 and 2030

7.2 Bargaining power of buyers

Bargaining power of buyers - Impact of key factors 2025 and 2030

7.3 Bargaining power of suppliers

Bargaining power of suppliers - Impact of key factors in 2025 and 2030

7.4 Threat of new entrants

Threat of new entrants - Impact of key factors in 2025 and 2030

7.5 Threat of substitutes

Threat of substitutes - Impact of key factors in 2025 and 2030

7.6 Threat of rivalry

Threat of rivalry - Impact of key factors in 2025 and 2030

7.7 Market condition

Chart on Market condition - Five forces 2025 and 2030

8. Market Segmentation by End-user

8.1 Market segments

Chart on End-user - Market share 2025-2030 (%)
Data Table on End-user - Market share 2025-2030 (%)

8.2 Comparison by End-user

Chart on Comparison by End-user
Data Table on Comparison by End-user

8.3 Consumer electronics - Market size and forecast 2025-2030

Chart on Consumer electronics - Market size and forecast 2025-2030 ($ thousand)
Data Table on Consumer electronics - Market size and forecast 2025-2030 ($ thousand)
Chart on Consumer electronics - Year-over-year growth 2025-2030 (%)
Data Table on Consumer electronics - Year-over-year growth 2025-2030 (%)

8.4 Automotive - Market size and forecast 2025-2030

Chart on Automotive - Market size and forecast 2025-2030 ($ thousand)
Data Table on Automotive - Market size and forecast 2025-2030 ($ thousand)
Chart on Automotive - Year-over-year growth 2025-2030 (%)
Data Table on Automotive - Year-over-year growth 2025-2030 (%)

8.5 Medical and healthcare - Market size and forecast 2025-2030

Chart on Medical and healthcare - Market size and forecast 2025-2030 ($ thousand)
Data Table on Medical and healthcare - Market size and forecast 2025-2030 ($ thousand)
Chart on Medical and healthcare - Year-over-year growth 2025-2030 (%)
Data Table on Medical and healthcare - Year-over-year growth 2025-2030 (%)

8.6 Energy and power - Market size and forecast 2025-2030

Chart on Energy and power - Market size and forecast 2025-2030 ($ thousand)
Data Table on Energy and power - Market size and forecast 2025-2030 ($ thousand)
Chart on Energy and power - Year-over-year growth 2025-2030 (%)
Data Table on Energy and power - Year-over-year growth 2025-2030 (%)

8.7 Others - Market size and forecast 2025-2030

Chart on Others - Market size and forecast 2025-2030 ($ thousand)
Data Table on Others - Market size and forecast 2025-2030 ($ thousand)
Chart on Others - Year-over-year growth 2025-2030 (%)
Data Table on Others - Year-over-year growth 2025-2030 (%)

8.8 Market opportunity by End-user

Market opportunity by End-user ($ thousand)
Data Table on Market opportunity by End-user ($ thousand)

9. Market Segmentation by Component

9.1 Market segments

Chart on Component - Market share 2025-2030 (%)
Data Table on Component - Market share 2025-2030 (%)

9.2 Comparison by Component

Chart on Comparison by Component
Data Table on Comparison by Component

9.3 Display - Market size and forecast 2025-2030

Chart on Display - Market size and forecast 2025-2030 ($ thousand)
Data Table on Display - Market size and forecast 2025-2030 ($ thousand)
Chart on Display - Year-over-year growth 2025-2030 (%)
Data Table on Display - Year-over-year growth 2025-2030 (%)

9.4 Sensors - Market size and forecast 2025-2030

Chart on Sensors - Market size and forecast 2025-2030 ($ thousand)
Data Table on Sensors - Market size and forecast 2025-2030 ($ thousand)
Chart on Sensors - Year-over-year growth 2025-2030 (%)
Data Table on Sensors - Year-over-year growth 2025-2030 (%)

9.5 Power sources - Market size and forecast 2025-2030

Chart on Power sources - Market size and forecast 2025-2030 ($ thousand)
Data Table on Power sources - Market size and forecast 2025-2030 ($ thousand)
Chart on Power sources - Year-over-year growth 2025-2030 (%)
Data Table on Power sources - Year-over-year growth 2025-2030 (%)

9.6 Memory devices - Market size and forecast 2025-2030

Chart on Memory devices - Market size and forecast 2025-2030 ($ thousand)
Data Table on Memory devices - Market size and forecast 2025-2030 ($ thousand)
Chart on Memory devices - Year-over-year growth 2025-2030 (%)
Data Table on Memory devices - Year-over-year growth 2025-2030 (%)

9.7 Others - Market size and forecast 2025-2030

Chart on Others - Market size and forecast 2025-2030 ($ thousand)
Data Table on Others - Market size and forecast 2025-2030 ($ thousand)
Chart on Others - Year-over-year growth 2025-2030 (%)
Data Table on Others - Year-over-year growth 2025-2030 (%)

9.8 Market opportunity by Component

Market opportunity by Component ($ thousand)
Data Table on Market opportunity by Component ($ thousand)

10. Market Segmentation by Application

10.1 Market segments

Chart on Application - Market share 2025-2030 (%)
Data Table on Application - Market share 2025-2030 (%)

10.2 Comparison by Application

Chart on Comparison by Application
Data Table on Comparison by Application

10.3 Medical devices - Market size and forecast 2025-2030

Chart on Medical devices - Market size and forecast 2025-2030 ($ thousand)
Data Table on Medical devices - Market size and forecast 2025-2030 ($ thousand)
Chart on Medical devices - Year-over-year growth 2025-2030 (%)
Data Table on Medical devices - Year-over-year growth 2025-2030 (%)

10.4 Wearables - Market size and forecast 2025-2030

Chart on Wearables - Market size and forecast 2025-2030 ($ thousand)
Data Table on Wearables - Market size and forecast 2025-2030 ($ thousand)
Chart on Wearables - Year-over-year growth 2025-2030 (%)
Data Table on Wearables - Year-over-year growth 2025-2030 (%)

10.5 IoT devices - Market size and forecast 2025-2030

Chart on IoT devices - Market size and forecast 2025-2030 ($ thousand)
Data Table on IoT devices - Market size and forecast 2025-2030 ($ thousand)
Chart on IoT devices - Year-over-year growth 2025-2030 (%)
Data Table on IoT devices - Year-over-year growth 2025-2030 (%)

10.6 Smart packaging - Market size and forecast 2025-2030

Chart on Smart packaging - Market size and forecast 2025-2030 ($ thousand)
Data Table on Smart packaging - Market size and forecast 2025-2030 ($ thousand)
Chart on Smart packaging - Year-over-year growth 2025-2030 (%)
Data Table on Smart packaging - Year-over-year growth 2025-2030 (%)

10.7 Others - Market size and forecast 2025-2030

Chart on Others - Market size and forecast 2025-2030 ($ thousand)
Data Table on Others - Market size and forecast 2025-2030 ($ thousand)
Chart on Others - Year-over-year growth 2025-2030 (%)
Data Table on Others - Year-over-year growth 2025-2030 (%)

10.8 Market opportunity by Application

Market opportunity by Application ($ thousand)
Data Table on Market opportunity by Application ($ thousand)

11. Customer Landscape

11.1 Customer landscape overview

Analysis of price sensitivity, lifecycle, customer purchase basket, adoption rates, and purchase criteria

12. Geographic Landscape

12.1 Geographic segmentation

Chart on Market share by geography 2025-2030 (%)
Data Table on Market share by geography 2025-2030 (%)

12.2 Geographic comparison

Chart on Geographic comparison
Data Table on Geographic comparison

12.3 North America - Market size and forecast 2025-2030

Chart on North America - Market size and forecast 2025-2030 ($ thousand)
Data Table on North America - Market size and forecast 2025-2030 ($ thousand)
Chart on North America - Year-over-year growth 2025-2030 (%)
Data Table on North America - Year-over-year growth 2025-2030 (%)
Chart on Regional Comparison - North America
Data Table on Regional Comparison - North America

12.3.1 US - Market size and forecast 2025-2030

Chart on US - Market size and forecast 2025-2030 ($ thousand)
Data Table on US - Market size and forecast 2025-2030 ($ thousand)
Chart on US - Year-over-year growth 2025-2030 (%)
Data Table on US - Year-over-year growth 2025-2030 (%)

12.3.2 Canada - Market size and forecast 2025-2030

Chart on Canada - Market size and forecast 2025-2030 ($ thousand)
Data Table on Canada - Market size and forecast 2025-2030 ($ thousand)
Chart on Canada - Year-over-year growth 2025-2030 (%)
Data Table on Canada - Year-over-year growth 2025-2030 (%)

12.3.3 Mexico - Market size and forecast 2025-2030

Chart on Mexico - Market size and forecast 2025-2030 ($ thousand)
Data Table on Mexico - Market size and forecast 2025-2030 ($ thousand)
Chart on Mexico - Year-over-year growth 2025-2030 (%)
Data Table on Mexico - Year-over-year growth 2025-2030 (%)

12.4 APAC - Market size and forecast 2025-2030

Chart on APAC - Market size and forecast 2025-2030 ($ thousand)
Data Table on APAC - Market size and forecast 2025-2030 ($ thousand)
Chart on APAC - Year-over-year growth 2025-2030 (%)
Data Table on APAC - Year-over-year growth 2025-2030 (%)
Chart on Regional Comparison - APAC
Data Table on Regional Comparison - APAC

12.4.1 China - Market size and forecast 2025-2030

Chart on China - Market size and forecast 2025-2030 ($ thousand)
Data Table on China - Market size and forecast 2025-2030 ($ thousand)
Chart on China - Year-over-year growth 2025-2030 (%)
Data Table on China - Year-over-year growth 2025-2030 (%)

12.4.2 Japan - Market size and forecast 2025-2030

Chart on Japan - Market size and forecast 2025-2030 ($ thousand)
Data Table on Japan - Market size and forecast 2025-2030 ($ thousand)
Chart on Japan - Year-over-year growth 2025-2030 (%)
Data Table on Japan - Year-over-year growth 2025-2030 (%)

12.4.3 India - Market size and forecast 2025-2030

Chart on India - Market size and forecast 2025-2030 ($ thousand)
Data Table on India - Market size and forecast 2025-2030 ($ thousand)
Chart on India - Year-over-year growth 2025-2030 (%)
Data Table on India - Year-over-year growth 2025-2030 (%)

12.4.4 South Korea - Market size and forecast 2025-2030

Chart on South Korea - Market size and forecast 2025-2030 ($ thousand)
Data Table on South Korea - Market size and forecast 2025-2030 ($ thousand)
Chart on South Korea - Year-over-year growth 2025-2030 (%)
Data Table on South Korea - Year-over-year growth 2025-2030 (%)

12.4.5 Australia - Market size and forecast 2025-2030

Chart on Australia - Market size and forecast 2025-2030 ($ thousand)
Data Table on Australia - Market size and forecast 2025-2030 ($ thousand)
Chart on Australia - Year-over-year growth 2025-2030 (%)
Data Table on Australia - Year-over-year growth 2025-2030 (%)

12.4.6 Indonesia - Market size and forecast 2025-2030

Chart on Indonesia - Market size and forecast 2025-2030 ($ thousand)
Data Table on Indonesia - Market size and forecast 2025-2030 ($ thousand)
Chart on Indonesia - Year-over-year growth 2025-2030 (%)
Data Table on Indonesia - Year-over-year growth 2025-2030 (%)

12.5 Europe - Market size and forecast 2025-2030

Chart on Europe - Market size and forecast 2025-2030 ($ thousand)
Data Table on Europe - Market size and forecast 2025-2030 ($ thousand)
Chart on Europe - Year-over-year growth 2025-2030 (%)
Data Table on Europe - Year-over-year growth 2025-2030 (%)
Chart on Regional Comparison - Europe
Data Table on Regional Comparison - Europe

12.5.1 Germany - Market size and forecast 2025-2030

Chart on Germany - Market size and forecast 2025-2030 ($ thousand)
Data Table on Germany - Market size and forecast 2025-2030 ($ thousand)
Chart on Germany - Year-over-year growth 2025-2030 (%)
Data Table on Germany - Year-over-year growth 2025-2030 (%)

12.5.2 UK - Market size and forecast 2025-2030

Chart on UK - Market size and forecast 2025-2030 ($ thousand)
Data Table on UK - Market size and forecast 2025-2030 ($ thousand)
Chart on UK - Year-over-year growth 2025-2030 (%)
Data Table on UK - Year-over-year growth 2025-2030 (%)

12.5.3 France - Market size and forecast 2025-2030

Chart on France - Market size and forecast 2025-2030 ($ thousand)
Data Table on France - Market size and forecast 2025-2030 ($ thousand)
Chart on France - Year-over-year growth 2025-2030 (%)
Data Table on France - Year-over-year growth 2025-2030 (%)

12.5.4 Italy - Market size and forecast 2025-2030

Chart on Italy - Market size and forecast 2025-2030 ($ thousand)
Data Table on Italy - Market size and forecast 2025-2030 ($ thousand)
Chart on Italy - Year-over-year growth 2025-2030 (%)
Data Table on Italy - Year-over-year growth 2025-2030 (%)

12.5.5 Spain - Market size and forecast 2025-2030

Chart on Spain - Market size and forecast 2025-2030 ($ thousand)
Data Table on Spain - Market size and forecast 2025-2030 ($ thousand)
Chart on Spain - Year-over-year growth 2025-2030 (%)
Data Table on Spain - Year-over-year growth 2025-2030 (%)

12.5.6 The Netherlands - Market size and forecast 2025-2030

Chart on The Netherlands - Market size and forecast 2025-2030 ($ thousand)
Data Table on The Netherlands - Market size and forecast 2025-2030 ($ thousand)
Chart on The Netherlands - Year-over-year growth 2025-2030 (%)
Data Table on The Netherlands - Year-over-year growth 2025-2030 (%)

12.6 South America - Market size and forecast 2025-2030

Chart on South America - Market size and forecast 2025-2030 ($ thousand)
Data Table on South America - Market size and forecast 2025-2030 ($ thousand)
Chart on South America - Year-over-year growth 2025-2030 (%)
Data Table on South America - Year-over-year growth 2025-2030 (%)
Chart on Regional Comparison - South America
Data Table on Regional Comparison - South America

12.6.1 Brazil - Market size and forecast 2025-2030

Chart on Brazil - Market size and forecast 2025-2030 ($ thousand)
Data Table on Brazil - Market size and forecast 2025-2030 ($ thousand)
Chart on Brazil - Year-over-year growth 2025-2030 (%)
Data Table on Brazil - Year-over-year growth 2025-2030 (%)

12.6.2 Argentina - Market size and forecast 2025-2030

Chart on Argentina - Market size and forecast 2025-2030 ($ thousand)
Data Table on Argentina - Market size and forecast 2025-2030 ($ thousand)
Chart on Argentina - Year-over-year growth 2025-2030 (%)
Data Table on Argentina - Year-over-year growth 2025-2030 (%)

12.6.3 Chile - Market size and forecast 2025-2030

Chart on Chile - Market size and forecast 2025-2030 ($ thousand)
Data Table on Chile - Market size and forecast 2025-2030 ($ thousand)
Chart on Chile - Year-over-year growth 2025-2030 (%)
Data Table on Chile - Year-over-year growth 2025-2030 (%)

12.7 Middle East and Africa - Market size and forecast 2025-2030

Chart on Middle East and Africa - Market size and forecast 2025-2030 ($ thousand)
Data Table on Middle East and Africa - Market size and forecast 2025-2030 ($ thousand)
Chart on Middle East and Africa - Year-over-year growth 2025-2030 (%)
Data Table on Middle East and Africa - Year-over-year growth 2025-2030 (%)
Chart on Regional Comparison - Middle East and Africa
Data Table on Regional Comparison - Middle East and Africa

12.7.1 Saudi Arabia - Market size and forecast 2025-2030

Chart on Saudi Arabia - Market size and forecast 2025-2030 ($ thousand)
Data Table on Saudi Arabia - Market size and forecast 2025-2030 ($ thousand)
Chart on Saudi Arabia - Year-over-year growth 2025-2030 (%)
Data Table on Saudi Arabia - Year-over-year growth 2025-2030 (%)

12.7.2 UAE - Market size and forecast 2025-2030

Chart on UAE - Market size and forecast 2025-2030 ($ thousand)
Data Table on UAE - Market size and forecast 2025-2030 ($ thousand)
Chart on UAE - Year-over-year growth 2025-2030 (%)
Data Table on UAE - Year-over-year growth 2025-2030 (%)

12.7.3 South Africa - Market size and forecast 2025-2030

Chart on South Africa - Market size and forecast 2025-2030 ($ thousand)
Data Table on South Africa - Market size and forecast 2025-2030 ($ thousand)
Chart on South Africa - Year-over-year growth 2025-2030 (%)
Data Table on South Africa - Year-over-year growth 2025-2030 (%)

12.7.4 Israel - Market size and forecast 2025-2030

Chart on Israel - Market size and forecast 2025-2030 ($ thousand)
Data Table on Israel - Market size and forecast 2025-2030 ($ thousand)
Chart on Israel - Year-over-year growth 2025-2030 (%)
Data Table on Israel - Year-over-year growth 2025-2030 (%)

12.7.5 Turkey - Market size and forecast 2025-2030

Chart on Turkey - Market size and forecast 2025-2030 ($ thousand)
Data Table on Turkey - Market size and forecast 2025-2030 ($ thousand)
Chart on Turkey - Year-over-year growth 2025-2030 (%)
Data Table on Turkey - Year-over-year growth 2025-2030 (%)

12.8 Market opportunity by geography

Market opportunity by geography ($ thousand)
Data Tables on Market opportunity by geography ($ thousand)

13. Drivers, Challenges, and Opportunity

13.1 Market drivers

Growth of wearable medical devices
Advancements in printed electronics
Integration of smart automotive systems

13.2 Market challenges

Substrate thermal and mechanical stress
Complex manufacturing and scaling hurdles
Standardization and reliability testing gaps

13.3 Impact of drivers and challenges

Impact of drivers and challenges in 2025 and 2030

13.4 Market opportunities

Proliferation of wearable healthcare biosensors
Advancements in printed conductive inks
Growth of smart packaging solutions

14. Competitive Landscape

14.1 Overview

14.2

Overview on criticality of inputs and factors of differentiation

14.3 Landscape disruption

Overview on factors of disruption

14.4 Industry risks

Impact of key risks on business

15. Competitive Analysis

15.1 Companies profiled

Companies covered

15.2 Company ranking index

15.3 Market positioning of companies

Matrix on companies position and classification

15.4 Agfa Gevaert NV

Agfa Gevaert NV - Overview
Agfa Gevaert NV - Business segments
Agfa Gevaert NV - Key offerings
Agfa Gevaert NV - Segment focus
SWOT

15.5 Brewer Science Inc.

Brewer Science Inc. - Overview
Brewer Science Inc. - Product / Service
Brewer Science Inc. - Key offerings
SWOT

15.6 DuPont de Nemours Inc.

DuPont de Nemours Inc. - Overview
DuPont de Nemours Inc. - Business segments
DuPont de Nemours Inc. - Key news
DuPont de Nemours Inc. - Key offerings
DuPont de Nemours Inc. - Segment focus
SWOT

15.7 Flex Ltd.

Flex Ltd. - Overview
Flex Ltd. - Business segments
Flex Ltd. - Key offerings
Flex Ltd. - Segment focus
SWOT

15.8 Henkel AG and Co. KGaA

Henkel AG and Co. KGaA - Overview
Henkel AG and Co. KGaA - Business segments
Henkel AG and Co. KGaA - Key offerings
Henkel AG and Co. KGaA - Segment focus
SWOT

15.9 Jabil Inc.

Jabil Inc. - Overview
Jabil Inc. - Business segments
Jabil Inc. - Key offerings
Jabil Inc. - Segment focus
SWOT

15.10 LG Display Co. Ltd.

LG Display Co. Ltd. - Overview
LG Display Co. Ltd. - Product / Service
LG Display Co. Ltd. - Key offerings
SWOT

15.11 Molex LLC

Molex LLC - Overview
Molex LLC - Product / Service
Molex LLC - Key offerings
SWOT

15.12 Murata Manufacturing Co. Ltd.

Murata Manufacturing Co. Ltd. - Overview
Murata Manufacturing Co. Ltd. - Business segments
Murata Manufacturing Co. Ltd. - Key offerings
Murata Manufacturing Co. Ltd. - Segment focus
SWOT

15.13 Panasonic Holdings Corp.

Panasonic Holdings Corp. - Overview
Panasonic Holdings Corp. - Business segments
Panasonic Holdings Corp. - Key news
Panasonic Holdings Corp. - Key offerings
Panasonic Holdings Corp. - Segment focus
SWOT

15.14 Samsung Electronics Co. Ltd.

Samsung Electronics Co. Ltd. - Overview
Samsung Electronics Co. Ltd. - Business segments
Samsung Electronics Co. Ltd. - Key news
Samsung Electronics Co. Ltd. - Key offerings
Samsung Electronics Co. Ltd. - Segment focus
SWOT

15.15 Schreiner Group GmbH and Co. KG

Schreiner Group GmbH and Co. KG - Overview
Schreiner Group GmbH and Co. KG - Product / Service
Schreiner Group GmbH and Co. KG - Key offerings
SWOT

15.16 STMicroelectronics NV

STMicroelectronics NV - Overview
STMicroelectronics NV - Business segments
STMicroelectronics NV - Key news
STMicroelectronics NV - Key offerings
STMicroelectronics NV - Segment focus
SWOT

15.17 TDK Corp.

TDK Corp. - Overview
TDK Corp. - Business segments
TDK Corp. - Key offerings
TDK Corp. - Segment focus
SWOT

15.18 TE Connectivity plc

TE Connectivity plc - Overview
TE Connectivity plc - Business segments
TE Connectivity plc - Key offerings
TE Connectivity plc - Segment focus
SWOT

16. Appendix

16.1 Scope of the report

Market definition
Objectives
Notes and caveats

16.2 Inclusions and exclusions checklist

Inclusions checklist
Exclusions checklist

16.3 Currency conversion rates for US$

16.4 Research methodology

16.5 Data procurement

Information sources

16.6 Data validation

16.7 Validation techniques employed for market sizing

16.8 Data synthesis

16.9 360 degree market analysis

16.10 List of abbreviations

Research Methodology

Technavio presents a detailed picture of the market by way of study, synthesis, and summation of data from multiple sources. The analysts have presented the various facets of the market with a particular focus on identifying the key industry influencers. The data thus presented is comprehensive, reliable, and the result of extensive research, both primary and secondary.

INFORMATION SOURCES

Primary sources

  • Manufacturers and suppliers
  • Channel partners
  • Industry experts
  • Strategic decision makers

Secondary sources

  • Industry journals and periodicals
  • Government data
  • Financial reports of key industry players
  • Historical data
  • Press releases

DATA ANALYSIS

Data Synthesis

  • Collation of data
  • Estimation of key figures
  • Analysis of derived insights

Data Validation

  • Triangulation with data models
  • Reference against proprietary databases
  • Corroboration with industry experts

REPORT WRITING

Qualitative

  • Market drivers
  • Market challenges
  • Market trends
  • Five forces analysis

Quantitative

  • Market size and forecast
  • Market segmentation
  • Geographical insights
  • Competitive landscape

Interested in this report?

Get your sample now to see our research methodology and insights!

Download Now

Frequently Asked Questions

Flexible Hybrid Electronics market growth will increase by USD 337615.5 thousand thousand during 2026-2030.

The Flexible Hybrid Electronics market is expected to grow at a CAGR of 22.7% during 2026-2030.

Flexible Hybrid Electronics market is segmented by End-user (Consumer electronics, Automotive, Medical and healthcare, Energy and power, Others) Component (Display, Sensors, Power sources, Memory devices, Others) Application (Medical devices, Wearables, IoT devices, Smart packaging, Others)

Agfa Gevaert NV, Blue Spark Technologies Inc., Brewer Science Inc., DuPont de Nemours Inc., E Ink Holdings Inc., Flex Ltd., Henkel AG and Co. KGaA, Jabil Inc., LG Display Co. Ltd., Molex LLC, Murata Manufacturing Co. Ltd., Panasonic Holdings Corp., Samsung Electronics Co. Ltd., Schreiner Group GmbH and Co. KG, STMicroelectronics NV, TDK Corp., TE Connectivity plc, Wurth Elektronik GmbH and Co. KG, Ynvisible Interactive Inc. are a few of the key vendors in the Flexible Hybrid Electronics market.

North America will register the highest growth rate of 38.2% among the other regions. Therefore, the Flexible Hybrid Electronics market in North America is expected to garner significant business opportunities for the vendors during the forecast period.

US, Canada, Mexico, China, Japan, India, South Korea, Australia, Indonesia, Germany, UK, France, Italy, Spain, The Netherlands, Brazil, Argentina, Chile, Saudi Arabia, UAE, South Africa, Israel, Turkey

  • Growth of wearable medical devices is the driving factor this market.

The Flexible Hybrid Electronics market vendors should focus on grabbing business opportunities from the End-user segment as it accounted for the largest market share in the base year.
RIA - Research AI Assistant
Ask RIA
