Floating Production Storage and Offloading Market Analysis South America, Middle East and Africa, APAC, Europe, North America - Angola, Nigeria, China, UK, Brazil - Size and Forecast 2024-2028

Floating Production Storage and Offloading Market Analysis South America, Middle East and Africa, APAC, Europe, North America - Angola, Nigeria, China, UK, Brazil - Size and Forecast 2024-2028

Published: Feb 2024 156 Pages SKU: IRTNTR77574

Market Overview at a Glance

$8.58 B
Market Opportunity
6.34%
CAGR
5.56
YoY growth 2023-2024(%)

Floating Production Storage and Offloading Market Size 2024-2028 

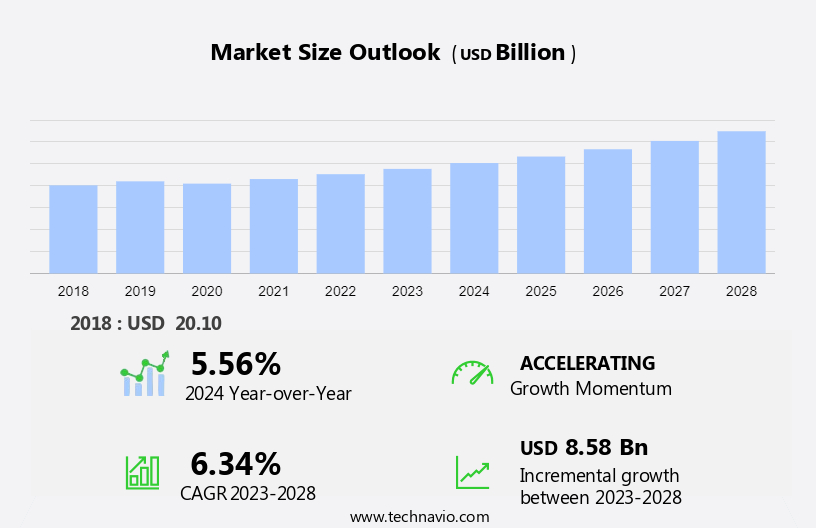
The floating production storage and offloading market size is forecast to increase by USD 8.58 billion at a CAGR of 6.34% between 2023 and 2028.

  • The Floating Production Storage and Offloading (FPSO) market is experiencing significant growth due to key drivers such as increasing investments in offshore exploration and production (E&P) activities and the rise in deepwater and ultra-deepwater projects. These trends are being fueled by the need to access increasingly difficult-to-reach reserves. The market is driven by the rise in deepwater and ultra-deepwater projects, which require advanced FPSO vessels equipped with settling tanks, crude oil tanks, ballast tanks, slop tanks, methanol tanks, and utility tanks.
  • Despite the volatility in crude oil prices, which can affect the supply of oil and gas, the FPSO market is still expected to grow. Companies are increasingly looking for innovative solutions to optimize offshore resource production. With technological advancements and a stronger focus on sustainable energy, the market's future remains promising, offering new opportunities for growth.

What will be the Floating Production Storage and Offloading Market Size During the Forecast Period?

Floating Production Storage and Offloading Market Size

 Request Free Sample

  • The floating production storage and offloading (FPSO) market encompasses the use of specialized vessels that process and store hydrocarbons from marginal fields, which are often located in deep waters or remote locations where traditional onshore facilities are not feasible. These fields may include subsea wells, which require the use of separation facilities to extract crude oil and natural gas from the produced fluids. FPSOs typically feature oil storage tanks, such as crude oil tanks, ballast tanks, slop tanks, methanol tanks, and utility tanks, that provide the necessary capacity to store and transport the extracted hydrocarbons. The design of these tanks is crucial, with considerations given to tank internals, intakes, and structural voids to ensure optimal performance and safety.
  • Additionally, the offloading process involves transferring the stored hydrocarbons to an oil tanker or LNG carrier for further transportation to refineries or markets. This process is carried out using flexible production tubes and spread mooring systems, which allow the FPSO to remain in place while the transfer takes place. Environmental limits play a significant role in the FPSO market, with stringent regulations governing the design and operation of these vessels to minimize their environmental impact. Dry dock inspections and maintenance are essential to ensure the structural integrity and efficient operation of the FPSO's tanks and systems. In summary, the FPSO market offers a cost-effective and efficient solution for producing and transporting hydrocarbons from marginal fields. The design and operation of these vessels require careful consideration of tank design, tank internals, and environmental regulations to ensure safe and sustainable production.

How is this market segmented and which is the largest segment?

The market research report provides comprehensive data (region-wise segment analysis), with forecasts and estimates in "USD billion" for the period 2024-2028, as well as historical data from 2018-2022 for the following segments.
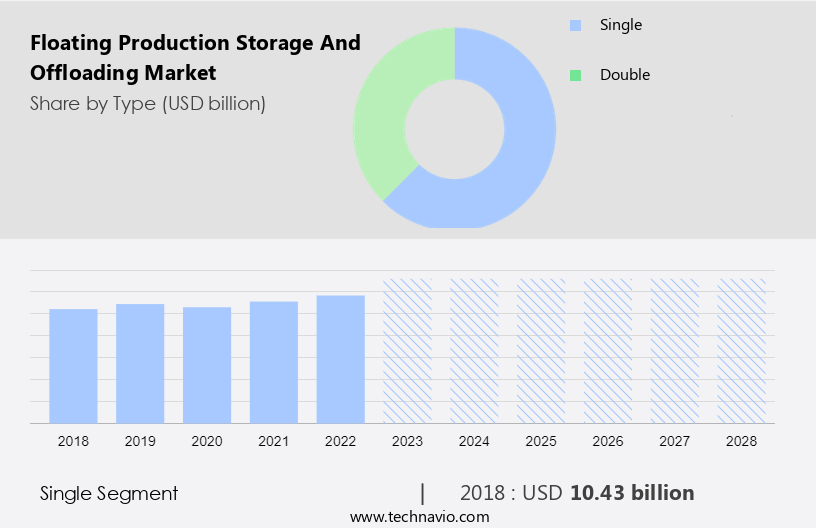
  • Type
    • Single
    • Double
  • Product Type
    • Converted
    • Newly built
  • Geography
    • South America
      • Brazil
    • Middle East and Africa
      • Nigeria
    • APAC
      • China
    • Europe
      • UK
    • North America

By Type Insights

  • The single segment is estimated to witness significant growth during the forecast period.

Floating Production Storage and Offloading (FPSO) involves converting existing transportation vessels, such as tankers or bulk carriers, into production units. This cost-effective solution reduces the capital expenditure required compared to designing and constructing a new FPSO, which can reach up to a billion US dollars for the same capacity. The benefits of using converted FPSOs include lower costs and the ability to produce hydrocarbons from sub-sea oil wells in shallow fields. These vessels can be used for the storage, transportation, and processing of hydrocarbons, eliminating the need for pipelines in certain situations. Converting a tanker into an FPSO requires minimal modifications, making it a practical solution for oil and gas companies. This cost-effective and efficient method is a valuable asset in the energy sector, particularly for producing hydrocarbons from sub-sea oil wells in shallow fields where pipelines are not feasible.

Floating Production Storage and Offloading Market Size

Get a glance at the market report of share of various segments Request Free Sample

The single segment was valued at USD 10.43 billion in 2018 and showed a gradual increase during the forecast period.

Regional Analysis

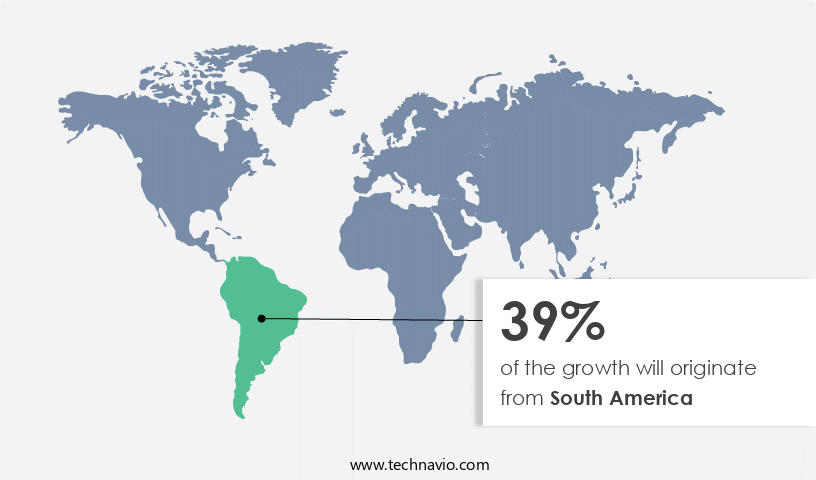
  • South America is estimated to contribute 39% to the growth of the global market during the forecast period.

Technavio's analysts have elaborately explained the regional trends and drivers that shape the market during the forecast period.

Floating Production Storage and Offloading Market Share by Geography

For more insights on the market share of various regions, Request Free Sample

The Floating Production Storage and Offloading (FPSO) market in South America is poised for growth due to increasing investments in the upstream oil and gas sector. The Brazilian government's commitment to spend USD 5.4 billion on oil and gas exploration activities from 2024 to 2030 is expected to boost E and P activities, leading to an increase in crude oil and natural gas production. This surge in production will necessitate expansions to the pipeline network to transport refined products and crude oil to consumers, thereby fueling demand for FPSOs. 

Market Dynamics

Our researchers analyzed the data with 2023 as the base year, along with the key drivers, trends, and challenges. A holistic analysis of drivers will help companies refine their marketing strategies to gain a competitive advantage.

What are the key market drivers leading to the rise in adoption of Floating Production Storage and Offloading Market?

Increasing investments in offshore E&P activities is the key driver of the market.

  • The Floating Production Storage and Offloading (FPSO) market is experiencing significant growth due to the increasing exploration and production (E&P) activities in offshore oil and gas fields. With the depletion of easily accessible onshore resources, oil and gas companies are turning to less explored areas, leading to an increase in FPSO demand. Moreover, rising global crude oil prices are making offshore drilling more economically viable, further boosting FPSO market growth. Several countries are planning to commence production from new oil and gas fields, contributing to market expansion. FPSOs provide an effective solution for producing and storing hydrocarbons from subsea wells, reducing the need for costly onshore facilities.
  • Additionally, these vessels offer flexibility in terms of location, allowing production from marginal fields and shallow fields that may not be economically viable through traditional methods. FPSOs consist of a floating vessel, processing equipment, separation facilities, and various tanks such as crude oil tanks, ballast tanks, slop tanks, methanol tanks, utility tanks, and settling tanks. They also include intakes, oil separators, seawater treatment, gas dehydration, and gas compression systems. FPSOs can be connected to subsea oil wells via a pipeline or directly transferred to an oil tanker. The market dynamics of FPSO are influenced by factors such as environmental limits, oilfield infrastructure, and transportation requirements.
  • In conclusion, FPSOs offer environmental benefits by reducing the need for extensive onshore infrastructure and the associated emissions. Additionally, they provide accommodation facilities for personnel working on offshore installations. FPSOs are essential for the production and offloading of hydrocarbons from subsea wells in deepwater and remote locations. Their flexibility, efficiency, and ability to handle various hydrocarbon mixtures make them an attractive solution for oil and gas companies looking to maximize production from offshore fields.

What are the market trends shaping the Floating Production Storage and Offloading Market?

An increase in deepwater and ultra-deepwater projects is the upcoming trend in the market.

  • The Floating Production Storage and Offloading (FPSO) market has gained significant traction in the oil and gas industry due to the increasing focus on marginal fields and the exploration of deep and ultra-deep waters. FPSOs offer a cost-effective solution for producing oil and gas from subsea wells, particularly in areas where pipelines to onshore facilities are not feasible or economically viable. These floating vessels are equipped with separation facilities, including oil separators, gas dehydration units, and seawater treatment systems, to process hydrocarbons before storing them in crude oil tanks, ballast tanks, slop tanks, methanol tanks, utility tanks, and structural voids. FPSOs are designed to operate in harsh sea conditions and can be moored using spread mooring systems or docked in dry docks for maintenance. The flexibility of FPSOs allows for the production of hydrocarbons from subsea oil wells and the offloading of crude oil to oil tankers or pipelines for transportation to refineries.
  • Additionally, the market for FPSOs is expected to grow as oil and gas companies continue to explore deeper waters and seek to maximize production from marginal fields. Deepwater projects require substantial investments and time compared to shallow water or onshore projects. However, advancements in processing equipment and technology have made it possible to access previously inaccessible areas. FPSOs offer a mobile offshore production solution that eliminates the need for long-distance pipelines, reducing transportation costs and environmental impact. The market for FPSOs is expected to continue growing as companies seek to optimize production and reduce costs in the oilfield.

What challenges does Floating Production Storage and Offloading Market face during the growth?

Volatility in crude oil prices restraining oil and gas supply is a key challenge affecting the market growth.

  • The Floating Production Storage and Offloading (FPSO) market encompasses the use of floating vessels for the production, processing, and offloading of hydrocarbons from marginal fields, including subsea wells. FPSOs integrate onshore facilities such as separation facilities and oil storage tanks onboard, enabling the production of oil and gas from sub-sea oil wells. These vessels feature flexible production tubes, spread moorings, and structural voids for settling tanks, crude oil tanks, ballast tanks, slop tanks, methanol tanks, utility tanks, and intakes for seawater treatment and oil separation.
  • However, FPSOs provide flexibility for oilfield development in shallow fields and deepwater areas, allowing for the transportation of hydrocarbons via pipeline or oil tanker. Environmental limits dictate the design and internals of these tanks, including the implementation of gas dehydration, gas compression, water injection, and seawater treatment systems. FPSOs serve as mobile offshore production units, accommodating processing equipment and living quarters for personnel. Despite fluctuations in crude oil prices, the FPSO market continues to grow, providing essential solutions for the production and offloading of hydrocarbons in the oil and gas industry.

Exclusive Customer Landscape

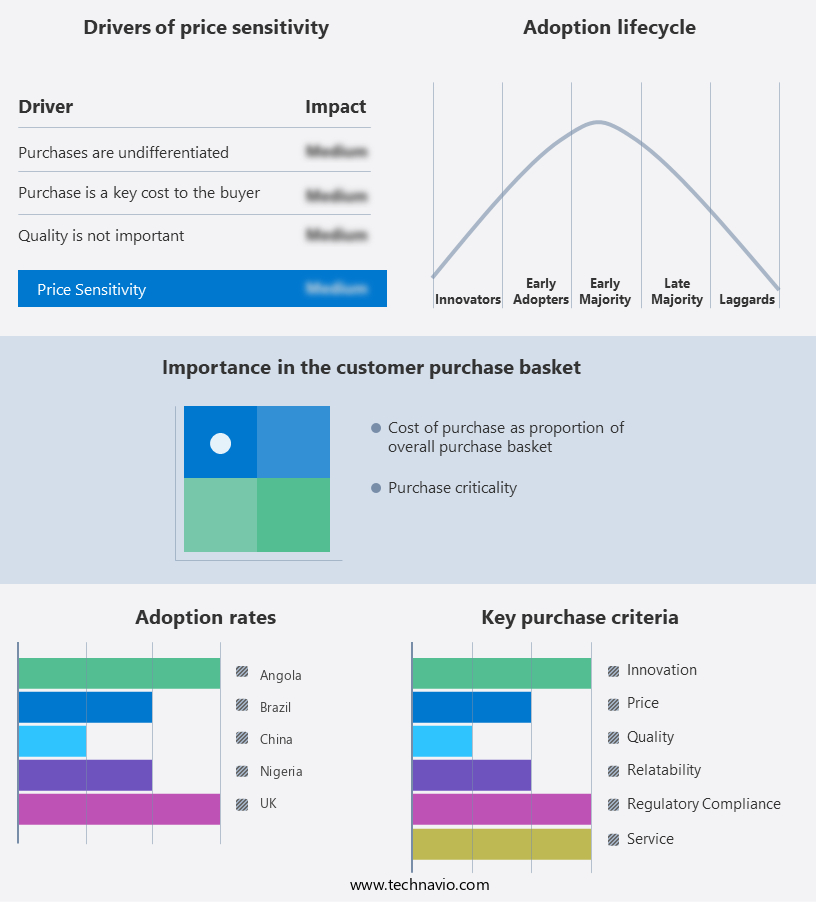
The market forecasting report includes the adoption lifecycle of the market, covering from the innovator's stage to the laggard's stage. It focuses on adoption rates in different regions based on penetration. Furthermore, the market report also includes key purchase criteria and drivers of price sensitivity to help companies evaluate and develop their market growth analysis strategies.

Floating Production Storage and Offloading Market Share by Geography

 Customer Landscape

Key Companies & Market Insights

Companies are implementing various strategies, such as strategic alliances, market forecast, partnerships, mergers and acquisitions, geographical expansion, and product/service launches, to enhance their presence in the market. The market research and growth report includes detailed analyses of the competitive landscape of the market and information about key companies, including:

  • BUMI ARMADA BERHAD
  • Bluewater Energy Services BV
  • BP Plc
  • BW Offshore Ltd.
  • Chevron Corp.
  • China National Offshore Oil Corp.
  • Exxon Mobil Corp.
  • Hyundai Heavy Industries Co. Ltd.
  • Mitsubishi Heavy Industries Ltd.
  • MODEC Inc.
  • Petroleo Brasileiro SA
  • Saipem S.p.A.
  • SBM Offshore NV
  • Shell plc
  • TechnipFMC plc
  • TotalEnergies SE
  • Vietnam Oil and Gas Group
  • Woodside Energy Group Ltd.
  • Yinson Holdings Berhad

Qualitative and quantitative analysis of companies has been conducted to help clients understand the wider business environment as well as the strengths and weaknesses of key market players. Data is qualitatively analyzed to categorize companies as pure play, category-focused, industry-focused, and diversified; it is quantitatively analyzed to categorize companies as dominant, leading, strong, tentative, and weak.

Research Analyst Overview

The floating production storage and offloading (FPSO) market represents a significant advancement in the oil and gas industry, enabling the exploitation of marginal fields that were once deemed uneconomical. This technology combines production, processing, and storage capabilities on a floating vessel, reducing the need for costly onshore facilities. FPSOs are designed to operate in various environments, from shallow waters to deep-sea locations. They can be utilized for both oil and liquefied natural gas (LNG) production. The process begins with the extraction of hydrocarbons from subsea wells, which are transported through flexible production tubes to the FPSO's separation facilities. The separation facilities onboard the FPSO are responsible for processing crude oil and separating it from water, gas, and other impurities. This is crucial to ensure the quality of the final product and minimize environmental impacts. The processed oil is then stored in crude oil tanks, while water and gas are disposed of or re-injected into the reservoir. Ballast tanks are an essential component of FPSO design, as they allow the vessel to maintain its stability during production and offloading operations.

Additionally, these tanks can also be used for storing water, slop, and methanol, among other substances. Utility tanks provide the FPSO with essential services, such as water treatment, gas dehydration, and gas compression. FPSOs are typically moored using spread mooring systems, which consist of multiple anchors and tether lines. This design ensures the stability of the vessel in harsh marine conditions. The offloading process involves transferring the hydrocarbons to an oil tanker or, in the case of LNG, to a pipeline for further transportation. The flexibility of FPSOs makes them an attractive solution for oilfields located in remote or challenging environments. They can be deployed in areas with limited infrastructure, reducing the need for extensive onshore facilities. Moreover, FPSOs can be re-deployed to different fields, making them a cost-effective solution for oilfield operators.

In summary, mobile offshore production platforms, including FPSOs, have revolutionized the oil and gas industry by enabling the exploitation of marginal fields that were once inaccessible. These platforms offer numerous advantages, including reduced costs, increased efficiency, and improved environmental performance. The FPSO market is expected to continue growing, driven by the increasing demand for energy and the need to extract hydrocarbons from increasingly complex reservoirs. In conclusion, the market plays a vital role in the oil and gas industry by providing a cost-effective and efficient solution for the production, processing, and storage of hydrocarbons. FPSOs offer numerous benefits, including flexibility, environmental performance, and reduced infrastructure requirements, making them an attractive solution for oilfield operators in various environments.

Market Scope

Report Coverage

Details

Page number

156

Base year

2023

Historic period

2018-2022

Forecast period

2024-2028

Growth momentum & CAGR

Accelerate at a CAGR of 6.34%

Market growth 2024-2028

USD 8.58 billion

Market structure

Fragmented

YoY growth 2023-2024(%)

5.56

Key countries

Angola, Nigeria, China, UK, and Brazil

Competitive landscape

Leading Companies, Market Positioning of Companies, Competitive Strategies, and Industry Risks

Request Free Sample

What are the Key Data Covered in this Market Research and Growth Report?

  • CAGR of the market during the forecast period
  • Detailed information on factors that will drive the market growth and forecasting between 2024 and 2028
  • Precise estimation of the size of the market  and its contribution of the market in focus to the parent market
  • Accurate predictions about upcoming market growth and trends and changes in consumer behaviour
  • Growth of the market across South America, Middle East and Africa, APAC, Europe, and North America
  • Thorough analysis of the market's competitive landscape and detailed information about companies
  • Comprehensive analysis of factors that will challenge the growth of market companies

We can help! Our analysts can customize this market research report to meet your requirements. Get in touch

1 Executive Summary

  • 1.1 Market overview
    • Exhibit 01: Executive Summary – Chart on Market Overview
    • Exhibit 02: Executive Summary – Data Table on Market Overview
    • Exhibit 03: Executive Summary – Chart on Global Market Characteristics
    • Exhibit 04: Executive Summary – Chart on Market by Geography
    • Exhibit 05: Executive Summary – Chart on Market Segmentation by Type
    • Exhibit 06: Executive Summary – Chart on Market Segmentation by Product Type
    • Exhibit 07: Executive Summary – Chart on Incremental Growth
    • Exhibit 08: Executive Summary – Data Table on Incremental Growth
    • Exhibit 09: Executive Summary – Chart on Vendor Market Positioning

2 Market Landscape

  • 2.1 Market ecosystem
    • Exhibit 10: Parent market
    • Exhibit 11: Market Characteristics

3 Market Sizing

  • 3.1 Market definition
    • Exhibit 12: Offerings of vendors included in the market definition
  • 3.2 Market segment analysis
    • Exhibit 13: Market segments
  • 3.3 Market size 2023
    • 3.4 Market outlook: Forecast for 2023-2028
      • Exhibit 14: Chart on Global - Market size and forecast 2023-2028 ($ billion)
      • Exhibit 15: Data Table on Global - Market size and forecast 2023-2028 ($ billion)
      • Exhibit 16: Chart on Global Market: Year-over-year growth 2023-2028 (%)
      • Exhibit 17: Data Table on Global Market: Year-over-year growth 2023-2028 (%)

    4 Historic Market Size

    • 4.1 Global floating production storage and offloading market 2018 - 2022
      • Exhibit 18: Historic Market Size – Data Table on global floating production storage and offloading market 2018 - 2022 ($ billion)
    • 4.2 Type Segment Analysis 2018 - 2022
      • Exhibit 19: Historic Market Size – Type Segment 2018 - 2022 ($ billion)
    • 4.3 Product Type Segment Analysis 2018 - 2022
      • Exhibit 20: Historic Market Size – Product Type Segment 2018 - 2022 ($ billion)
    • 4.4 Geography Segment Analysis 2018 - 2022
      • Exhibit 21: Historic Market Size – Geography Segment 2018 - 2022 ($ billion)
    • 4.5 Country Segment Analysis 2018 - 2022
      • Exhibit 22: Historic Market Size – Country Segment 2018 - 2022 ($ billion)

    5 Five Forces Analysis

    • 5.1 Five forces summary
      • Exhibit 23: Five forces analysis - Comparison between 2023 and 2028
    • 5.2 Bargaining power of buyers
      • Exhibit 24: Chart on Bargaining power of buyers – Impact of key factors 2023 and 2028
    • 5.3 Bargaining power of suppliers
      • Exhibit 25: Bargaining power of suppliers – Impact of key factors in 2023 and 2028
    • 5.4 Threat of new entrants
      • Exhibit 26: Threat of new entrants – Impact of key factors in 2023 and 2028
    • 5.5 Threat of substitutes
      • Exhibit 27: Threat of substitutes – Impact of key factors in 2023 and 2028
    • 5.6 Threat of rivalry
      • Exhibit 28: Threat of rivalry – Impact of key factors in 2023 and 2028
    • 5.7 Market condition
      • Exhibit 29: Chart on Market condition - Five forces 2023 and 2028

    6 Market Segmentation by Type

    • 6.1 Market segments
      • Exhibit 30: Chart on Type - Market share 2023-2028 (%)
      • Exhibit 31: Data Table on Type - Market share 2023-2028 (%)
    • 6.2 Comparison by Type
      • Exhibit 32: Chart on Comparison by Type
      • Exhibit 33: Data Table on Comparison by Type
    • 6.3 Single - Market size and forecast 2023-2028
      • Exhibit 34: Chart on Single - Market size and forecast 2023-2028 ($ billion)
      • Exhibit 35: Data Table on Single - Market size and forecast 2023-2028 ($ billion)
      • Exhibit 36: Chart on Single - Year-over-year growth 2023-2028 (%)
      • Exhibit 37: Data Table on Single - Year-over-year growth 2023-2028 (%)
    • 6.4 Double - Market size and forecast 2023-2028
      • Exhibit 38: Chart on Double - Market size and forecast 2023-2028 ($ billion)
      • Exhibit 39: Data Table on Double - Market size and forecast 2023-2028 ($ billion)
      • Exhibit 40: Chart on Double - Year-over-year growth 2023-2028 (%)
      • Exhibit 41: Data Table on Double - Year-over-year growth 2023-2028 (%)
    • 6.5 Market opportunity by Type
      • Exhibit 42: Market opportunity by Type ($ billion)
      • Exhibit 43: Data Table on Market opportunity by Type ($ billion)

    7 Market Segmentation by Product Type

    • 7.1 Market segments
      • Exhibit 44: Chart on Product Type - Market share 2023-2028 (%)
      • Exhibit 45: Data Table on Product Type - Market share 2023-2028 (%)
    • 7.2 Comparison by Product Type
      • Exhibit 46: Chart on Comparison by Product Type
      • Exhibit 47: Data Table on Comparison by Product Type
    • 7.3 Converted - Market size and forecast 2023-2028
      • Exhibit 48: Chart on Converted - Market size and forecast 2023-2028 ($ billion)
      • Exhibit 49: Data Table on Converted - Market size and forecast 2023-2028 ($ billion)
      • Exhibit 50: Chart on Converted - Year-over-year growth 2023-2028 (%)
      • Exhibit 51: Data Table on Converted - Year-over-year growth 2023-2028 (%)
    • 7.4 Newly built - Market size and forecast 2023-2028
      • Exhibit 52: Chart on Newly built - Market size and forecast 2023-2028 ($ billion)
      • Exhibit 53: Data Table on Newly built - Market size and forecast 2023-2028 ($ billion)
      • Exhibit 54: Chart on Newly built - Year-over-year growth 2023-2028 (%)
      • Exhibit 55: Data Table on Newly built - Year-over-year growth 2023-2028 (%)
    • 7.5 Market opportunity by Product Type
      • Exhibit 56: Market opportunity by Product Type ($ billion)
      • Exhibit 57: Data Table on Market opportunity by Product Type ($ billion)

    8 Customer Landscape

    • 8.1 Customer landscape overview
      • Exhibit 58: Analysis of price sensitivity, lifecycle, customer purchase basket, adoption rates, and purchase criteria

    9 Geographic Landscape

    • 9.1 Geographic segmentation
      • Exhibit 59: Chart on Market share by geography 2023-2028 (%)
      • Exhibit 60: Data Table on Market share by geography 2023-2028 (%)
    • 9.2 Geographic comparison
      • Exhibit 61: Chart on Geographic comparison
      • Exhibit 62: Data Table on Geographic comparison
    • 9.3 South America - Market size and forecast 2023-2028
      • Exhibit 63: Chart on South America - Market size and forecast 2023-2028 ($ billion)
      • Exhibit 64: Data Table on South America - Market size and forecast 2023-2028 ($ billion)
      • Exhibit 65: Chart on South America - Year-over-year growth 2023-2028 (%)
      • Exhibit 66: Data Table on South America - Year-over-year growth 2023-2028 (%)
    • 9.4 Middle East and Africa - Market size and forecast 2023-2028
      • Exhibit 67: Chart on Middle East and Africa - Market size and forecast 2023-2028 ($ billion)
      • Exhibit 68: Data Table on Middle East and Africa - Market size and forecast 2023-2028 ($ billion)
      • Exhibit 69: Chart on Middle East and Africa - Year-over-year growth 2023-2028 (%)
      • Exhibit 70: Data Table on Middle East and Africa - Year-over-year growth 2023-2028 (%)
    • 9.5 APAC - Market size and forecast 2023-2028
      • Exhibit 71: Chart on APAC - Market size and forecast 2023-2028 ($ billion)
      • Exhibit 72: Data Table on APAC - Market size and forecast 2023-2028 ($ billion)
      • Exhibit 73: Chart on APAC - Year-over-year growth 2023-2028 (%)
      • Exhibit 74: Data Table on APAC - Year-over-year growth 2023-2028 (%)
    • 9.6 Europe - Market size and forecast 2023-2028
      • Exhibit 75: Chart on Europe - Market size and forecast 2023-2028 ($ billion)
      • Exhibit 76: Data Table on Europe - Market size and forecast 2023-2028 ($ billion)
      • Exhibit 77: Chart on Europe - Year-over-year growth 2023-2028 (%)
      • Exhibit 78: Data Table on Europe - Year-over-year growth 2023-2028 (%)
    • 9.7 North America - Market size and forecast 2023-2028
      • Exhibit 79: Chart on North America - Market size and forecast 2023-2028 ($ billion)
      • Exhibit 80: Data Table on North America - Market size and forecast 2023-2028 ($ billion)
      • Exhibit 81: Chart on North America - Year-over-year growth 2023-2028 (%)
      • Exhibit 82: Data Table on North America - Year-over-year growth 2023-2028 (%)
    • 9.8 Brazil - Market size and forecast 2023-2028
      • Exhibit 83: Chart on Brazil - Market size and forecast 2023-2028 ($ billion)
      • Exhibit 84: Data Table on Brazil - Market size and forecast 2023-2028 ($ billion)
      • Exhibit 85: Chart on Brazil - Year-over-year growth 2023-2028 (%)
      • Exhibit 86: Data Table on Brazil - Year-over-year growth 2023-2028 (%)
    • 9.9 UK - Market size and forecast 2023-2028
      • Exhibit 87: Chart on UK - Market size and forecast 2023-2028 ($ billion)
      • Exhibit 88: Data Table on UK - Market size and forecast 2023-2028 ($ billion)
      • Exhibit 89: Chart on UK - Year-over-year growth 2023-2028 (%)
      • Exhibit 90: Data Table on UK - Year-over-year growth 2023-2028 (%)
    • 9.10 Angola - Market size and forecast 2023-2028
      • Exhibit 91: Chart on Angola - Market size and forecast 2023-2028 ($ billion)
      • Exhibit 92: Data Table on Angola - Market size and forecast 2023-2028 ($ billion)
      • Exhibit 93: Chart on Angola - Year-over-year growth 2023-2028 (%)
      • Exhibit 94: Data Table on Angola - Year-over-year growth 2023-2028 (%)
    • 9.11 Nigeria - Market size and forecast 2023-2028
      • Exhibit 95: Chart on Nigeria - Market size and forecast 2023-2028 ($ billion)
      • Exhibit 96: Data Table on Nigeria - Market size and forecast 2023-2028 ($ billion)
      • Exhibit 97: Chart on Nigeria - Year-over-year growth 2023-2028 (%)
      • Exhibit 98: Data Table on Nigeria - Year-over-year growth 2023-2028 (%)
    • 9.12 China - Market size and forecast 2023-2028
      • Exhibit 99: Chart on China - Market size and forecast 2023-2028 ($ billion)
      • Exhibit 100: Data Table on China - Market size and forecast 2023-2028 ($ billion)
      • Exhibit 101: Chart on China - Year-over-year growth 2023-2028 (%)
      • Exhibit 102: Data Table on China - Year-over-year growth 2023-2028 (%)
    • 9.13 Market opportunity by geography
      • Exhibit 103: Market opportunity by geography ($ billion)
      • Exhibit 104: Data Tables on Market opportunity by geography ($ billion)

    10 Drivers, Challenges, and Trends

    • 10.1 Market drivers
      • 10.2 Market challenges
        • 10.3 Impact of drivers and challenges
          • Exhibit 105: Impact of drivers and challenges in 2023 and 2028
        • 10.4 Market trends

          11 Vendor Landscape

          • 11.1 Overview
            • 11.2 Vendor landscape
              • Exhibit 106: Overview on Criticality of inputs and Factors of differentiation
            • 11.3 Landscape disruption
              • Exhibit 107: Overview on factors of disruption
            • 11.4 Industry risks
              • Exhibit 108: Impact of key risks on business

            12 Vendor Analysis

            • 12.1 Vendors covered
              • Exhibit 109: Vendors covered
            • 12.2 Market positioning of vendors
              • Exhibit 110: Matrix on vendor position and classification
            • 12.3 BUMI ARMADA BERHAD
              • Exhibit 111: BUMI ARMADA BERHAD - Overview
              • Exhibit 112: BUMI ARMADA BERHAD - Business segments
              • Exhibit 113: BUMI ARMADA BERHAD - Key offerings
              • Exhibit 114: BUMI ARMADA BERHAD - Segment focus
            • 12.4 Bluewater Energy Services BV
              • Exhibit 115: Bluewater Energy Services BV - Overview
              • Exhibit 116: Bluewater Energy Services BV - Product / Service
              • Exhibit 117: Bluewater Energy Services BV - Key offerings
            • 12.5 BP Plc
              • Exhibit 118: BP Plc - Overview
              • Exhibit 119: BP Plc - Business segments
              • Exhibit 120: BP Plc - Key news
              • Exhibit 121: BP Plc - Key offerings
              • Exhibit 122: BP Plc - Segment focus
            • 12.6 BW Offshore Ltd.
              • Exhibit 123: BW Offshore Ltd. - Overview
              • Exhibit 124: BW Offshore Ltd. - Business segments
              • Exhibit 125: BW Offshore Ltd. - Key offerings
              • Exhibit 126: BW Offshore Ltd. - Segment focus
            • 12.7 Chevron Corp.
              • Exhibit 127: Chevron Corp. - Overview
              • Exhibit 128: Chevron Corp. - Business segments
              • Exhibit 129: Chevron Corp. - Key news
              • Exhibit 130: Chevron Corp. - Key offerings
              • Exhibit 131: Chevron Corp. - Segment focus
            • 12.8 Exxon Mobil Corp.
              • Exhibit 132: Exxon Mobil Corp. - Overview
              • Exhibit 133: Exxon Mobil Corp. - Business segments
              • Exhibit 134: Exxon Mobil Corp. - Key news
              • Exhibit 135: Exxon Mobil Corp. - Key offerings
              • Exhibit 136: Exxon Mobil Corp. - Segment focus
            • 12.9 Mitsubishi Heavy Industries Ltd.
              • Exhibit 137: Mitsubishi Heavy Industries Ltd. - Overview
              • Exhibit 138: Mitsubishi Heavy Industries Ltd. - Business segments
              • Exhibit 139: Mitsubishi Heavy Industries Ltd. - Key news
              • Exhibit 140: Mitsubishi Heavy Industries Ltd. - Key offerings
              • Exhibit 141: Mitsubishi Heavy Industries Ltd. - Segment focus
            • 12.10 MODEC Inc.
              • Exhibit 142: MODEC Inc. - Overview
              • Exhibit 143: MODEC Inc. - Product / Service
              • Exhibit 144: MODEC Inc. - Key offerings
            • 12.11 Petroleo Brasileiro SA
              • Exhibit 145: Petroleo Brasileiro SA - Overview
              • Exhibit 146: Petroleo Brasileiro SA - Business segments
              • Exhibit 147: Petroleo Brasileiro SA - Key offerings
              • Exhibit 148: Petroleo Brasileiro SA - Segment focus
            • 12.12 SBM Offshore NV
              • Exhibit 149: SBM Offshore NV - Overview
              • Exhibit 150: SBM Offshore NV - Business segments
              • Exhibit 151: SBM Offshore NV - Key offerings
              • Exhibit 152: SBM Offshore NV - Segment focus
            • 12.13 Shell plc
              • Exhibit 153: Shell plc - Overview
              • Exhibit 154: Shell plc - Business segments
              • Exhibit 155: Shell plc - Key offerings
              • Exhibit 156: Shell plc - Segment focus
            • 12.14 TechnipFMC plc
              • Exhibit 157: TechnipFMC plc - Overview
              • Exhibit 158: TechnipFMC plc - Business segments
              • Exhibit 159: TechnipFMC plc - Key news
              • Exhibit 160: TechnipFMC plc - Key offerings
              • Exhibit 161: TechnipFMC plc - Segment focus
            • 12.15 TotalEnergies SE
              • Exhibit 162: TotalEnergies SE - Overview
              • Exhibit 163: TotalEnergies SE - Business segments
              • Exhibit 164: TotalEnergies SE - Key news
              • Exhibit 165: TotalEnergies SE - Key offerings
              • Exhibit 166: TotalEnergies SE - Segment focus
            • 12.16 Woodside Energy Group Ltd.
              • Exhibit 167: Woodside Energy Group Ltd. - Overview
              • Exhibit 168: Woodside Energy Group Ltd. - Key offerings
            • 12.17 Yinson Holdings Berhad
              • Exhibit 169: Yinson Holdings Berhad - Overview
              • Exhibit 170: Yinson Holdings Berhad - Business segments
              • Exhibit 171: Yinson Holdings Berhad - Key offerings
              • Exhibit 172: Yinson Holdings Berhad - Segment focus

            13 Appendix

            • 13.1 Scope of the report
              • 13.2 Inclusions and exclusions checklist
                • Exhibit 173: Inclusions checklist
                • Exhibit 174: Exclusions checklist
              • 13.3 Currency conversion rates for US$
                • Exhibit 175: Currency conversion rates for US$
              • 13.4 Research methodology
                • Exhibit 176: Research methodology
                • Exhibit 177: Validation techniques employed for market sizing
                • Exhibit 178: Information sources
              • 13.5 List of abbreviations
                • Exhibit 179: List of abbreviations

              Research Methodology

              Technavio presents a detailed picture of the market by way of study, synthesis, and summation of data from multiple sources. The analysts have presented the various facets of the market with a particular focus on identifying the key industry influencers. The data thus presented is comprehensive, reliable, and the result of extensive research, both primary and secondary.

              INFORMATION SOURCES

              Primary sources

              • Manufacturers and suppliers
              • Channel partners
              • Industry experts
              • Strategic decision makers

              Secondary sources

              • Industry journals and periodicals
              • Government data
              • Financial reports of key industry players
              • Historical data
              • Press releases

              DATA ANALYSIS

              Data Synthesis

              • Collation of data
              • Estimation of key figures
              • Analysis of derived insights

              Data Validation

              • Triangulation with data models
              • Reference against proprietary databases
              • Corroboration with industry experts

              REPORT WRITING

              Qualitative

              • Market drivers
              • Market challenges
              • Market trends
              • Five forces analysis

              Quantitative

              • Market size and forecast
              • Market segmentation
              • Geographical insights
              • Competitive landscape

              Interested in this report?

              Get your sample now to see our research methodology and insights!

              Download Now

              Frequently Asked Questions

              Floating Production Storage and Offloading market growth will increase by $ 8.58 bn during 2024-2028 .

              The Floating Production Storage and Offloading market is expected to grow at a CAGR of 6.34% during 2024-2028 .

              Floating Production Storage and Offloading market is segmented by Type( Single, Double) Product Type( Converted, Newly built)

              BUMI ARMADA BERHAD, Bluewater Energy Services BV, BP Plc, BW Offshore Ltd., Chevron Corp., China National Offshore Oil Corp., Exxon Mobil Corp., Hyundai Heavy Industries Co. Ltd., Mitsubishi Heavy Industries Ltd., MODEC Inc., Petroleo Brasileiro SA, Saipem S.p.A., SBM Offshore NV, Shell plc, TechnipFMC plc, TotalEnergies SE, Vietnam Oil and Gas Group, Woodside Energy Group Ltd., Yinson Holdings Berhad are a few of the key vendors in the Floating Production Storage and Offloading market.

              South America will register the highest growth rate of 39% among the other regions. Therefore, the Floating Production Storage and Offloading market in South America is expected to garner significant business opportunities for the vendors during the forecast period.

              Angola, Nigeria, China, UK, Brazil

              • Increasing investments in offshore E and P activitiesInvestments in offshore oil and gas activities are increasing globally. Moreover is the driving factor this market.
              • the depletion of oil and gas from easily accessible onshore locations is encouraging oil and gas E and P companies to look for less explored areas. Also is the driving factor this market.
              • increasing global crude oil prices are making the economics of offshore drilling more feasible is the driving factor this market.
              • thus resulting in an increase in offshore oil and gas E and P operations. This is expected to drive the demand for floating production storage and offloading during the forecast period. Several countries are planning to start production from oil and gas fields due to increasing oil and gas discovery. For instance is the driving factor this market.
              • in October 2023 is the driving factor this market.
              • Eni S.p.A. announced the gas discovery at Kutei Basin in Indonesia. Similarly is the driving factor this market.
              • in January 2022 is the driving factor this market.
              • US-based Exxon Mobil announced that it had made two oil discoveries at Fangtooth-1 and Lau Lau-1 in the Stabroek block offshore Guyana. Thus is the driving factor this market.
              • new oil and gas discoveries will enhance crude oil production. Therefore is the driving factor this market.
              • growing oil and gas E and P activities around the world will lead to an increase in oil and gas production from oil and gas fields. These production centers will require floating production storage and offloading for extraction of crude oil and natural gas from the processing facility to an onshore terminal. Thus is the driving factor this market.
              • a surge in E and P activities will spur the growth of the global floating production storage and offloading market during the forecast period. is the driving factor this market.

              The Floating Production Storage and Offloading market vendors should focus on grabbing business opportunities from the Single segment as it accounted for the largest market share in the base year.