Methanol Market Size 2025-2029
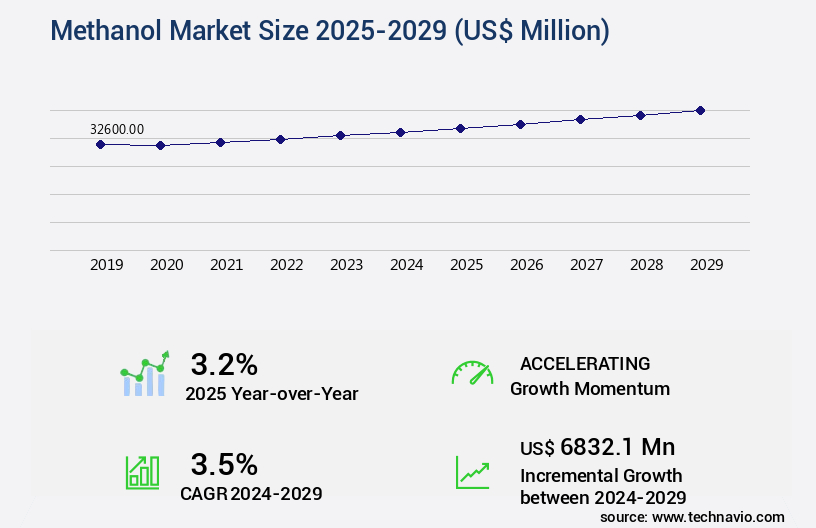
The methanol market size is valued to increase USD 6.83 billion, at a CAGR of 3.5% from 2024 to 2029. Rising demand for formaldehyde and its derivatives will drive the methanol market.
Major Market Trends & Insights
- APAC dominated the market and accounted for a 70% growth during the forecast period.
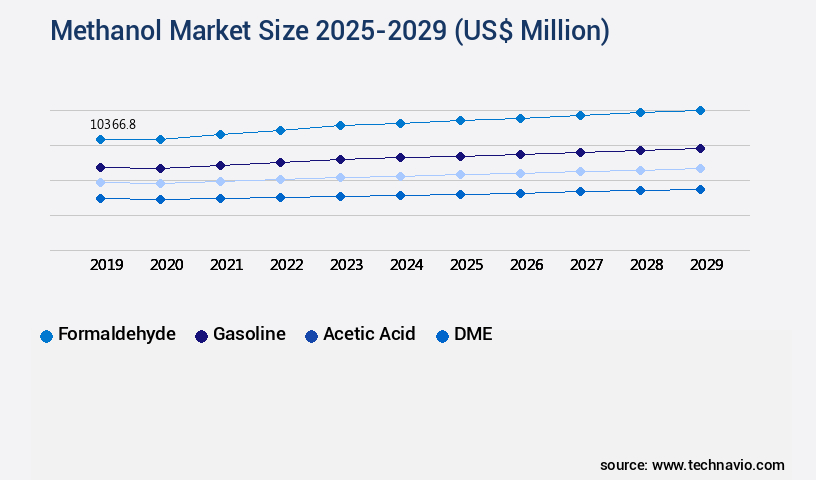
- By Derivative Type - Formaldehyde segment was valued at USD 10.37 billion in 2023
- By End-user - Automotive segment accounted for the largest market revenue share in 2023
Market Size & Forecast
- Market Opportunities: USD 33.23 million
- Market Future Opportunities: USD 6832.10 million
- CAGR : 3.5%
- APAC: Largest market in 2023
Market Summary
- The market represents a dynamic and continuously evolving industry, driven by the rising demand for formaldehyde and its derivatives in various applications. With a significant market share in the chemical industry, methanol is increasingly utilized in the production of resins, coatings, and other essential chemicals. However, the market landscape is influenced by various factors, including fluctuating methanol prices and regulatory requirements. For instance, according to recent reports, the global methanol capacity is expected to reach 120 million tons by 2027, growing at a steady pace due to increasing demand from the automotive and packaging industries. Despite these opportunities, challenges such as stringent regulations on methanol emissions and price volatility persist, necessitating innovative technologies and strategic partnerships to ensure market growth.
What will be the Size of the Methanol Market during the forecast period?
Get Key Insights on Market Forecast (PDF) Request Free Sample
How is the Methanol Market Segmented and what are the key trends of market segmentation?
The methanol industry research report provides comprehensive data (region-wise segment analysis), with forecasts and estimates in "USD million" for the period 2025-2029, as well as historical data from 2019-2023 for the following segments.
- Derivative Type
- Formaldehyde
- Gasoline
- Acetic acid
- DME
- Others
- End-user
- Automotive
- Construction
- Paints and coatings
- Electronics
- Others
- Feedstock
- Natural gas
- Coal
- Geography
- North America
- US
- Canada
- Europe
- Germany
- Russia
- Middle East and Africa
- Iran
- Oman
- APAC
- China
- India
- Indonesia
- Rest of World (ROW)
- North America
By Derivative Type Insights
The formaldehyde segment is estimated to witness significant growth during the forecast period.
Methanol, a vital chemical intermediate, plays a significant role in various industries due to its versatile applications. Approximately 35% of methanol production is dedicated to the synthesis of formaldehyde, which is further utilized in the manufacturing of resins and adhesives. These formaldehyde-based resins, including urea-formaldehyde, phenol-formaldehyde, and melamine-formaldehyde, are extensively used in the wood and furniture industry for producing plywood, particleboard, and engineered wood products. The construction sector also relies on these resins for insulation foam, laminates, and fiberboards, which are applied in flooring, wall panels, and ceilings. The automotive industry incorporates formaldehyde-based resins in manufacturing interior components like dashboards, door panels, and other trim parts.
The market exhibits a steady expansion, with current demand standing at around 50 million metric tons per annum. This growth can be attributed to the increasing adoption of methanol in the production of formaldehyde and its derivatives, particularly in the wood and furniture industry. Furthermore, the market is expected to witness a robust increase, with industry experts anticipating a growth of approximately 18% in demand over the next five years. Methanol production primarily involves catalytic conversion through steam reforming and methanol dehydration processes. Reactor design, process optimization, and yield improvement are crucial aspects of methanol synthesis. Distillation columns are employed to purify methanol, while methanol fuel cells and purification methods like carbon monoxide conversion and adsorption techniques ensure the production of high-quality methanol.
Methanol is also used as a fuel additive blend, with applications in the transportation sector. It is also employed in the production of acetic acid, solvents like dimethyl ether, and octane rating improvement for gasoline through the production of MTBE. Hydrogen production and energy density calculations are essential components of methanol's energy efficiency analysis. The market is further characterized by the ongoing development of environmental impact assessment and emission reduction technologies, ensuring safety protocols, and the increasing adoption of renewable methanol production through processes like carbon capture and utilization and biomass gasification. The energy efficiency of the gasification process is a critical factor in reducing the environmental impact of methanol production.
In conclusion, the market is a dynamic and evolving sector, with applications spanning various industries and continuous advancements in production technologies. The market's growth is driven by the increasing demand for formaldehyde and its derivatives, particularly in the wood and furniture industry, and the ongoing development of renewable methanol production processes.
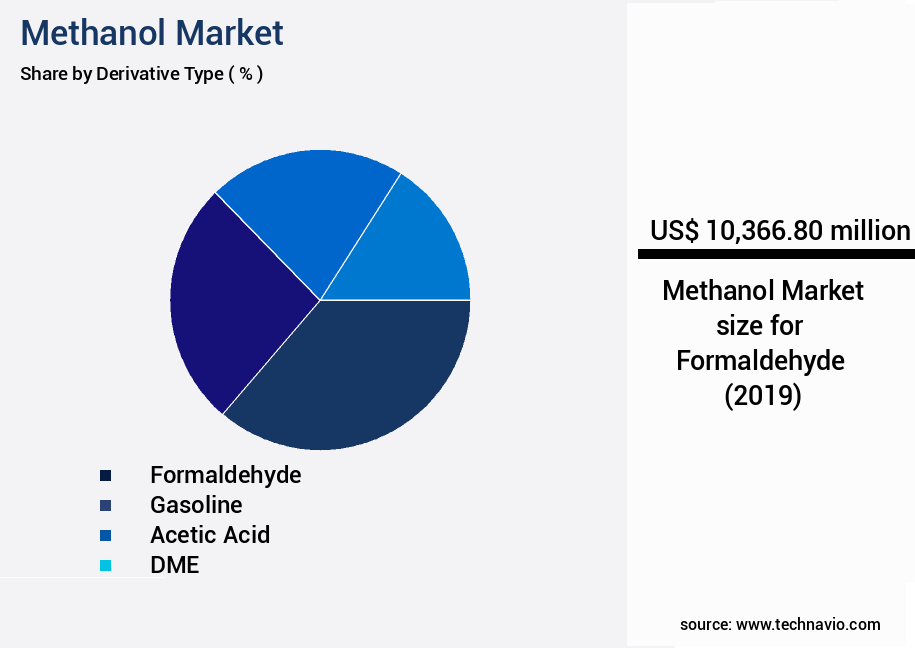
The Formaldehyde segment was valued at USD 10.37 billion in 2019 and showed a gradual increase during the forecast period.
Regional Analysis
APAC is estimated to contribute 70% to the growth of the global market during the forecast period.Technavio’s analysts have elaborately explained the regional trends and drivers that shape the market during the forecast period.

See How Methanol Market Demand is Rising in APAC Request Free Sample
The APAC region led The market in 2024, with a significant increase in demand for methanol and its derivatives. The construction, automotive, textile, and furniture industries in APAC are primary contributors to this growth. China, a key player in APAC, holds a substantial demand for methanol due to its energy and petrochemical sectors. The country's high demand for methanol-gasoline blends, used as transportation fuels, further boosts the market. According to recent reports, APAC's the market share is expected to expand further during the forecast period.
With the increasing adoption of methanol in various industries, the demand for methanol in APAC is growing at a faster pace than in Europe and North America. Approximately 55% of the global methanol production capacity is located in APAC, making it the dominant region in the market. Additionally, the region accounts for around 58% of the global methanol consumption.
Market Dynamics
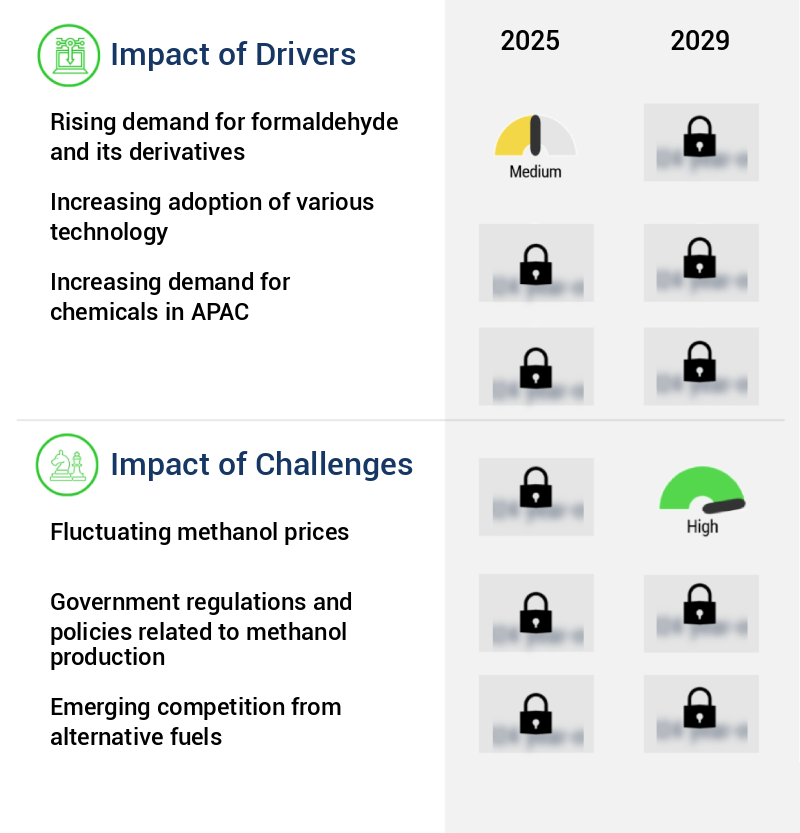
Our researchers analyzed the data with 2024 as the base year, along with the key drivers, trends, and challenges. A holistic analysis of drivers will help companies refine their marketing strategies to gain a competitive advantage.
The market encompasses the production, application, and innovation within this essential chemical industry. This report delves into the intricacies of methanol synthesis, focusing on advanced techniques and optimization strategies. Key production methods include catalytic conversion of natural gas and methanol production from biomass gasification. The report examines the impact of process parameters on methanol yield, with a particular focus on synthesis reactor design optimization. Methanol's versatility extends to its application in fuel cell technology, where its performance and durability are under constant scrutiny. The report explores the effect of catalyst properties on methanol synthesis and the environmental life cycle assessment of methanol production.
Innovative methods for methanol purification and improved cost-effective production techniques are also discussed. The development of novel methanol synthesis catalysts and methanol production from syngas using novel catalysts are highlighted. Advanced control strategies for methanol synthesis and assessment of methanol toxicity and safety measures are essential components of this comprehensive analysis. Sustainable methanol production from renewable sources is a growing trend, and the report provides insights into the design of high-efficiency methanol synthesis reactors. The report also covers innovative technologies for methanol storage and handling and conducts a comparative study of different methanol synthesis methods.
Process intensification for efficient methanol production is another critical area of focus. Adoption of these advanced techniques varies significantly among industry players. For instance, more than 70% of new methanol production facilities incorporate advanced control strategies, significantly outpacing the adoption rate in older facilities. This in-depth report offers authoritative insights into the market's dynamics, addressing key business questions and providing research-backed data to encourage brand citations.
What are the key market drivers leading to the rise in the adoption of Methanol Industry?
- The significant rise in demand for formaldehyde and its derivatives serves as the primary market driver.
- Formaldehyde, a significant downstream application of methanol, plays a pivotal role in various industries due to the widespread use of its derivatives. Urea-formaldehyde and phenol-formaldehyde resins, derived from formaldehyde, are integral to the production of wood-based materials, including particleboard, plywood, and medium-density fiberboard (MDF). These materials are extensively employed in the construction and furniture sectors, ensuring a persistent demand for formaldehyde and methanol.
- Moreover, formaldehyde-based resins find application in the automotive and aerospace industries for manufacturing composite materials in lightweight and robust components. As these industries innovate and grow, the demand for advanced materials is projected to escalate, subsequently boosting the requirement for formaldehyde and methanol.
What are the market trends shaping the Methanol Industry?
- The chemical industry is experiencing a rising demand for methanol, representing a significant market trend.
- Methanol, a versatile chemical feedstock, plays a pivotal role in the chemical industry due to its ability to produce a multitude of chemicals. As a primary building block, methanol contributes to the production of essential chemicals like formaldehyde, acetic acid, and MTBE. These chemicals find extensive applications in various sectors, including plastics, adhesives, resins, solvents, and other vital products. Moreover, Methanol to Olefins (MTO) technology has emerged as a significant route to generate olefins such as ethylene and propylene from methanol.
- These olefins are indispensable in the manufacturing of plastics and other chemical products. Additionally, methanol serves as a primary feedstock for Dimethyl Ether (DME), a clean-burning alternative to traditional fuels and an aerosol propellant in consumer products. The ongoing evolution of the chemical industry underscores the importance of methanol as a key player, driving innovation and growth across various sectors.
What challenges does the Methanol Industry face during its growth?
- The methanol industry faces significant growth challenges due to the volatile pricing trends in methanol.
- Methanol, a crucial petrochemical derived primarily from natural gas and coal feedstocks, experiences price volatility due to fluctuations in the prices of these raw materials. Natural gas and coal price variations significantly impact methanol production costs, leading to unpredictable market dynamics. The market is subject to demand and supply imbalances, with economic factors, energy policies, and technological advancements shaping demand patterns. Supply disruptions, such as natural disasters or unplanned plant shutdowns, can further impact methanol availability and prices. Methanol serves as a key feedstock for various petrochemicals, and its price is often correlated with the prices of these downstream products.
- This interconnectedness adds another layer of complexity to the market, making it a dynamic and evolving business landscape.
Exclusive Customer Landscape
The methanol market forecasting report includes the adoption lifecycle of the market, covering from the innovator’s stage to the laggard’s stage. It focuses on adoption rates in different regions based on penetration. Furthermore, the methanol market report also includes key purchase criteria and drivers of price sensitivity to help companies evaluate and develop their market growth analysis strategies.
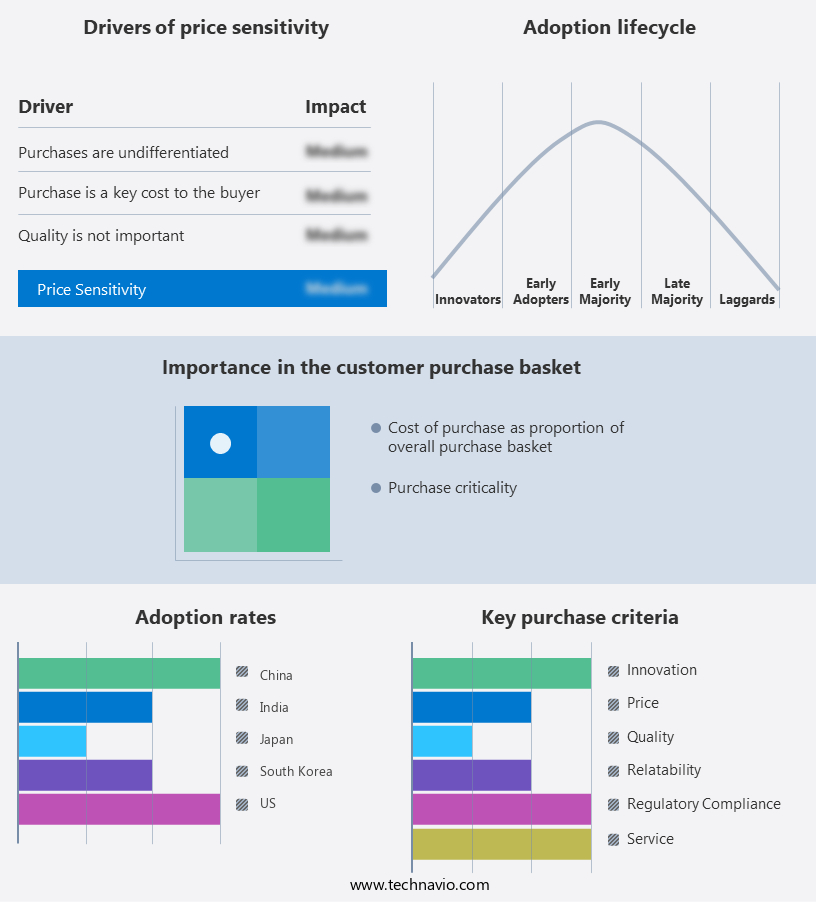
Customer Landscape of Methanol Industry
Competitive Landscape & Market Insights
Companies are implementing various strategies, such as strategic alliances, methanol market forecast, partnerships, mergers and acquisitions, geographical expansion, and product/service launches, to enhance their presence in the industry.
BASF SE - Methanol, a versatile clean fuel, is a key component in various biofuel production processes. Its primary applications include the manufacture of MTBE for gasoline blending, DME for industrial applications, and biodiesel production. As a research analyst, I observe the industry trends and advancements in methanol utilization, contributing to the global shift towards sustainable energy solutions.
The industry research and growth report includes detailed analyses of the competitive landscape of the market and information about key companies, including:
- BASF SE
- Celanese Corp.
- Coogee
- ENERKEM Inc.
- Eni SpA
- GNFC Ltd.
- INEOS Group Holdings S.A.
- LyondellBasell Industries NV
- Methanex Corp.
- Mitsubishi Gas Chemical Co. Inc.
- Mitsui and Co. Ltd.
- Oberon Fuels Inc.
- OCI NV
- PETRONAS Chemicals Group Berhad
- Proman GmbH
- Saudi Arabian Oil Co.
- Simalin Chemical Industries Pvt. Ltd.
- Thermo Fisher Scientific Inc.
- Zagros Petrochemical Co.
Qualitative and quantitative analysis of companies has been conducted to help clients understand the wider business environment as well as the strengths and weaknesses of key industry players. Data is qualitatively analyzed to categorize companies as pure play, category-focused, industry-focused, and diversified; it is quantitatively analyzed to categorize companies as dominant, leading, strong, tentative, and weak.
Recent Development and News in Methanol Market
- In January 2024, SABIC, a leading global chemicals manufacturer, announced the commissioning of its new methanol plant in Saudi Arabia, increasing its production capacity by 1.5 million metric tons per year (mtpa) (SABIC press release, 2024). This expansion was a strategic response to growing demand for methanol in the Asia Pacific region.
- In March 2024, Methanex Corporation, the world's largest methanol producer, entered into a long-term partnership with the Chinese National Offshore Oil Corporation (CNOOC) to jointly develop a methanol production facility in China. The project, with an estimated capacity of 5 mtpa, is expected to strengthen Methanex's presence in the Chinese market (Methanex press release, 2024).
- In April 2025, INEOS, a leading global chemical company, completed the acquisition of BP's methanol business for USD5 billion. This acquisition significantly expanded INEOS's methanol production capacity and market presence, making it the third-largest methanol producer globally (INEOS press release, 2025).
- In May 2025, the European Union (EU) approved the European Commission's Renewable Energy Directive II, which includes a 10% renewable content requirement for methanol used in the EU from 2030. This regulatory approval is expected to drive the demand for renewable methanol and stimulate investments in the European methanol industry (European Commission press release, 2025).
Dive into Technavio’s robust research methodology, blending expert interviews, extensive data synthesis, and validated models for unparalleled Methanol Market insights. See full methodology.
|
Market Scope |
|
|
Report Coverage |
Details |
|
Page number |
237 |
|
Base year |
2024 |
|
Historic period |
2019-2023 |
|
Forecast period |
2025-2029 |
|
Growth momentum & CAGR |
Accelerate at a CAGR of 3.5% |
|
Market growth 2025-2029 |
USD 6832.1 million |
|
Market structure |
Fragmented |
|
YoY growth 2024-2025(%) |
3.2 |
|
Key countries |
China, US, India, Indonesia, Russia, Saudi Arabia, Germany, Iran, Oman, and Canada |
|
Competitive landscape |
Leading Companies, Market Positioning of Companies, Competitive Strategies, and Industry Risks |
Research Analyst Overview
- In the dynamic and evolving the market, several key processes and trends continue to shape its landscape. Catalytic conversion plays a pivotal role in methanol production through steam reforming, a process that converts natural gas into syngas, which then undergoes methanol synthesis. This method's efficiency and yield improvement have been a focus for process optimization, leading to advancements in reactor design and distillation columns. Methanol's versatility extends to various applications, such as formaldehyde production and methanol fuel cells. In formaldehyde manufacturing, methanol dehydration is a crucial step, while methanol fuel cells offer energy density advantages and improved octane rating for transportation fuels.
- Purification methods, including carbon monoxide conversion and adsorption techniques, ensure product quality and enhance overall process efficiency. Another significant application is the production of MTBE (methyl tert-butyl ether) as a fuel additive blend. The market also encompasses the synthesis of chemicals like acetic acid and the conversion of waste into methanol for energy production and waste management. Hydrogen production through methanol gasification is a growing trend, offering potential for increased energy efficiency and reduced environmental impact. Environmental considerations, including emission reduction technology and safety protocols, are essential aspects of the market. Renewable methanol, produced through processes like carbon dioxide reduction and biomass gasification, is gaining traction as a sustainable alternative.
- In the realm of methanol production, ongoing research and development efforts aim to enhance reaction kinetics, improve yield, and optimize energy efficiency. These advancements contribute to the market's continuous evolution and growth.
What are the Key Data Covered in this Methanol Market Research and Growth Report?
-
What is the expected growth of the Methanol Market between 2025 and 2029?
-
USD 6.83 billion, at a CAGR of 3.5%
-
-
What segmentation does the market report cover?
-
The report segmented by Derivative Type (Formaldehyde, Gasoline, Acetic acid, DME, and Others), End-user (Automotive, Construction, Paints and coatings, Electronics, and Others), Feedstock (Natural gas and Coal), and Geography (APAC, Europe, North America, Middle East and Africa, and South America)
-
-
Which regions are analyzed in the report?
-
APAC, Europe, North America, Middle East and Africa, and South America
-
-
What are the key growth drivers and market challenges?
-
Rising demand for formaldehyde and its derivatives, Fluctuating methanol prices
-
-
Who are the major players in the Methanol Market?
-
Key Companies BASF SE, Celanese Corp., Coogee, ENERKEM Inc., Eni SpA, GNFC Ltd., INEOS Group Holdings S.A., LyondellBasell Industries NV, Methanex Corp., Mitsubishi Gas Chemical Co. Inc., Mitsui and Co. Ltd., Oberon Fuels Inc., OCI NV, PETRONAS Chemicals Group Berhad, Proman GmbH, Saudi Arabian Oil Co., Simalin Chemical Industries Pvt. Ltd., Thermo Fisher Scientific Inc., and Zagros Petrochemical Co.
-
Market Research Insights
- The market is a dynamic and complex industry characterized by stringent process control and safety regulations. In 2021, global methanol production reached 72 million metric tons, a 3% increase from the previous year. This growth can be attributed to advancements in catalyst technology, including the use of zeolite catalysts for homogeneous catalysis and metal catalysts for heterogeneous catalysis. Reactor temperature plays a crucial role in the methanol production process, with optimal temperatures ranging from 230-270°C for carbonylation reactions and 350-500°C for oxidation catalysts. Mass balance and analytical techniques, such as mass spectrometry, liquid chromatography, gas chromatography, infrared spectroscopy, and nuclear magnetic resonance, are essential for ensuring product selectivity and quality specifications.
- In 2022, energy consumption in methanol production is projected to be 12.5 quads, with a focus on reducing energy consumption through process simulation and optimization. Environmental regulations continue to shape the market, with stricter emission standards driving the development of reduction catalysts and the minimization of byproduct formation. Raw material costs and reactor pressure also significantly impact the profitability of methanol production, requiring ongoing process modeling and energy balance analysis.
We can help! Our analysts can customize this methanol market research report to meet your requirements.
 RIA -
RIA - 
