Floating Storage Regasification Unit (FSRU) Market Size 2026-2030
The Floating Storage Regasification Unit (FSRU) Market size was valued at USD 2.18 billion in 2025, growing at a CAGR of 9.1% during the forecast period 2026-2030.
Major Market Trends & Insights
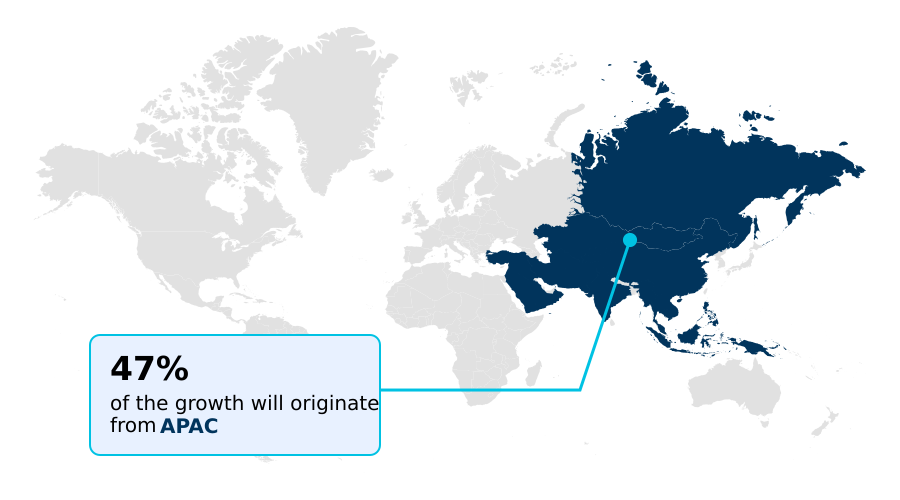
- APAC dominated the market and accounted for a 47.3% growth during the forecast period.
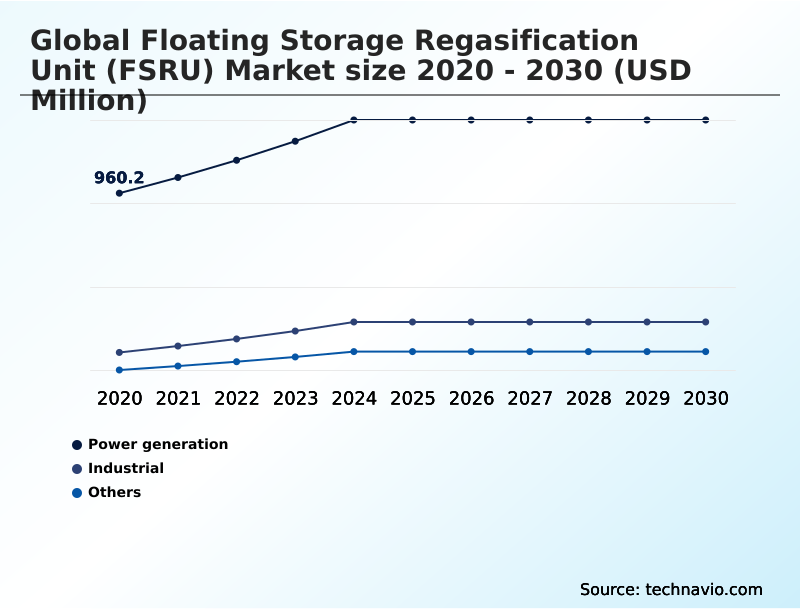
- By End-user - Power generation segment was valued at USD 1.26 billion in 2024
- By Type - Newly built segment accounted for the largest market revenue share in 2024
Market Size & Forecast
- Historic Market Opportunities 2020-2024: USD 1.85 billion
- Market Future Opportunities 2025-2030: USD 1.19 billion
- CAGR from 2025 to 2030 : 9.1%
Market Summary
- The Floating Storage Regasification Unit (FSRU) market is solidifying its position as a cornerstone of global energy security, with floating terminals now accounting for approximately 20% of total global regasification capacity. This growth is driven by the need for rapid deployment, as FSRUs can be installed in under 24 months, compared to the multi-year timeline for onshore facilities.
- A typical business scenario involves a national utility facing an urgent power deficit, which charters an FSRU to bridge the supply gap while permanent infrastructure is planned. However, the market faces a significant challenge from vessel scarcity, with new-build shipyard slots currently booked four years in advance, which constrains the ability to meet sudden demand surges.
- The market's trajectory is thus shaped by the interplay between the strategic imperative for flexible energy infrastructure and the physical limitations of the global shipbuilding supply chain, forcing a premium on available assets.
What will be the Size of the Floating Storage Regasification Unit (FSRU) Market during the forecast period?

Get Key Insights on Market Forecast (PDF) Request Free Sample
How is the Floating Storage Regasification Unit (FSRU) Market Segmented?
The floating storage regasification unit (fsru) industry research report provides comprehensive data (region-wise segment analysis), with forecasts and analysis for the period 2026-2030, as well as historical data from 2020-2024 for the following segments.
- End-user
- Power generation
- Industrial
- Others
- Type
- Newly built
- Converted
- Capacity
- Medium (1-5 MTPA)
- Large (above 5 MTPA)
- Small (less than 1 MTPA)
- Geography
- Middle East and Africa
- UAE
- Saudi Arabia
- APAC
- China
- India
- Japan
- Europe
- Germany
- Italy
- France
- North America
- US
- Canada
- Mexico
- South America
- Brazil
- Argentina
- Rest of World (ROW)
- Middle East and Africa
How is the Floating Storage Regasification Unit (FSRU) Market Segmented by End-user?
The power generation segment is estimated to witness significant growth during the forecast period.
The power generation segment commands over 72% of the Floating Storage Regasification Unit (FSRU) market, serving as the primary end-user for regasified natural gas.
This dominance is driven by the need for flexible baseload and peak-shaving power to complement intermittent renewable energy sources, where FSRUs provide a faster deployment model than onshore terminals.
Industrial applications, representing the second-largest segment, are growing at a rate approximately 15% slower than power generation, primarily utilizing gas for feedstock and thermal processes.
The operational advantage is clear, as integrated gas-to-power projects using FSRUs can be brought online significantly faster, bypassing lengthy onshore construction and permitting cycles for high-pressure gas transmission and subsea pipeline interfaces.

The Power generation segment was valued at USD 1.26 billion in 2024 and showed a gradual increase during the forecast period.
How demand for the Floating Storage Regasification Unit (FSRU) market is rising in the leading region?
APAC is estimated to contribute 47.3% to the growth of the global market during the forecast period.Technavio’s analysts have elaborately explained the regional trends and drivers that shape the market during the forecast period.
See How Floating Storage Regasification Unit (FSRU) Market demand is rising in APAC Request Free Sample
The geographic landscape of the Floating Storage Regasification Unit (FSRU) market is defined by a tale of two distinct strategic drivers, with APAC emerging as the epicenter of growth.
The region is projected to contribute over 47% of the market's incremental growth, expanding at a rate of 12.3%, significantly higher than Europe's 6.8%.
This expansion is fueled by industrialization and the coal-to-gas transition in nations like China and India, which are leveraging FSRUs to bypass the lengthy construction of land-based terminals.
For instance, China's demand is focused on high-capacity vessels to power its coastal manufacturing hubs. In contrast, Europe's adoption is driven by energy security, with countries like Germany and Italy rapidly deploying FSRUs to replace pipeline gas.
This has led to a focus on high-efficiency regasification modules and rapid ship-to-ship transfer protocols to ensure grid stability.
What are the key Drivers, Trends, and Challenges in the Floating Storage Regasification Unit (FSRU) Market?
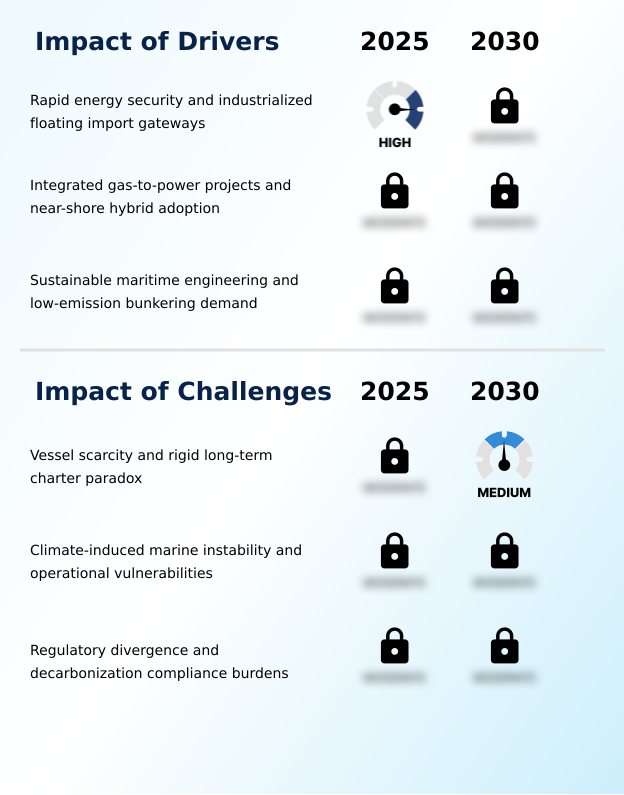
Our researchers analyzed the data with 2025 as the base year, along with the key drivers, trends, and challenges. A holistic analysis of drivers will help companies refine their marketing strategies to gain a competitive advantage.
- Strategic decision-making in the Floating Storage Regasification Unit (FSRU) market increasingly centers on a complex FSRU new build vs conversion cost analysis. While new-builds offer superior efficiency and a longer operational lifespan of over 25 years, conversions can be deployed up to 50% faster, providing a crucial speed-to-market advantage.
- This trade-off is further complicated by considerations of the environmental impact of FSRU vs land-based terminals, where modern floating units with closed-loop systems offer reduced thermal discharge. Securing capital for these high-value assets requires robust FSRU project financing and investment models, often backed by long-term government charters.
- The application of these assets is also diversifying, with small scale FSRU technology for island nations becoming a viable solution for displacing expensive diesel generation.
- Simultaneously, the pivotal role of FSRU in European energy security has been solidified, as these vessels have been instrumental in rapidly augmenting the continent's gas import capacity, demonstrating their indispensable function in the contemporary global energy matrix.
What are the key market drivers leading to the rise in the adoption of Floating Storage Regasification Unit (FSRU) Industry?
- The primary market driver is the demand for rapid energy security, which is industrializing the deployment of floating import gateways.
- The primary market driver is the global imperative for rapid energy security, with approximately 80% of new regasification projects in import-dependent regions now favoring Floating Storage Regasification Unit (FSRU) over land-based terminals.
- This preference is due to deployment timelines of less than 24 months, which is a significant acceleration compared to the multi-year construction of permanent facilities.
- This speed enables the proliferation of integrated gas-to-power projects, particularly in emerging economies seeking to reduce reliance on coal.
- The strategic adoption of near-shore hybrid FSRU models, leveraging high-efficiency heat exchangers, further supports this trend by minimizing the carbon footprint of the regasification process and providing targeted energy solutions for industrial hubs.
What are the market trends shaping the Floating Storage Regasification Unit (FSRU) Industry?
- A key market trend is the institutionalization of near-shore hybrid deployments. This involves the strategic integration of floating regasification units with dedicated gas-to-power infrastructure to enhance grid stability.
- The institutionalization of near-shore hybrid deployments is a defining trend, integrating floating regasification with dedicated gas-to-power infrastructure to improve grid stability by over 15%. This shift moves floating storage regasification units (FSRU) from standalone import gateways to foundational hubs for localized energy resilience.
- Concurrently, the industry is seeing a proliferation of fleet standardization, which allows for the construction of high-capacity vessels with over 170,000 cubic meters of storage while shortening construction cycles. This trend supports the strategic expansion of FSRU-enabled energy diversification, with these vessels now accounting for approximately 20% of global regasification capacity.
- As a result, FSRUs are no longer viewed as temporary fixes but as permanent, flexible components of national energy security strategies.
What challenges does the Floating Storage Regasification Unit (FSRU) Industry face during its growth?
- A key challenge affecting industry growth is vessel scarcity, creating a paradox where flexible assets are locked into rigid, long-term charters.
- A critical supply-side bottleneck, with new-build Floating Storage Regasification Unit (FSRU) shipyard slots booked four years in advance, is severely constraining market growth and flexibility. This vessel scarcity creates a paradox where charter agreements are becoming increasingly rigid and long-term, undermining the inherent mobility of the assets.
- The financial viability of projects is further challenged by high operational costs, which can be up to three times higher than those of land-based alternatives, especially when weather-induced downtime impacts utilization.
- Compounding these issues are fragmented regulatory frameworks that demand expensive retrofits with advanced reliquefaction modules to comply with tightening emissions standards, increasing both capital expenditure and legal complexity for operators.
Exclusive Technavio Analysis on Customer Landscape
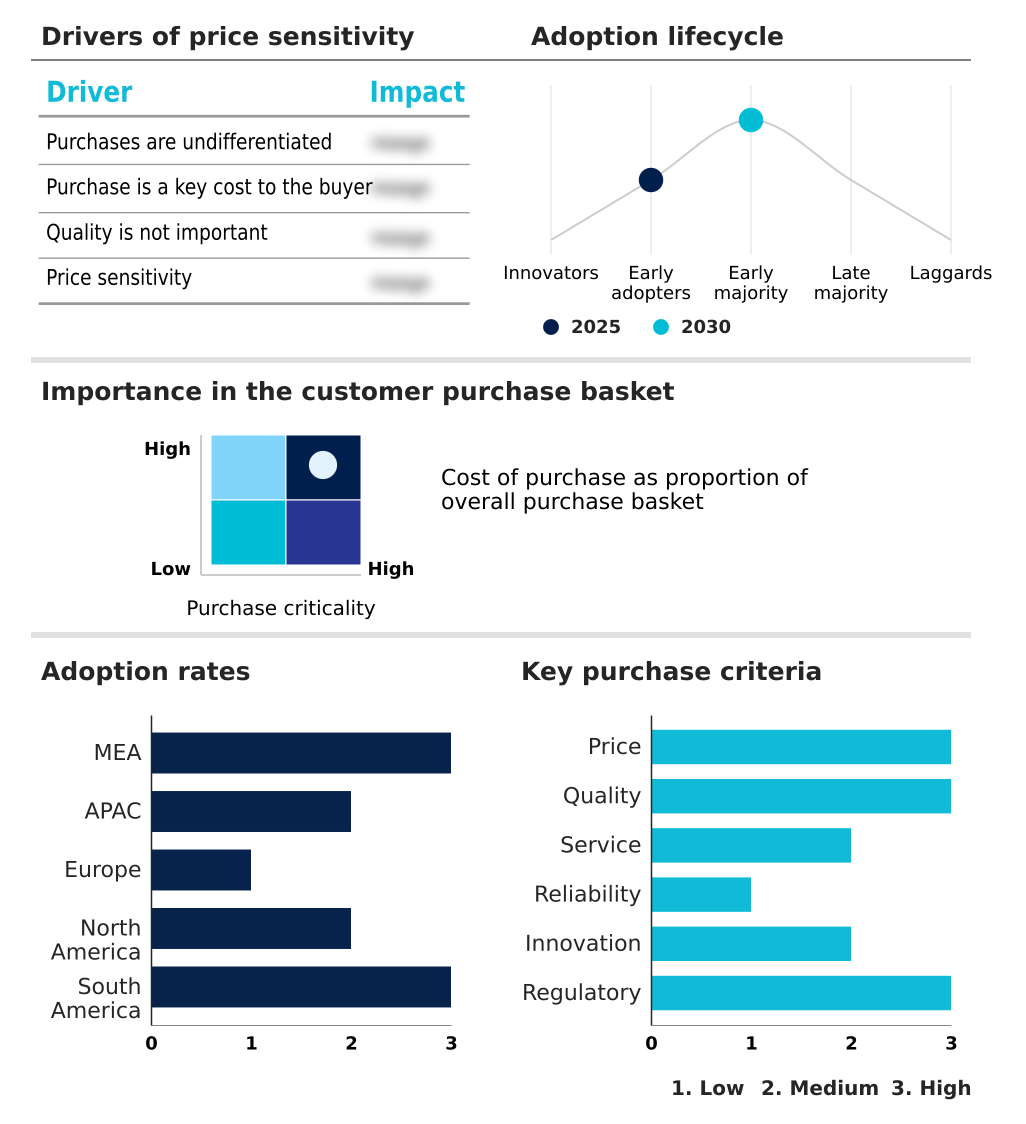
The floating storage regasification unit (fsru) market forecasting report includes the adoption lifecycle of the market, covering from the innovator’s stage to the laggard’s stage. It focuses on adoption rates in different regions based on penetration. Furthermore, the floating storage regasification unit (fsru) market report also includes key purchase criteria and drivers of price sensitivity to help companies evaluate and develop their market growth analysis strategies.
Customer Landscape of Floating Storage Regasification Unit (FSRU) Industry
Competitive Landscape
Companies are implementing various strategies, such as strategic alliances, floating storage regasification unit (fsru) market forecast, partnerships, mergers and acquisitions, geographical expansion, and product/service launches, to enhance their presence in the industry.
Bumi Armada Berhad - Specialists offer integrated LNG import solutions, featuring floating storage and regasification capabilities to enhance energy supply chain agility and access.
The industry research and growth report includes detailed analyses of the competitive landscape of the market and information about key companies, including:
- Bumi Armada Berhad
- BW Group
- Dynagas LNG Partners LP
- Energos Infrastructure
- Excelerate Energy Inc.
- Exmar NV
- Hoegh EVI
- JSK Shipping
- Karadeniz Holding A.S.
- LNG Croatia LLC
- Mitsui O.S.K. Lines Ltd.
- New Fortress Energy Inc.
- OLT Offshore LNG Toscana SpA
- RWE AG
- Sener Group
- Snam S.p.A.
- Swan Energy Ltd.
Qualitative and quantitative analysis of companies has been conducted to help clients understand the wider business environment as well as the strengths and weaknesses of key industry players. Data is qualitatively analyzed to categorize companies as pure play, category-focused, industry-focused, and diversified; it is quantitatively analyzed to categorize companies as dominant, leading, strong, tentative, and weak.
Market Intelligence Radar: High-Impact Developments & Growth Signals
- In the Marine Transportation industry, the enforcement of stricter decarbonization mandates, such as the International Maritime Organization's Carbon Intensity Indicator (CII), has directly increased the adoption of LNG as a marine fuel. This shift boosts the demand for Floating Storage Regasification Unit (FSRU) to be configured as offshore bunkering hubs, creating a new service vertical beyond traditional regasification for power grids.
- A significant supply chain shift within the Marine Transportation industry involves the strategic redeployment of the global LNG carrier fleet to serve new geopolitical energy security priorities. This has created a scarcity of vessels available for conversion into Floating Storage Regasification Unit (FSRU), driving up charter rates by over 50% for available units and extending project timelines for nations seeking rapid import solutions.
- The push for digitalization across the Marine Transportation industry has led to the widespread adoption of digital twin technology and AI-powered predictive maintenance for high-value assets. For Floating Storage Regasification Unit (FSRU) operators, this means enhanced operational efficiency through optimized boil-off gas management and predictive monitoring of cryogenic containment systems, reducing unplanned downtime by up to 15%.
- An expansion in the small-scale LNG economy within the Marine Transportation industry is creating new demand for smaller, more agile Floating Storage Regasification Unit (FSRU). This development enables energy delivery to remote island nations and isolated coastal communities, where smaller vessels can navigate shallower ports, bypassing the need for extensive subsea pipeline interfaces required by large-scale projects.
Dive into Technavio’s robust research methodology, blending expert interviews, extensive data synthesis, and validated models for unparalleled Floating Storage Regasification Unit (FSRU) Market insights. See full methodology.
| Market Scope | |
|---|---|
| Page number | 294 |
| Base year | 2025 |
| Historic period | 2020-2024 |
| Forecast period | 2026-2030 |
| Growth momentum & CAGR | Accelerate at a CAGR of 9.1% |
| Market growth 2026-2030 | USD 1193.0 million |
| Market structure | Fragmented |
| YoY growth 2025-2026(%) | 8.4% |
| Key countries | Iran, Qatar, UAE, Egypt, Saudi Arabia, China, India, Japan, South Korea, Indonesia, Australia, Germany, Italy, France, UK, Spain, The Netherlands, US, Canada, Mexico, Brazil, Argentina and Chile |
| Competitive landscape | Leading Companies, Market Positioning of Companies, Competitive Strategies, and Industry Risks |
Research Analyst Overview
- The Floating Storage Regasification Unit (FSRU) market ecosystem is a concentrated network where newly built units, representing over 65% of the market value, showcase the influence of specialized shipbuilders. These suppliers provide high-value assets to a select group of operators, who in turn secure long-term charters with national utilities and industrial end-users.
- Regulatory bodies and port authorities act as crucial gatekeepers, mandating stringent safety and environmental standards for terminal deployment. The entire value chain, from engineering and procurement firms to logistics providers, is geared toward supporting the world's approximately 50 operational FSRUs.
- This structure highlights a high barrier to entry and underscores the codependency between technology providers and energy off-takers in ensuring global gas supply flexibility and security.
What are the Key Data Covered in this Floating Storage Regasification Unit (FSRU) Market Research and Growth Report?
-
What is the expected growth of the Floating Storage Regasification Unit (FSRU) Market between 2026 and 2030?
-
The Floating Storage Regasification Unit (FSRU) Market is expected to grow by USD 1.19 billion during 2026-2030, registering a CAGR of 9.1%. Year-over-year growth in 2026 is estimated at 8.4%%. This acceleration is shaped by rapid energy security and industrialized floating import gateways, which is intensifying demand across multiple end-use verticals covered in the report.
-
-
What segmentation does the market report cover?
-
The report is segmented by End-user (Power generation, Industrial, and Others), Type (Newly built, and Converted), Capacity (Medium (1-5 MTPA), Large (above 5 MTPA), and Small (less than 1 MTPA)) and Geography (Middle East and Africa, APAC, Europe, North America, South America). Among these, the Power generation segment is estimated to witness significant growth during the forecast period, driven by rising adoption across key application areas. Each segment includes detailed qualitative and quantitative analysis, along with historical data from 2020-2024 and forecasts through 2030 with year-over-year growth rates.
-
-
Which regions are analyzed in the report?
-
The report covers Middle East and Africa, APAC, Europe, North America and South America. APAC is estimated to contribute 47.3% to market growth during the forecast period. Country-level analysis includes Iran, Qatar, UAE, Egypt, Saudi Arabia, China, India, Japan, South Korea, Indonesia, Australia, Germany, Italy, France, UK, Spain, The Netherlands, US, Canada, Mexico, Brazil, Argentina and Chile, with dedicated market size tables and year-over-year growth for each.
-
-
What are the key growth drivers and market challenges?
-
The primary driver is rapid energy security and industrialized floating import gateways, which is accelerating investment and industry demand. The main challenge is vessel scarcity and rigid long-term charter paradox, creating operational barriers for key market participants. The report quantifies the impact of each driver and challenge across 2026 and 2030 with comparative analysis.
-
-
Who are the major players in the Floating Storage Regasification Unit (FSRU) Market?
-
Key vendors include Bumi Armada Berhad, BW Group, Dynagas LNG Partners LP, Energos Infrastructure, Excelerate Energy Inc., Exmar NV, Hoegh EVI, JSK Shipping, Karadeniz Holding A.S., LNG Croatia LLC, Mitsui O.S.K. Lines Ltd., New Fortress Energy Inc., OLT Offshore LNG Toscana SpA, RWE AG, Sener Group, Snam S.p.A. and Swan Energy Ltd.. The report provides qualitative and quantitative analysis categorizing companies as dominant, leading, strong, tentative, and weak based on their market positioning. Company profiles include business segment analysis, SWOT assessment, key offerings, and recent strategic developments.
-
Market Research Insights
- The competitive landscape for the approximately 50 operational Floating Storage Regasification Unit (FSRU) is intensifying as key players pivot from simple chartering to providing comprehensive, integrated energy solutions. Market leaders such as Excelerate Energy Inc. and Hoegh EVI are at the forefront, developing complex terminal projects that include downstream gas delivery.
- A key development is the initiation of projects like the Zeeland Energy Terminal, which aims to add 7.5 billion cubic meters of annual send-out capacity to enhance European energy security. This move reflects a broader industry response to geopolitical pressures, where the strategic value of an FSRU is measured by its contribution to national supply resilience.
- However, this expansion is constrained by a critical scarcity of available vessels, forcing companies to balance long-term, high-value infrastructure projects against the immediate demand for flexible, short-term charters.
We can help! Our analysts can customize this floating storage regasification unit (fsru) market research report to meet your requirements.
 RIA -
RIA - 
