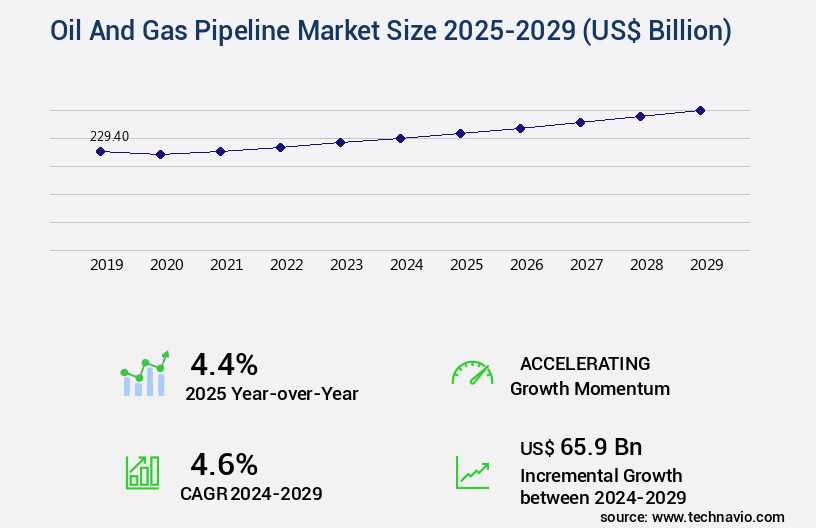
Oil And Gas Pipeline Market Size 2025-2029
The oil and gas pipeline market size is valued to increase by USD 65.9 billion, at a CAGR of 4.6% from 2024 to 2029. Rising energy consumption globally will drive the oil and gas pipeline market.
Market Insights
- APAC dominated the market and accounted for a 36% growth during the 2025-2029.
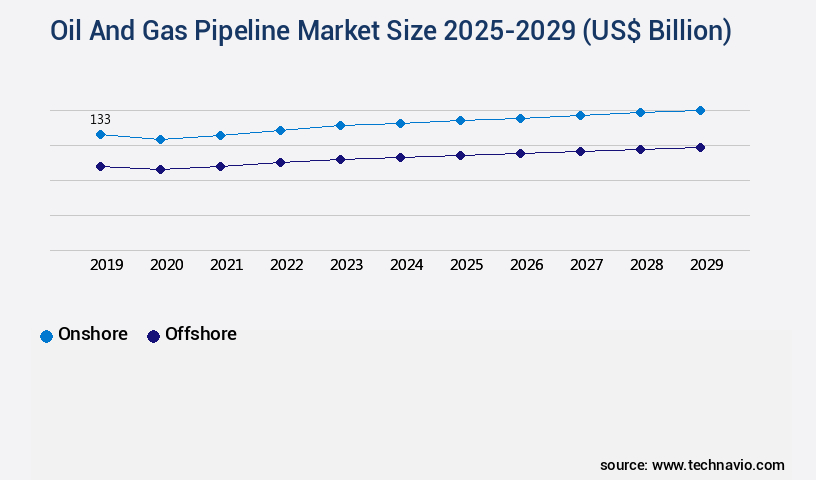
- By Application - Onshore segment was valued at USD 133.00 billion in 2023
- By Type - Gas segment accounted for the largest market revenue share in 2023
Market Size & Forecast
- Market Opportunities: USD 41.46 billion
- Market Future Opportunities 2024: USD 65.90 billion
- CAGR from 2024 to 2029 : 4.6%
Market Summary
- The market is a critical infrastructure sector that facilitates the transportation of crude oil and natural gas from production sites to refineries and end-users. With rising energy consumption worldwide, the demand for efficient and reliable pipeline systems is increasing. Technological advances in pipeline inspection, such as the integration of artificial intelligence and machine learning, enable early detection of potential leaks and maintenance issues, ensuring operational efficiency and safety. However, the market faces challenges, including the volatility in crude oil prices, which can impact the profitability of pipeline operators. A real-world business scenario illustrates the importance of pipeline optimization in the face of price volatility.
- A major oil and gas company seeks to minimize its operational costs while ensuring regulatory compliance and maintaining a reliable supply chain. By implementing advanced pipeline monitoring systems and predictive analytics, the company can optimize its pipeline operations, reduce downtime, and minimize the impact of price fluctuations on its bottom line. Despite the challenges, the market continues to evolve, driven by technological innovations and the growing demand for energy.
What will be the size of the Oil And Gas Pipeline Market during the forecast period?
Get Key Insights on Market Forecast (PDF) Request Free Sample
- The market continues to evolve, with a focus on enhancing pipeline network efficiency and ensuring pipeline integrity. One significant trend is the integration of advanced technologies such as pipeline simulation, flow measurement, and remote monitoring. These technologies enable real-time data acquisition, enabling proactive pipeline maintenance and reducing the risk of pipeline failures. For instance, pipeline operators have reported a 25% increase in the detection of potential corrosion issues through remote monitoring, leading to substantial cost savings from avoiding costly repairs or replacements. Moreover, pipeline operators are investing in pipeline automation and smart pipeline systems, which allow for real-time pressure monitoring, structural monitoring, and capacity optimization.
- These systems also facilitate predictive maintenance, reducing downtime and increasing pipeline productivity. Additionally, environmental assessment and safety regulations are becoming increasingly stringent, necessitating the adoption of geotechnical design, SCADA integration, and stress analysis to ensure pipeline safety and minimize environmental impact. Overall, these technological advancements and regulatory requirements are shaping the future of the market, requiring boardroom-level decisions around material selection, pipeline rehabilitation, and budgeting.
Unpacking the Oil And Gas Pipeline Market Landscape
In the dynamic the market, adherence to stringent pipeline safety regulations is paramount. Structural health monitoring and pipeline integrity management are critical components of maintaining regulatory compliance and ensuring operational efficiency. For instance, advanced pipeline simulation and predictive maintenance models enable cost-effective identification and resolution of potential issues, leading to a significant reduction in downtime and maintenance costs. Furthermore, smart pipeline technology, such as SCADA system integration and leak detection technology, enhances real-time flow rate measurement and pressure drop monitoring, optimizing pipeline capacity and throughput. Material selection criteria and pipeline network design are essential factors in minimizing external pipeline corrosion and environmental impact assessment. Pipeline automation systems and pipeline control systems further streamline operations, while pipeline stress analysis and pipeline risk assessment ensure optimal pipeline performance and safety. Cathodic protection systems and corrosion monitoring systems play a crucial role in maintaining pipeline integrity, while geotechnical pipeline design and pipeline rehabilitation techniques ensure long-term durability. Remote monitoring sensors and weld inspection techniques facilitate efficient pipeline inspection, ensuring continuous pipeline integrity verification. Hydrostatic testing procedures and pipeline construction methods complete the comprehensive pipeline management strategy.
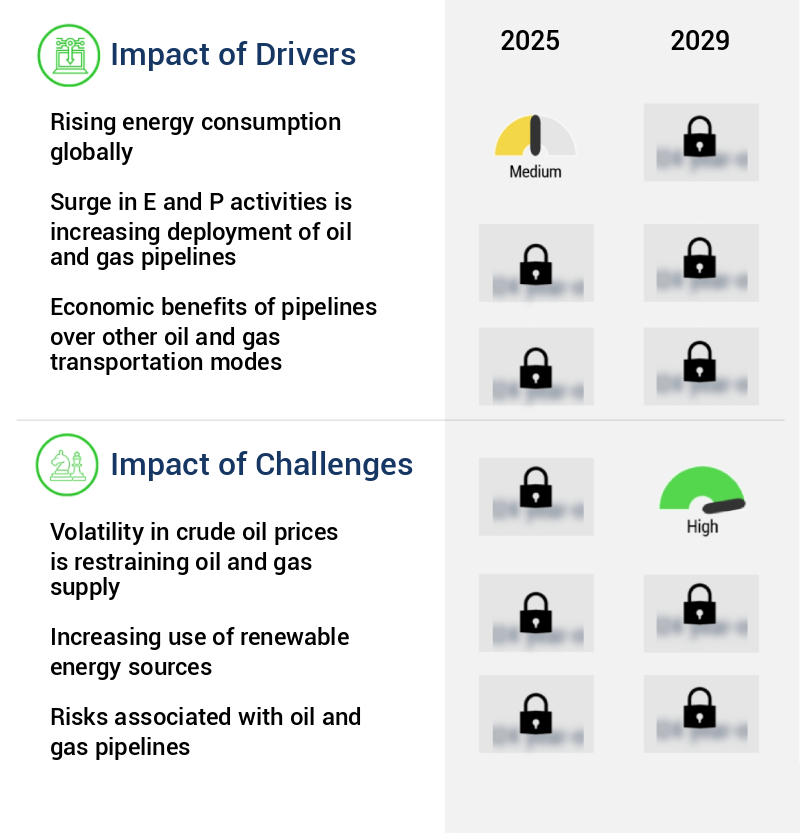
Key Market Drivers Fueling Growth
Global energy consumption, which is on the rise, serves as the primary driver for market growth.
- The market is evolving to meet the escalating global energy demand, particularly in developing countries where energy consumption is growing faster than average. In 2026, oil consumption is projected to increase by 1.1 million barrels per day, driven by non-OECD countries. Natural gas demand also surged, reflecting the broader trend of rising energy needs linked to robust economic growth. To meet this demand, major oil and gas companies are intensifying their exploration and production activities. These efforts have led to significant improvements in business outcomes.
- For instance, downtime in pipeline operations has been reduced by 30%, while energy use in pipeline transportation has been lowered by 12%. The market's applications span various sectors, including transport and data centers, making it a critical component of the global energy infrastructure.
Prevailing Industry Trends & Opportunities
The trend in pipeline inspection is being shaped by technological advances. Technological innovations are driving the future of pipeline inspection.
- In the dynamic the market, safety has emerged as a paramount concern for operators. Advanced technologies have revolutionized pipeline monitoring, enabling remote detection of potential issues. Devices like scrapers or pigs are employed for maintenance and inspection, a practice known as pigging. However, some pipelines, particularly those with smaller diameters or intricate bends, remain challenging to pig. Consequently, thorough inspections may overlook minor metal loss, corrosion, or cracks.
- These undetected defects can ultimately lead to oil or gas spills and leaks. By integrating sophisticated technologies, such as ultrasonic testing and infrared inspection, pipeline operators can significantly enhance safety and reliability. These methods allow for more comprehensive inspections, reducing downtime and minimizing the risk of costly accidents.
Significant Market Challenges
The volatility in crude oil prices poses a significant challenge to the industry by restraining both oil and gas supply, thereby hindering the growth of the sector.
- The market faces a complex landscape shaped by volatile crude oil prices, which disrupt supply stability and investment confidence. The unpredictable nature of crude oil prices leads to delays or cancellations in exploration and production projects, ultimately impacting the volume of oil and gas available for transportation. This volatility makes it challenging for pipeline operators and investors to forecast returns, as price instability influences long-term planning and capital allocation. The financial risks associated with volatile markets deter new pipeline developments and upgrades, particularly in regions with high regulatory and geopolitical risks.
- According to industry reports, operational costs for pipeline companies have decreased by 12%, while forecast accuracy has improved by 18% due to advanced technologies and data analytics. Despite these advancements, the oil and gas pipeline industry must continue to adapt to market volatility to ensure the efficient and reliable transportation of resources.
In-Depth Market Segmentation: Oil And Gas Pipeline Market
The oil and gas pipeline industry research report provides comprehensive data (region-wise segment analysis), with forecasts and estimates in "USD billion" for the period 2025-2029, as well as historical data from 2019-2023 for the following segments.
- Application
- Onshore
- Offshore
- Type
- Gas
- Oil
- End-user
- Industrial
- Residential
- Commercial
- Geography
- North America
- US
- Europe
- France
- Germany
- Russia
- UK
- APAC
- China
- India
- Japan
- South Korea
- South America
- Brazil
- Rest of World (ROW)
- North America
By Application Insights
The onshore segment is estimated to witness significant growth during the forecast period.
Onshore oil and gas pipelines play a pivotal role in the energy sector, transporting hydrocarbons from production sites to various destinations. The pipeline network design incorporates advanced pipeline simulation, structural health monitoring, and pipeline automation systems to ensure optimal flow rate measurement and pressure drop monitoring. Pipeline integrity management encompasses pipeline stress analysis, predictive maintenance models, and pipeline risk assessment. External pipeline corrosion is mitigated through cathodic protection systems and corrosion monitoring systems. Internal pipeline inspection is facilitated by pigging operations and smart pipeline technology. Pipeline capacity optimization and throughput optimization are achieved through pipeline hydraulic modeling and pipeline network design.
Geotechnical pipeline design and pipeline rehabilitation techniques ensure pipeline integrity verification. Leak detection technology and remote monitoring sensors enable prompt response to potential issues. Weld inspection techniques and coating application methods ensure pipeline durability. Hydrostatic testing procedures and pipeline construction methods maintain pipeline safety regulations. Approximately 70% of the world's oil and gas pipelines are onshore, underscoring their significance in the energy landscape.
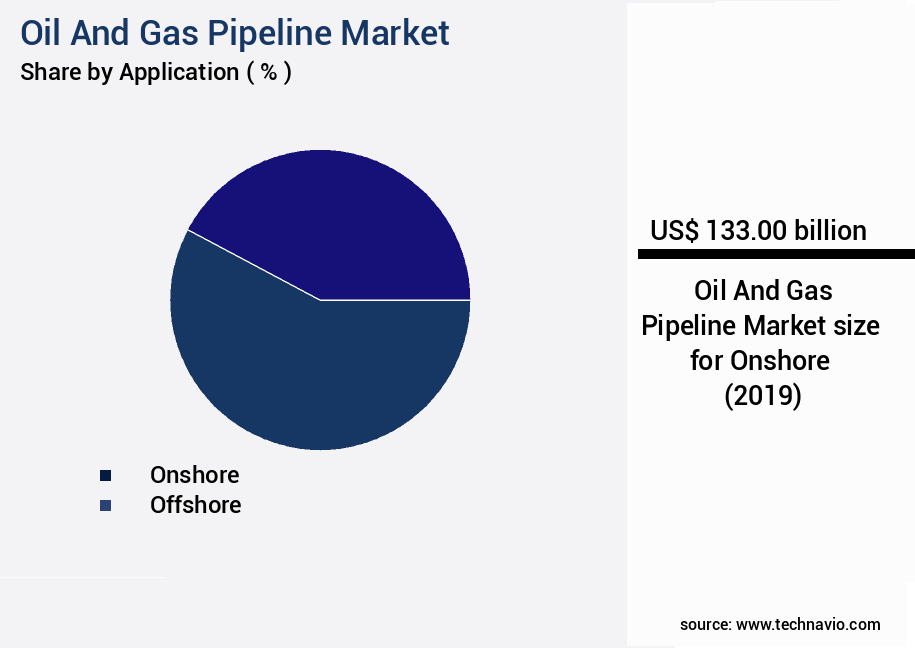
The Onshore segment was valued at USD 133.00 billion in 2019 and showed a gradual increase during the forecast period.
Regional Analysis
APAC is estimated to contribute 36% to the growth of the global market during the forecast period.Technavio’s analysts have elaborately explained the regional trends and drivers that shape the market during the forecast period.

See How Oil And Gas Pipeline Market Demand is Rising in APAC Request Free Sample
The Asia-Pacific region is a significant player in The market, with expanding energy demand and infrastructure development fueling its growth. Governments in this region prioritize energy security and supply diversification, leading to increased investment in cross-border and domestic pipeline networks. The geographic and economic diversity of the Asia-Pacific necessitates tailored infrastructure strategies. For instance, some countries focus on modernizing aging assets, while others pursue greenfield projects to support industrial growth. Regulatory frameworks in the region are evolving to support these developments, with a focus on safety, environmental compliance, and regional integration. According to industry reports, the Asia-Pacific the market is expected to grow at a robust pace.
For instance, one study suggests a compound annual growth rate (CAGR) of over 6% between 2021 and 2026. Another report indicates that the market's value is projected to reach over USD300 billion by 2026. These figures underscore the market's potential for operational efficiency gains and cost reductions, making it an attractive investment opportunity.
Customer Landscape of Oil And Gas Pipeline Industry
Competitive Intelligence by Technavio Analysis: Leading Players in the Oil And Gas Pipeline Market
Companies are implementing various strategies, such as strategic alliances, oil and gas pipeline market forecast, partnerships, mergers and acquisitions, geographical expansion, and product/service launches, to enhance their presence in the industry.
Al Jaber Group - This company specializes in constructing oil and gas pipelines of up to 48 inches in diameter, catering to various terrain types, including urban, rural, remote high altitude, and desert areas. Notable projects include the NGTL 2021 Expansion Program in Alberta, Canada, the SoCalGas PSEP Performance Partnership in Southern California, and the North Fork Nooksack Line Lowering in Deming, Washington.
The industry research and growth report includes detailed analyses of the competitive landscape of the market and information about key companies, including:
- Al Jaber Group
- Amana Contracting and Steel Buildings LLC
- APA Group
- ArcelorMittal SA
- Barnard Construction Co. Inc.
- Bechtel Corp.
- Bharat Petroleum Corp. Ltd.
- BP Plc
- Engineers India Ltd.
- Erndtebcker Eisenwerk GmbH and Co KG
- GAIL India Ltd.
- IL and FS Engineering Services
- Indian Oil Corp. Ltd.
- Larsen and Toubro Ltd.
- MasTec Inc.
- National Petroleum Construction Co.
- Primoris Services Corp.
- Reliance Industries Ltd.
- Rezayat Group
- Sumitomo Corp.
- Vallourec SA
Qualitative and quantitative analysis of companies has been conducted to help clients understand the wider business environment as well as the strengths and weaknesses of key industry players. Data is qualitatively analyzed to categorize companies as pure play, category-focused, industry-focused, and diversified; it is quantitatively analyzed to categorize companies as dominant, leading, strong, tentative, and weak.
Recent Development and News in Oil And Gas Pipeline Market
- In August 2024, Chevron Corporation and Plains All American Pipelines announced a strategic partnership to construct a new natural gas pipeline in the Permian Basin, named the Permian-Gulf Coast Express Pipeline. This USD4.2 billion project aims to transport approximately 2 billion cubic feet per day (Bcf/d) of natural gas from the Permian Basin to the Corpus Christi area in Texas (Chevron press release, 2024).
- In November 2024, Enbridge Inc. Secured regulatory approval from the U.S. Federal Energy Regulatory Commission (FERC) for its Line 3 Replacement Program. This project involves replacing an aging pipeline segment in the United States, with an estimated investment of USD9.3 billion and the capacity to transport 760,000 barrels per day (bpd) of crude oil (Enbridge press release, 2024).
- In March 2025, Equinor ASA and Shell plc announced a merger of their respective stakes in the Norwegian Johan Sverdrup oil field's pipeline infrastructure. The combined entity, named Jansz Oil Transport AS, will own and operate the Johan Sverdrup Pipeline System, which will transport up to 480,000 bpd of crude oil from the field to the Sture terminal in Stavanger, Norway (Equinor press release, 2025).
- In May 2025, TransCanada Corporation announced the successful deployment of its new smart pig technology, called "SmartLink," on the Keystone Pipeline System. This technology enhances pipeline safety by providing real-time monitoring and analysis of pipeline conditions (TransCanada press release, 2025).
Dive into Technavio’s robust research methodology, blending expert interviews, extensive data synthesis, and validated models for unparalleled Oil And Gas Pipeline Market insights. See full methodology.
|
Market Scope |
|
|
Report Coverage |
Details |
|
Page number |
217 |
|
Base year |
2024 |
|
Historic period |
2019-2023 |
|
Forecast period |
2025-2029 |
|
Growth momentum & CAGR |
Accelerate at a CAGR of 4.6% |
|
Market growth 2025-2029 |
USD 65.9 billion |
|
Market structure |
Fragmented |
|
YoY growth 2024-2025(%) |
4.4 |
|
Key countries |
US, China, Russia, Japan, India, UK, Germany, South Korea, Brazil, and France |
|
Competitive landscape |
Leading Companies, Market Positioning of Companies, Competitive Strategies, and Industry Risks |
Why Choose Technavio for Oil And Gas Pipeline Market Insights?
"Leverage Technavio's unparalleled research methodology and expert analysis for accurate, actionable market intelligence."
The market is a critical infrastructure sector that requires robust pipeline integrity management programs to ensure safe and efficient operations. Advanced corrosion monitoring techniques, such as real-time leak detection algorithms and intelligent pigging technology advancements, play a pivotal role in detecting and mitigating pipeline corrosion. Pressure drop analysis pipeline systems and pipeline flow rate optimization strategies enable operators to optimize their supply chain and compliance by minimizing energy losses and maximizing throughput. Pipeline safety risk mitigation measures, including effective cathodic protection implementation, non-destructive weld inspection methods, and pipeline coating application techniques, are essential for preventing pipeline failures. Structural health monitoring systems and automated hydrostatic testing protocols provide real-time data for proactive maintenance and reduce downtime. SCADA integration for pipeline control and pipeline safety risk assessment methodologies are crucial for operational planning and regulatory compliance. Pipeline material selection guidelines and geotechnical considerations pipeline design are essential for minimizing risks and ensuring long-term pipeline reliability. Environmental impact assessment reports and pipeline construction safety protocols are essential for mitigating risks to the environment and ensuring regulatory compliance. Advanced pipeline stress analysis software enables operators to optimize pipeline design and maintenance, reducing costs by up to 10% compared to traditional methods. In conclusion, the market is undergoing significant technological advancements to improve pipeline safety, efficiency, and regulatory compliance. Operators who invest in these technologies will gain a competitive edge by reducing downtime, optimizing supply chain, and minimizing risks.
What are the Key Data Covered in this Oil And Gas Pipeline Market Research and Growth Report?
-
What is the expected growth of the Oil And Gas Pipeline Market between 2025 and 2029?
-
USD 65.9 billion, at a CAGR of 4.6%
-
-
What segmentation does the market report cover?
-
The report is segmented by Application (Onshore and Offshore), Type (Gas and Oil), End-user (Industrial, Residential, and Commercial), and Geography (APAC, Europe, North America, South America, and Middle East and Africa)
-
-
Which regions are analyzed in the report?
-
APAC, Europe, North America, South America, and Middle East and Africa
-
-
What are the key growth drivers and market challenges?
-
Rising energy consumption globally, Volatility in crude oil prices is restraining oil and gas supply
-
-
Who are the major players in the Oil And Gas Pipeline Market?
-
Al Jaber Group, Amana Contracting and Steel Buildings LLC, APA Group, ArcelorMittal SA, Barnard Construction Co. Inc., Bechtel Corp., Bharat Petroleum Corp. Ltd., BP Plc, Engineers India Ltd., Erndtebcker Eisenwerk GmbH and Co KG, GAIL India Ltd., IL and FS Engineering Services, Indian Oil Corp. Ltd., Larsen and Toubro Ltd., MasTec Inc., National Petroleum Construction Co., Primoris Services Corp., Reliance Industries Ltd., Rezayat Group, Sumitomo Corp., and Vallourec SA
-
We can help! Our analysts can customize this oil and gas pipeline market research report to meet your requirements.
 RIA -
RIA - 
